State Child Tax Credits and Child Poverty: A 50-State Analysis
reportAuthors

This report was authored by Sophie Collyer, Megan Curran, Aidan Davis, David Harris and Christopher Wimer and conducted by the Institute on Taxation and Economic Policy and the Center on Poverty and Social Policy at Columbia University on behalf of Share Our Strength.
Key Findings
➜ The temporary 2021 federal Child Tax Credit expansion dramatically reduced child poverty and material hardship. Extending the federal policy would provide the broadest poverty reduction across the country. States can also build on the success of the credit. This report presents state Child Tax Credit options that would reduce state child poverty rates by 25 or 50 percent when coupled with existing federal law, which provides a maximum of $2,000 per child, is not fully refundable and phases in with earnings.
➜ There is increasing momentum in the states toward adopting and expanding Child Tax Credits. Heading into 2023, ten states currently have some form of a Child Tax Credit and many others are considering one.
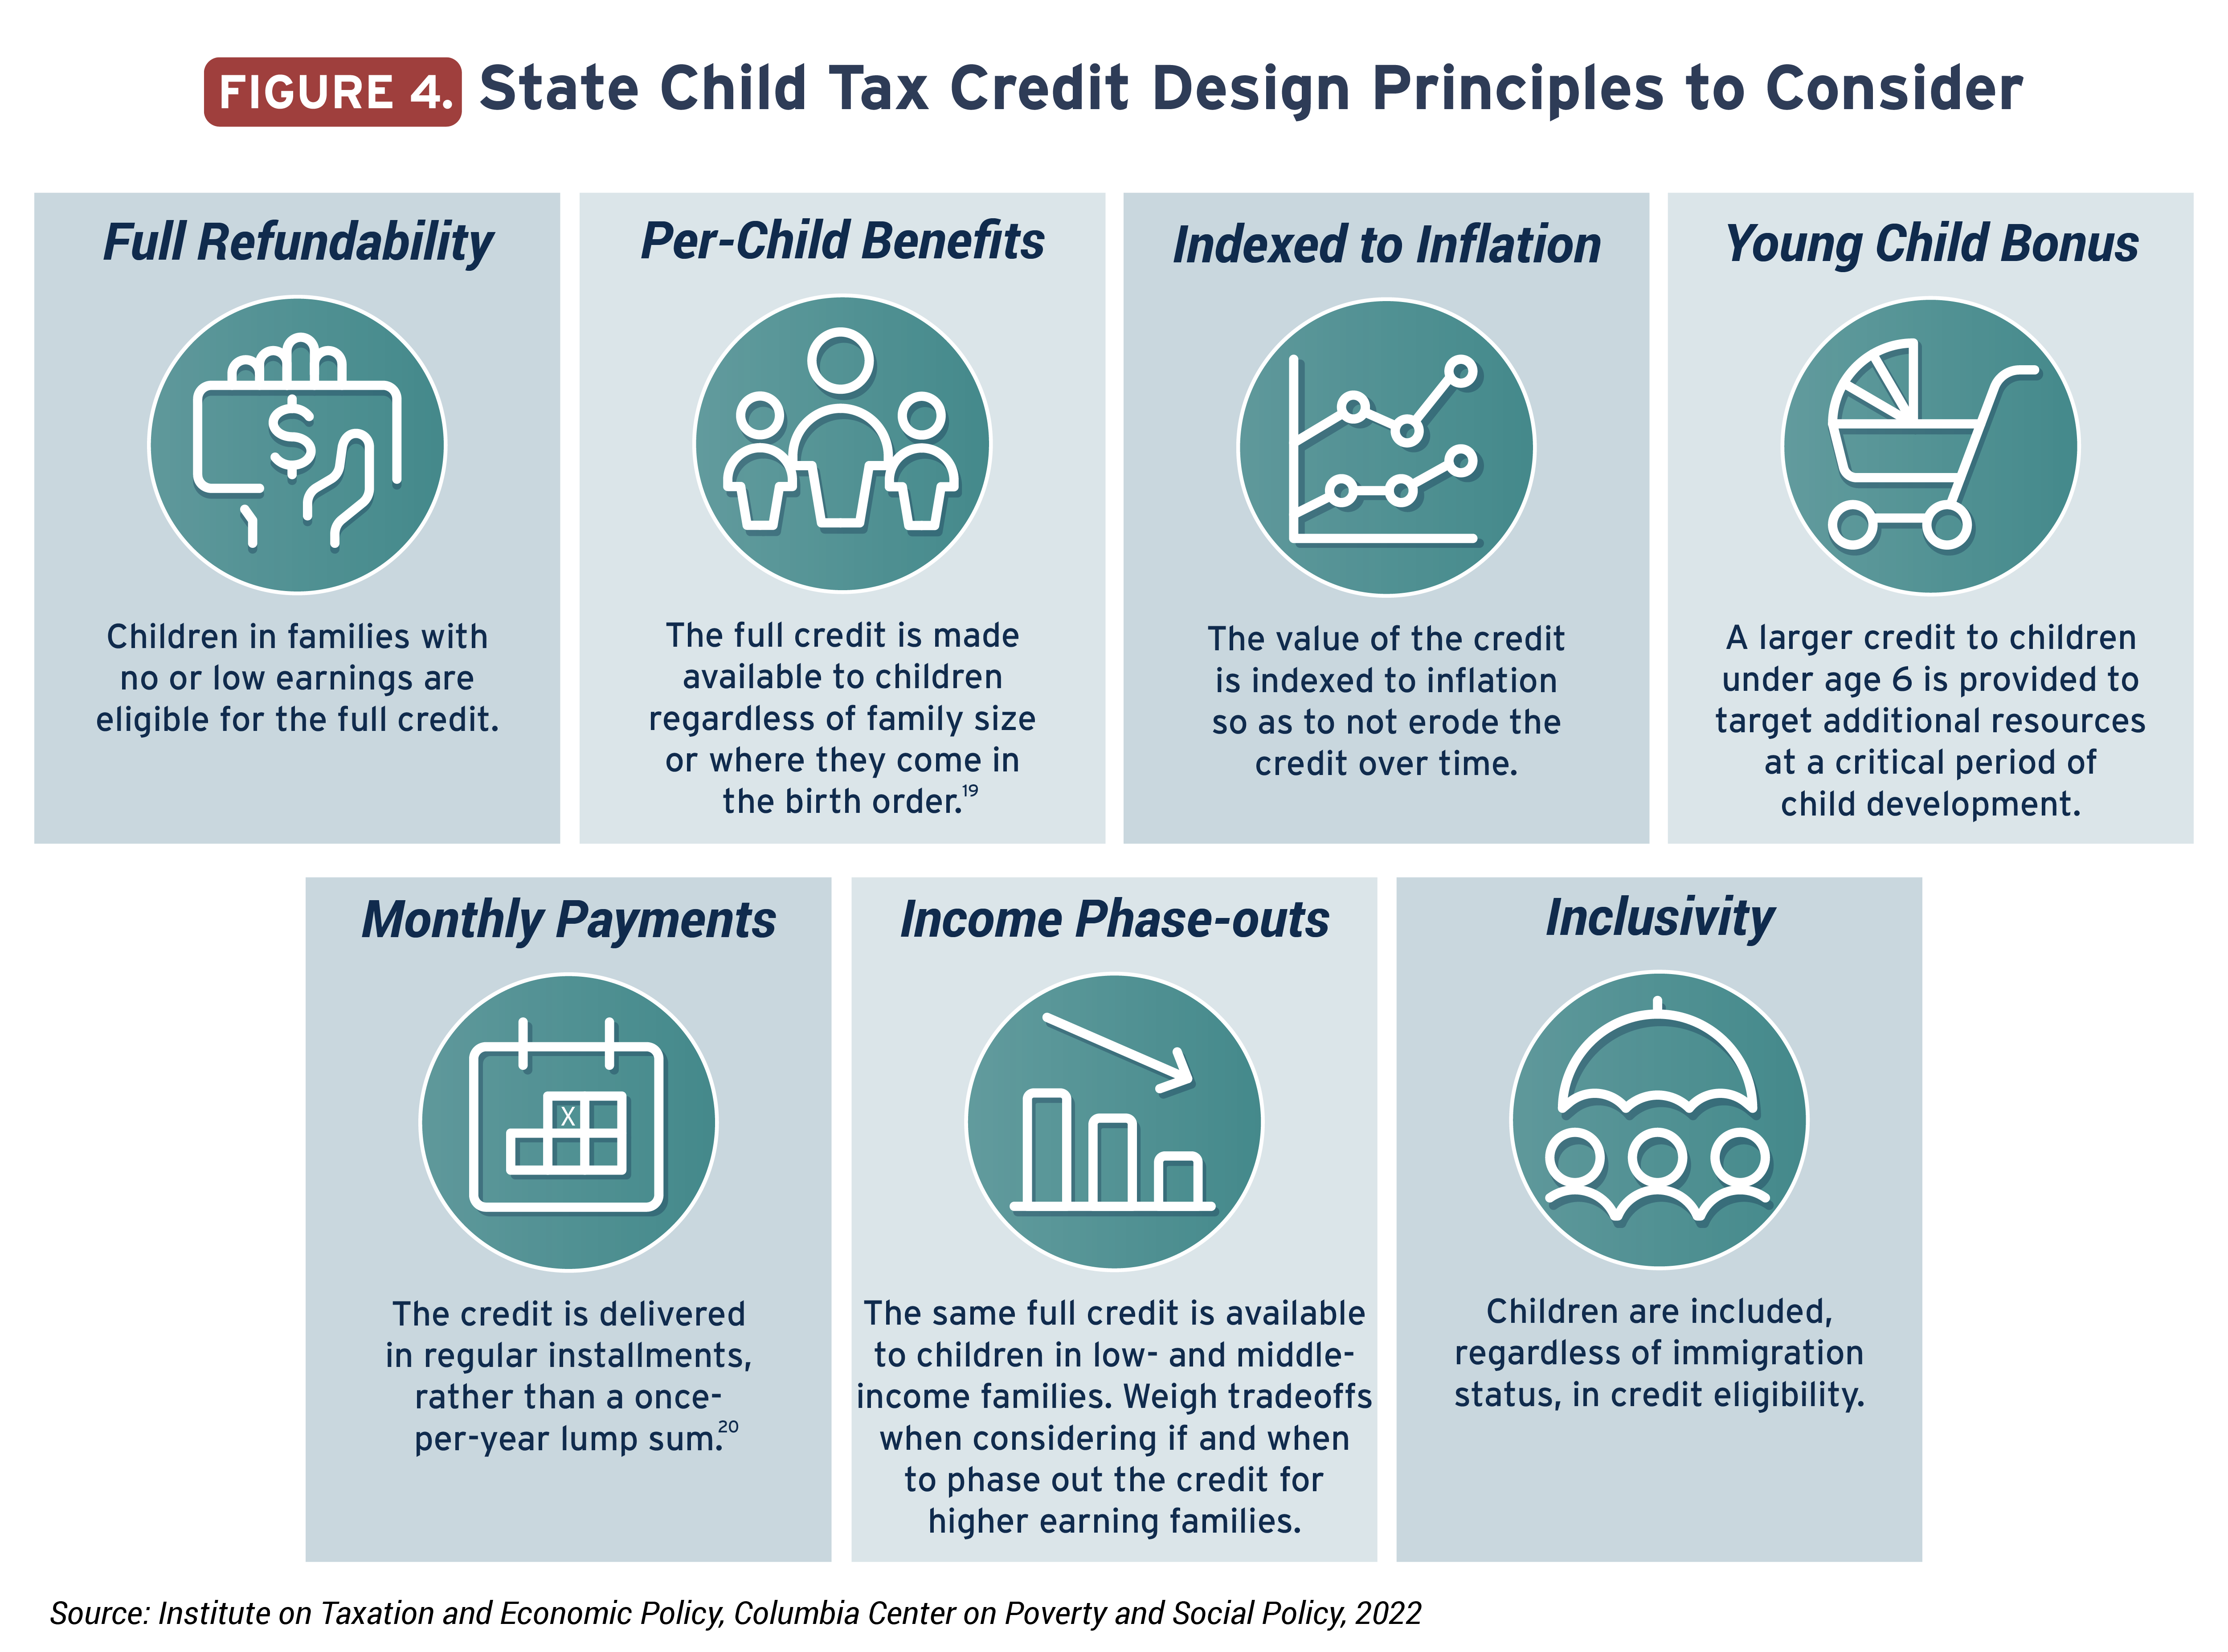
➜ To make a state Child Tax Credit most effective, lawmakers should consider a range of design principles, including making children in families with low or no earnings eligible for the full credit, tying benefits to the number of children in a family, adjusting the credit amount annually with inflation to ensure that it does not erode over time and providing the credit in monthly installments.
➜ In almost all states, a refundable state Child Tax Credit of $2,000 or less – with a 20 percent credit boost for young children under 6 – would achieve a 25 percent reduction (or more) in the child poverty rate. Most states would see a child poverty reduction of 25 percent with a base credit value between $1,200 and $1,800.
➜ To cut child poverty rates by half, the majority of states would require a base credit value of between $3,000 and $4,500 per child plus a 20 percent boost for young children. If the federal Child Tax Credit expansion is reinstated, the same goals could be achieved through smaller state credits.
➜ A twenty-five percent child poverty reduction in each state would collectively cost states 2.6 percent of total nationwide state and local revenue under the more universal Child Tax Credit. Under a more targeted approach, the overall cost to all states would be 1.7 percent of total state and local revenue.
➜ Fifty percent child poverty reduction in each state would collectively cost states 7.0 percent of total nationwide state and local revenue under a more universal Child Tax Credit option that extends higher up the income scale and is available to more middle-class families.
➜ Two thirds of states could halve child poverty by dedicating less than 5.5 percent of total state revenue under a more targeted approach that directs benefits primarily toward families experiencing low income. The amounts that states would need to invest to achieve sizeable cuts in child poverty, while significant, are within reach for states willing to commit the resources.
Introduction
In 2021, as part of the American Rescue Plan Act (ARPA), the United States established its first near-universal child benefit in the form of an expanded, monthly Child Tax Credit. The expansion cut child poverty dramatically,[1] with corresponding drops in material hardship among families with children.[2] Its success was due, in large part, to the design enhancements that increased its value, provided the full increased benefit to children in poverty for the first time and delivered the benefit in monthly payments for all recipients.[3] Policymakers who championed the policy – including members of Congress and President Biden – intended for it to become permanent. Despite efforts to continue the expansion past 2021, it lapsed and the federal Child Tax Credit has reverted to its pre-pandemic form, with the future of another, more permanent, expansion uncertain. The evidence is clear that a more permanent version of the expanded federal Child Tax Credit would be an effective anti-poverty policy moving forward.
States are well positioned to continue this successful effort, whether by complementing a future federal extension or making up for federal inaction. Tax policy is an area where states may innovate, and in many cases, supplement or remediate deficiencies in federal law. More than half of states (31 states, plus the District of Columbia and Puerto Rico), for example, have their own state Earned Income Tax Credits (EITCs) that families receive in addition to the federal EITC.[4] Historically, few states operated their own Child Tax Credits. And existing credits were limited in their reach – but that is beginning to change.[5]
States can build on the track record of the expanded federal credit and create Child Tax Credits that include features key to the federal expansion’s success: making children in families with low or no earnings eligible for the full credit and providing the option to advance the annual benefit in monthly payments for all.
Regardless of future Child Tax Credit developments at the federal level, state policies can supplement the federal credit to deliver additional benefits to children and families. State credits can be specifically tailored to meet the needs of local populations while also producing long-term benefits for society as a whole.[6] State Child Tax Credits can significantly reduce child poverty in all states while also addressing economic and racial inequities that are too often made worse by regressive state taxation.[7] Fully-refundable Child Tax Credits boost the after-tax incomes and economic security of families of all races and are particularly important for Black, Hispanic, Indigenous, and other people of color confronting the economic hardships created by systemic racism.[8]
This report outlines the potential impacts of state Child Tax Credits on poverty and the costs of these highly promising tax credits. The current (i.e., 2022) federal Child Tax Credit serves as the baseline for these analyses. The poverty and revenue estimates fully capture what it would take for a state to reduce child poverty by 25 and 50 percent through a state credit.[9]
It offers a set of design principles and policy options for states to consider when adopting or enhancing their own credits. It then identifies the state credit values that could achieve meaningful child poverty reduction in each state, with options to reduce state child poverty rates by 25 percent or 50 percent. The revenue impact associated with each Child Tax Credit option is then summarized, identifying the tradeoffs between robust benefits and the cost of these credits to state budgets.
This report presents a broad, more universal, option and a narrower, more targeted, option. The former extends higher up the income scale and is available to more middle-class families, whereas the latter is directed toward families experiencing periods of low income.
Individual state pages are available for all 50 states and the District of Columbia, identifying details of each credit option: the maximum benefit, overall cost, number of beneficiaries, number of children lifted out of poverty, the impacts of each policy across the income distribution and the anti-poverty effects associated with credits of varying amounts. States may wish to consider other poverty targets as well – and of course, in the event of a further federal expansion, the options presented in this report would lead to even larger reductions in child poverty.
The Federal Child Tax Credit and 2021 Expansion
Under current law, the federal Child Tax Credit is a partially refundable credit against income tax liabilities for families with children under age 17. Families with earnings up to $400,000 can receive a maximum tax credit of $2,000 per child. Families with incomes above this level either fall into the phase-out range and receive a partial credit or do not receive any credit at all. Just three percent of children are in families who do not receive the full Child Tax Credit because they earn too much. At the other end of the income spectrum, a much larger proportion of children are in families who do not receive the full Child Tax Credit because they earn too little.
As seen in Figure 1, the Child Tax Credit has a “trapezoid-like” structure that leaves many families with low incomes ineligible for the maximum credit. One out of three children is left out of the full credit – receiving a partial credit or none at all – because their families’ earnings are too low. One out of every two Black and Hispanic children is left out of the full credit due to this fact. Also disproportionately excluded are children in rural families, families with young children, larger families and families headed by single parents.[10] Simply put, since the credit is based on earnings, children whose parents earn less, get less.[11]
The temporary American Rescue Plan Act (ARPA) Child Tax Credit expansion in 2021 had three main elements. It:
➜ Increased the total value of the credit to $3,600 per child under the age of 6 and to $3,000 per child ages 6 through 17 for families with earnings up to $150,000;[12]
➜ Removed the requirement for earnings and eliminated the credit phase-in, which both made the credit “fully refundable” and broadened full eligibility to include the one-third of children previously ineligible for the full credit; and
➜ Advanced half of the annual credit in six monthly payments of up to $300 per young child and $250 per older child.
Payments arrived in the middle of each month, beginning in July of 2021, with the balance of the credit arriving at tax time in spring 2022. This expansion expired after tax year 2021 and the federal Child Tax Credit reverted to the smaller, annual policy that once again leaves behind the one-third of all children in families who earn too little to qualify for the full credit.
More States are Adopting and Expanding Child Tax Credits
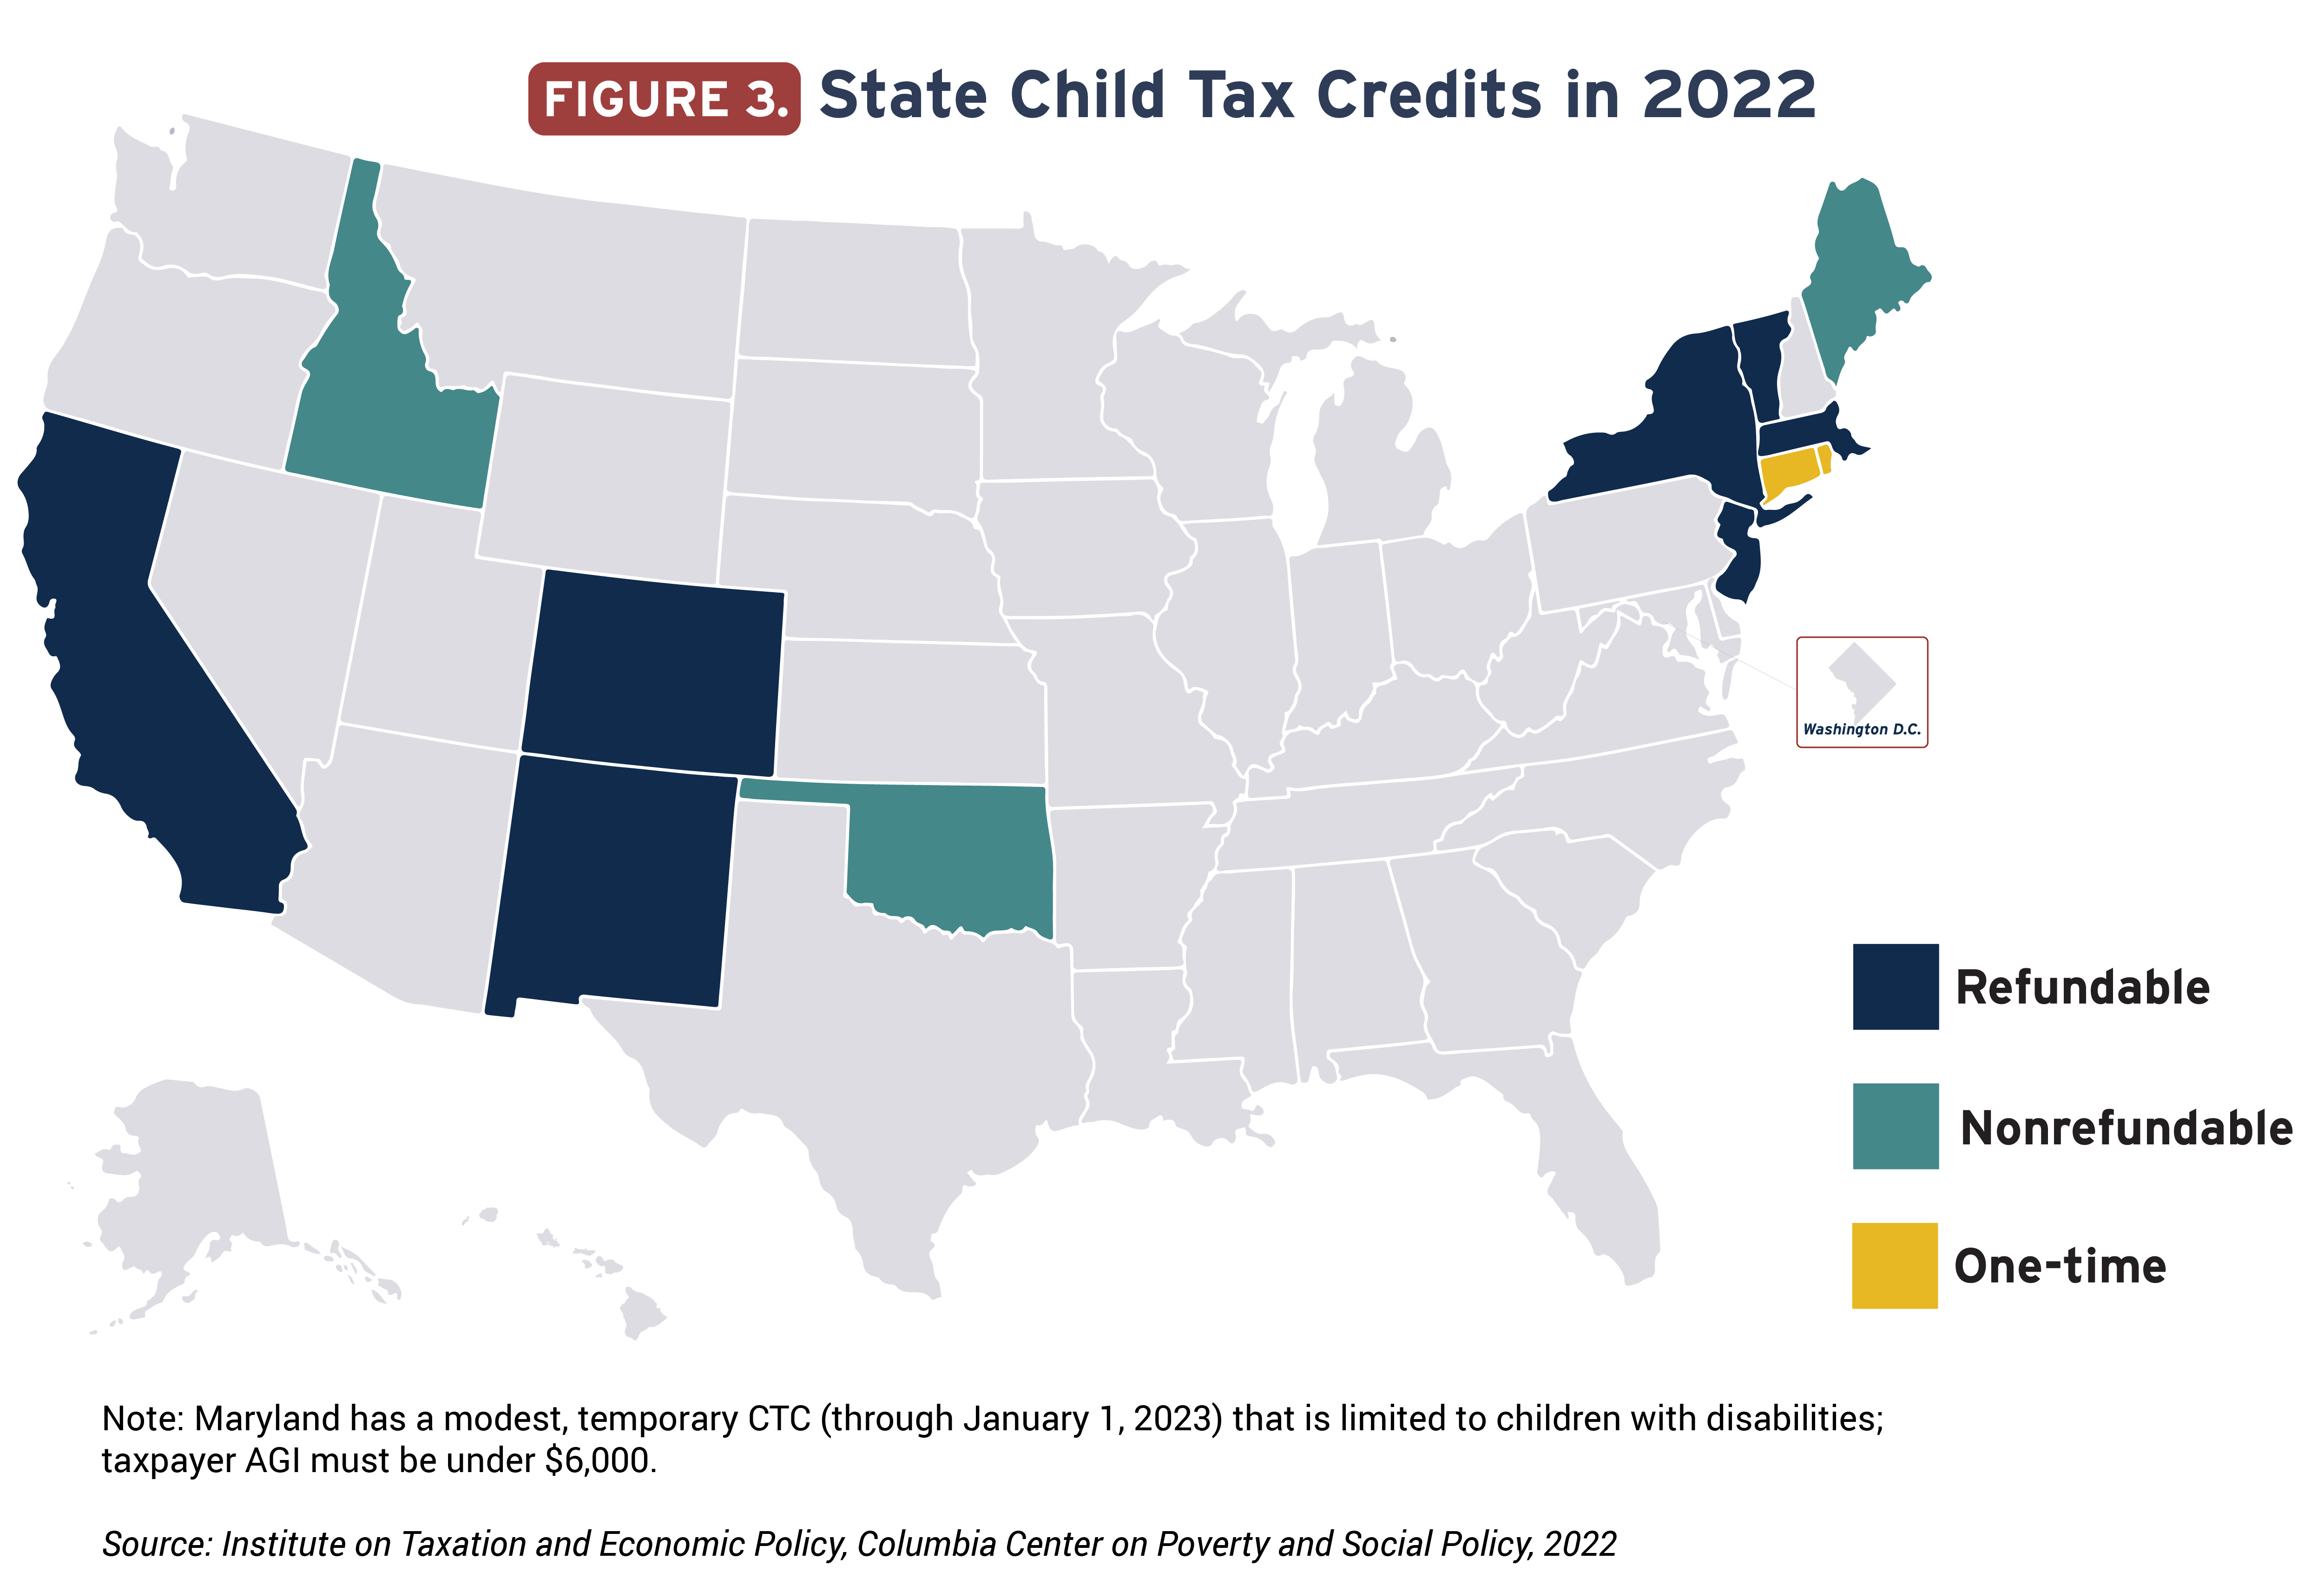
There is increasing momentum in the states toward adopting or expanding Child Tax Credits. Ten states currently have some form of a Child Tax Credit, and these credits represent ongoing, targeted and typically refundable investments that would boost families’ incomes.[13]
In 2019, California became the first state to pass a Child Tax Credit that included a full benefit for the families of children in deep poverty. Their Young Child Tax Credit provided a per-family benefit of $1,000 for families with children below the age of 6 and earnings below $25,000 – and phased out by $30,000. While there was no phase in, to get the $1,000 credit, families needed to have earnings, which could be as little as $1. California got rid of this earnings requirement – and also indexed its value to inflation – in its most recent reform to the policy, which was passed in July 2022.
In 2022, lawmakers in three states – New Mexico, New Jersey and Vermont – created new Child Tax Credits. Like California’s, New Jersey’s and Vermont’s new credits are permanent, while New Mexico’s is scheduled to expire in 2027.
Several other states enacted shorter-term policies targeted toward children in 2022. Lawmakers in Connecticut and Rhode Island provided one-time payments to children from low- and middle-income families and New York provided a one-year increase to the state’s Empire State Child Credit.
The breadth and scope of these credits vary.[14] For instance, the size ranges from a nonrefundable $100 per child credit in Oklahoma to a fully refundable $1,000 per child credit in Vermont. If a credit is refundable, taxpayers receive a refund for the portion of the credit that exceeds their income tax bill. If a credit is fully refundable, taxpayers are eligible for the full amount of the credit, regardless of their income tax liability. Refundable credits can therefore help offset all taxes paid, not just income taxes, helping mitigate some of the regressive effects of other state and local taxes. Nonrefundable credits are limited in their ability to reach families in or on the verge of poverty. They cannot be accessed by families with low or moderate incomes who may have little state income tax liability, but who pay substantial amounts of sales, excise and property taxes.[15]
Credit eligibility at the state level also varies by children’s age, with some states matching federal requirements (under age 17) and others providing the credit to a smaller subset of children, such as children under age 6. Most, but not all, state Child Tax Credits are inclusive of immigrant families who claim children with Individual Tax Identification Numbers (ITINs) rather than Social Security numbers, mirroring the inclusivity of the federal Child Tax Credit prior to restrictions enacted as part of the 2017 Tax Cuts and Jobs Act (TCJA).[16] State credits also vary in how high up the income ladder the benefit goes.
Despite variation, these state credits represent a meaningful first step in enhancing the economic security and general well-being of children across the country. State lawmakers can reduce child poverty in their states by enacting and enhancing state Child Tax Credits.[17]
Principles to Consider When Designing and Enhancing State Child Tax Credits
Policy design decisions impact state Child Tax Credit effectiveness. The following elements can improve poverty reduction.[18]
The details of policy design matter enormously in determining both the costs and anti- poverty impacts of these credits. From the standpoint of children’s rights, administrative efficiency and benefits to society, a universal Child Tax Credit would be ideal.[21] Indeed, one benefit of a universal Child Tax Credit is that it provides the same full benefit to children in lower-income families as those in higher-income families. However, tensions exist around state resources and how best to fund such universal benefits.
A less expensive option for states is to adjust the income level at which the credit begins to phase out – for example, deciding whether to include both low- and middle-income families in credit eligibility or focusing the credit specifically on families with low incomes. Setting a phase-out range at an income level lower than the existing federal Child Tax Credit (i.e., below $400,000 in income for joint filers) means that state lawmakers can focus tax benefits on families with fewer economic resources while maintaining the same poverty impacts and lowering the upfront budgetary cost.
States looking for a less expensive starting point could begin by limiting their state credits to children under age 6, where evidence shows the largest returns for children’s eventual outcomes.[22] In 2022, lawmakers in New Jersey and Vermont enacted Child Tax Credits that aim to benefit this young child population. States limiting their policies to younger children could consider phasing in older children in future years.
In this report, we present results under two phase-out options, also seen in Figure 5. In the next section, we look at state credit values that can achieve either a 25 percent or a 50 percent reduction in state child poverty; these credit values would achieve these targets with either of the two phase-out thresholds listed below:
➜ “More universal approach”: A benefit phase-out for joint filers after $110,000 of income and $75,000 for heads of household, mirroring the original federal Child Tax Credit income phase-out from 1997. This threshold remained in place until the temporary increase under the Tax Cuts and Jobs Act of 2017 (TCJA) that expanded eligibility for the full credit to families with up to $400,000 in income.
➜ “More targeted approach”: A benefit phase-out at a relatively low level of income: specifically, one that begins to phase out at the point where a family is no longer eligible for the federal EITC.[23] So, for instance, a two child, dual parent family with income above $55,529 is no longer eligible for a federal EITC, and it is at this point that the state-level credit could begin to phase out. A child in the same size family with income over this amount would be eligible for less. This results in a more targeted credit that would still provide a full state Child Tax Credit to children in the lowest-income households.[24]
In the state fact sheets accompanying the main report, we present state credit options under both the more universal and the more targeted approaches.
Ultimately, these income phase-outs do not affect poverty reduction, as families below the poverty line benefit under either design. The difference between these phase-out options lies primarily in their budgetary impact and the extent to which middle-income and more affluent families benefit.
Each of the proposed state Child Tax Credit options in this report provides the largest tax cut (as a percentage of income) to families at the bottom of the income scale, with the bulk of the benefit going to families in the bottom 80 percent in each state (for details visit the accompanying state pages). This effect would lessen existing inequities in state and local tax systems, which are by and large regressive.
In the absence of federal action, another approach for states to consider is designing state Child Tax Credits to make up for the shortcomings of the federal credit. Fortunately, states have myriad options to make improvements in the absence of federal policy change. Lawmakers could bring every qualifying child up to the full $2,000 credit or to a higher credit amount. Where the federal credit falls short, states could fill in the difference by eliminating the earnings requirement and eligibility phase-in that currently exists and making the credit fully refundable. Our 2019 report outlines these policy options in detail, highlighting the poverty impacts, costs and beneficiaries.[25]
State Child Tax Credit Policy Options
In this report we determine how the state child poverty rate would fall depending on the size of a potential state Child Tax Credit. Here, we use two targets – a 25 percent and a 50 percent reduction in the state child poverty rate – and determine the state Child Tax Credit levels that could achieve these reductions in each state.
In each case, we assume a state Child Tax Credit matches the ARPA expansion of the federal Child Tax Credit in three key ways.
➜ First, we assume the credit is fully refundable and available to children regardless of their family’s earnings.
➜ Second, we assume that the credit value is higher for children aged 0 to 5 because these years being particularly important to child development.[26] The expanded federal Child Tax Credit offered a credit that was 20 percent higher for younger children (under age 6) compared to older children ($3,600 per year vs. $3,000 per year); we follow this approach and the state credits we model are 20 percent higher for young children.
➜ Third, we assume state Child Tax Credits, like the expanded federal credit, would be delivered in advanced monthly payments. This can play an important role in keeping poverty lower throughout the year, especially when assessing monthly poverty rates,[27] but it does not affect our simulations here given that we are simulating the effects of state credits on annual poverty rates.
Unlike the federal Child Tax Credit, we assume that the benefit begins to phase out when a family (depending on size) is no longer EITC eligible (i.e., the “more targeted approach” discussed earlier). So, a child in a two-parent, two child family with income up to $55,529 in 2022 would be eligible for the full credit, which would then begin to phase out for families above this threshold. The phase-out rate would be the same as that set for the EITC (15.98% for families with 1 dependent and 21.06% for those with two or more dependents). That said, more children would benefit if the phase-out threshold were higher in the income distribution (i.e., if states took the more universal approach), but the anti-poverty effects would be the same.
The following figures depict the state Child Tax Credit benefit levels required to achieve both a 25 percent and a 50 percent reduction in child poverty rates by state, including maps that illustrate the degree to which the state level credits can vary across the country to achieve these results.
In more than half the country (34 states), a base state Child Tax Credit between $500 and $1,500 per child – with a 20 percent credit value add-on for young children – would reduce these state child poverty rates by 25 percent (Figure 6). A credit of $2,000 or less would reduce state child poverty rates fall by 25 percent or more in almost all states, with the exception of Alaska and Rhode Island (Figure 6). We find that the vast majority of states would see a child poverty reduction of 25 percent with a base credit of between $1,200 and $1,800.

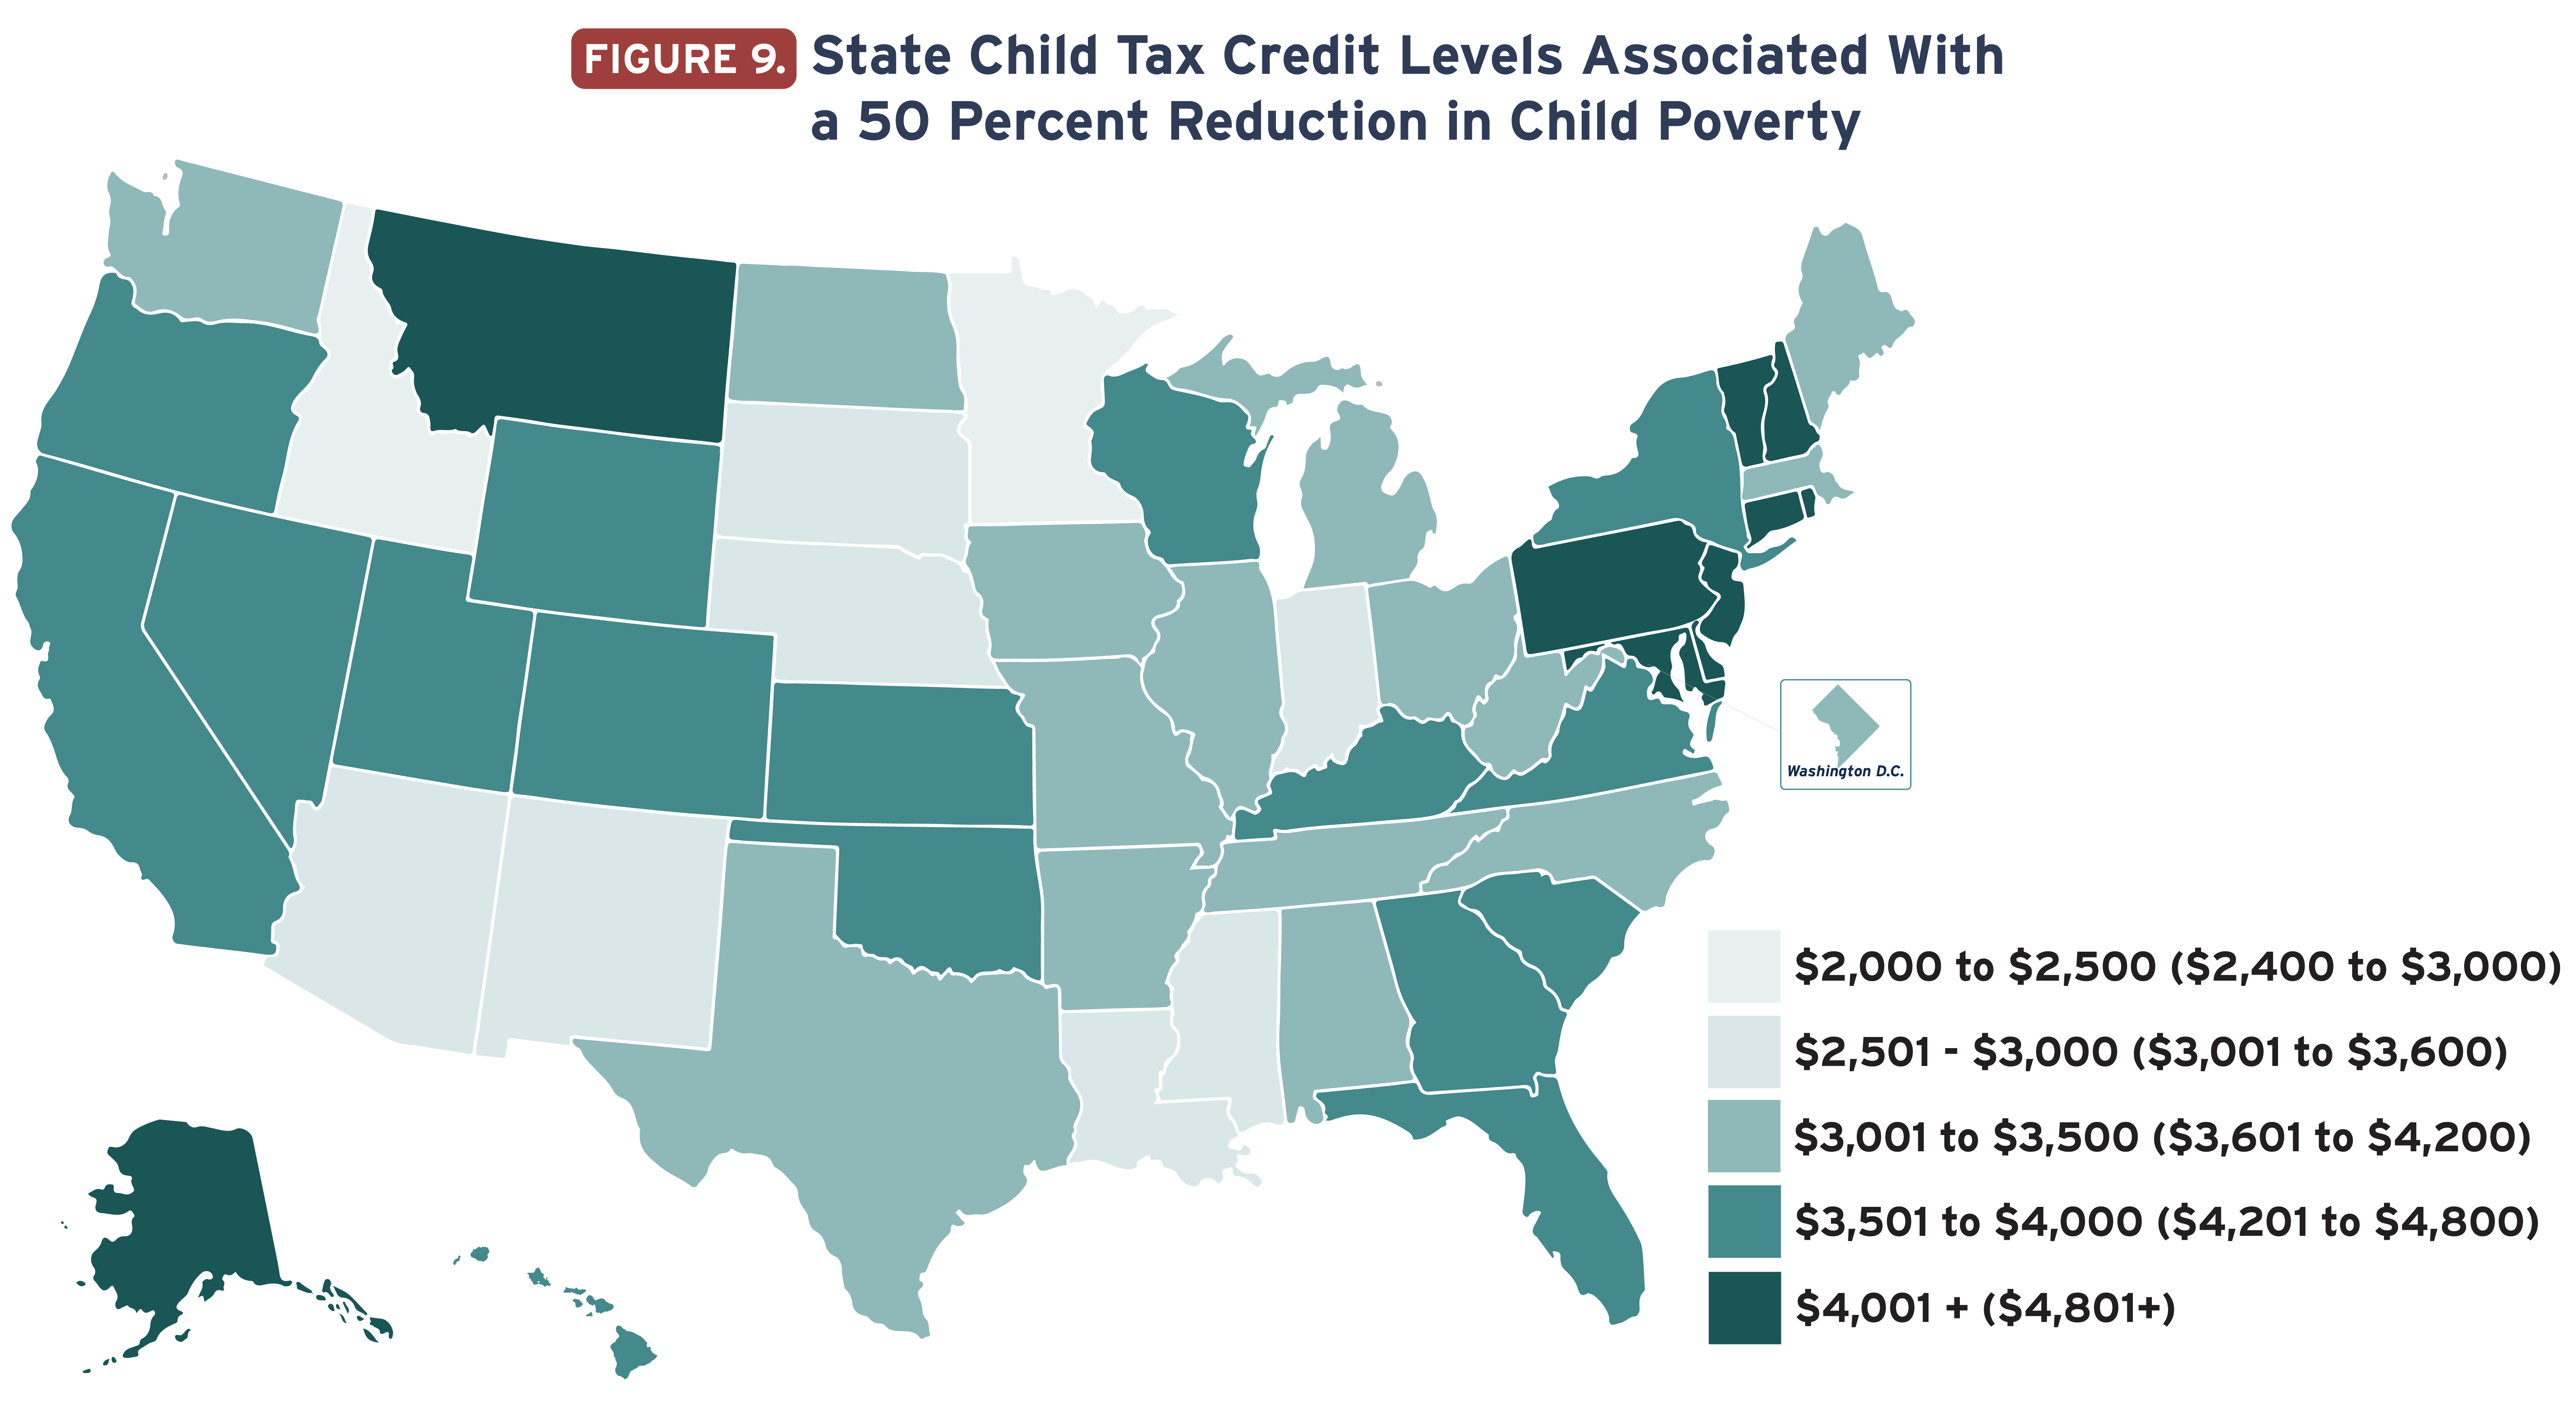
Cutting child poverty in half would, of course, require substantially higher credit levels. Figure 8 shows that seven states could reduce their child poverty rates by 50 percent with a base state Child Tax Credit of less than $3,000. The majority of states would require a base credit between $3,000 and $4,500 per child (again with a 20 percent benefit boost for young children) in order to cut their child poverty rate in half. The following section outlines the costs to states of adopting such a credit. States would need to make a considerable investment to hit this target without renewed federal support. Nevertheless, Figures 8 and 9 illustrate that meaningful reductions in child poverty are possible given sufficient resources and political will.
Unsurprisingly, cutting child poverty in half costs more than reducing it by 25%. The revenue impacts of Child Tax Credit options presented in this report vary widely between states, and if they choose the “more universal” or “more targeted” approach when setting a phase-out threshold for the credit. The more universal approach extends benefits to a broader population of children, including middle-income families, resulting in a larger overall benefit but a higher cost to states.
The more targeted approach is designed to more exclusively benefit families experiencing periods of low income. The result is a smaller number of children reached (particularly higher up the income scale) and a lower overall cost of the credit.
Under the more universal approach, the combined cost of achieving a 50 percent poverty reduction in each state is 7.0 percent of total nationwide state and local revenue.[28] Across states, the cost ranges from 3.5 percent of revenue in the District of Columbia to 12.7 percent of revenue in Alaska.
Under the more targeted approach, the combined cost of achieving a 50 percent poverty reduction in each state comes to 4.7 percent of total nationwide state and local revenue. Across states, the cost ranges from 2.3 percent of revenue in Minnesota to 8.8 percent in Georgia. While states would need to invest significantly to achieve a 50 percent poverty reduction, the amounts are within reach for states willing to consider robust revenue-raising measures. Notably, under the more targeted approach, two-thirds of states could halve child poverty with a Child Tax Credit that costs less than 5.5 percent of their total revenues
The combined cost of achieving a 25 percent poverty reduction across the states is roughly $82 billion per year with the more universal approach, and $54 billion per year with the more targeted approach. Under the more universal scenario, state credits could be enacted in all states to cut child poverty by 25 percent, at the cost of less than 5.8 percent of their total revenues. Under the more targeted approach, all states could achieve this goal using 3.6 percent of their total revenues, and two-thirds of states could do so with 2 percent or less of their total revenues.
These options to reduce child poverty by 25 percent and 50 percent are bold and come with a cost. They also come with sizable benefits: greater economic security for children and their families, lessened racial inequities and progress toward reversing “upside-down” state and local tax systems that ask more of low- and middle-income families than the wealthy. States can consider a range of options to fund credits that would meaningfully reduce child poverty. Specific revenue-raising options vary by state, but all states can invest in reducing child poverty if willing to commit the resources.
While the focus of this report is on providing options to the 50 states and the District of Columbia to expand Child Tax Credits, localities could also create credits of their own. We do not estimate the costs and impacts of more local (e.g., city or county) policies here, but the range of state estimates suggest that there are affordable options for localities that would boost the incomes of children and families and reduce poverty. Though not included in this analysis, Puerto Rico and other U.S. territories could also adopt their own Child Tax Credits in the absence of federal action.
This report provides new data on state options for developing or expanding state Child Tax Credits that can achieve ambitious child poverty reduction targets. The accompanying state pages highlight key takeaways for all 50 states and the District of Columbia.
Individual state pages identify details for each credit option: the maximum benefit, overall cost, number of beneficiaries, number of children lifted out of poverty, the impacts of each policy across the income distribution and the anti-poverty effects associated with credits of varying amounts. These are, of course, not the only options available to states, but this report provides a foundation for policymakers and other stakeholders to begin to understand how they can reduce economic disadvantage for children in their states.
Methodology
Determining the Poverty Impacts of State Child Tax Credits
Data for this simulation are pooled from 3 years of the Current Population Survey (2017 – 2019). To adjust for change in economic conditions, inflation, changes in the tax code, and benefit level between these years and 2022, we adjust this underlying data using the method outlined in Collyer et al. (2022).[29] We ran a microsimulation for each state in the data and the District of Columbia that determined the poverty reduction (measured using the Supplemental Poverty Measure) associated with different credit levels in those states (ranging from $100 per child to $7,000 per child, with an added value of 20% for young children under age 6). Poverty reductions were determined by adding the new credit to family resources and the re-calculating the poverty rate. We then reviewed the estimated reduction in poverty associated with credit values across these ranges and identified the credit amounts that would reduce the state child poverty rate by 25% and 50%. Note that in the case of states that already have a state Child Tax Credit, we assume that that the existing credit would be absorbed into the credit that we model. This means that the credit levels that we show are not on top of existing credits, but in place of those credits.
Determining Estimated Costs, Average Benefit, and Number of Beneficiaries
The cost estimates and beneficiary information contained in this report are based on data from the ITEP Microsimulation Tax Model. The ITEP Model is based on a large database of tax return information created by the Internal Revenue Service (IRS) and is supplemented with data from the U.S. Census, Commerce Department, Congressional Budget Office, and numerous other sources. The result is a representative profile of the nation’s population, and of each state, against which both current tax laws and potential changes to those tax laws can be computed by running ITEP’s tax calculator on each observation contained inside the Model. Additional discussion of the model is available at: https://itep.org/itep-tax-model.
Appendix
Download the State-by-State Pages
Acknowledgements
This study was developed on behalf of Share Our Strength with additional support from the Annie E. Casey Foundation, the Charles and Lynn Schusterman Foundation, the Economic Security Project, The JPB Foundation, the W.K. Kellogg Foundation and the Rockefeller Foundation.
A special thanks to ITEP colleagues Neva Butkus, Alex Welch and Jon Whiten, and Columbia colleague Sonia Huq for their research, design and communications support.
Endnotes
[1] Burns, K., Fox, L., & D. Wilson (2022) Expansions to Child Tax Credit Contributed to 46% Decline in Child Poverty Since 2020. Washington DC: US Census Bureau. www.census.gov/library/stories/2022/09/record-drop-in-child-poverty.html. Accessed October 2022.
[2] (Perez-Lopez 2021; RAPID-EC 2021; Parolin et al 2021; Shafer et al 2022)
Perez-Lopez, D.J. (2021) Economic Hardship Declined in Households with Children as Child Tax Credit Payments Arrived: Household Pulse Survey Collected Responses Just Before and Just After the Arrival of the First CTC Checks. Washington DC: US Census Bureau. www.census.gov/library/stories/2021/08/economic-hardship-declined-in-households-with-children-as-child-tax-credit-payments-arrived.html
RAPID-EC (2021) Parents’ Expectations About the Child Tax Credit (December). The Child Tax Credit is Buffering Families From Financial Hardship. University of Oregon. www.uorapidresponse.com/our-research/child-tax-credit-is-buffering-families-from-hardship
Parolin, Z., E. Ananat, S. Collyer, M. Curran, & C. Wimer (2021) The Initial Effects of the Expanded Child Tax Credit on Material Hardship. NBER Working Paper 29285. Cambridge: National Bureau of Economic Research. doi: 10.3386/w29285 www.nber.org/papers/w29285. Accessed December 2021.
Shafer, P.R., K.M. Gutierrez, S. Ettinger de Cuba, A. Bovell-Ammon, & J. Raifman (2022) Association of the Implementation of Child Tax Credit Advance Payments With Food Insufficiency in US Households. JAMA Netw Open, 5(1):e2143296. doi:10.1001/jamanetworkopen.2021.43296.
[3] Collyer, S. et al., Earning Requirements, Benefit Values, and Child Poverty under the Child Tax Credit: Eliminating the Earnings Requirement does more to Impact Child Poverty than Increasing Benefit Levels.
For a discussion of the impacts of making the credit fully refundable, see: Wimer, et al., Left Behind No Longer? The Expanded Child Tax Credit and Child Poverty in 2021 and Collyer, S. et al., Earning Requirements, Benefit Values, and Child Poverty under the Child Tax Credit: Eliminating the Earnings Requirement does more to Impact Child Poverty than Increasing Benefit Levels
For a discussion of the added benefits associated with monthly delivery, see: Hamilton, C. et al., Monthly Cash Payments Reduce Spells of Poverty Across the Year
[4] Davis, Aidan. “Boosting Incomes and Improving Tax Equity with State Earned Income Tax Credits in 2022.” Institute on Taxation and Economic Policy. September 2022. https://itep.org/boosting-incomes-and-improving-tax-equity-with-state-earned-income-tax-credits-2022/
[5] Davis, Aidan. “More States are Boosting Economic Security with Child Tax Credits in 2022.” Institute on Taxation and Economic Policy. September 2022. https://itep.org/more-states-are-boosting-economic-security-with-child-tax-credits-2022/
[6] Garfinkel, I., Sariscsany, L., Ananat, E., Collyer, S., Hartley, R. P., Wang, B., & Wimer, C. (2022) The Benefits and Costs of a Child Allowance. Journal of Benefit-Cost Analysis, 1-28.
[7] The vast majority of state and local tax systems are inequitable and “upside-down,” taking a much greater share of income from low- and middle-income families than from
wealthy families. And most state and local tax systems worsen income inequality by making incomes more unequal after collecting state and local taxes. A refundable Child Tax Credit is one tool that state and local governments have at their disposal to help narrow this gap.
Wiehe, Meg, Aidan Davis, Carl Davis, Matt Gardner, Lisa Christensen Gee, and Dylan Grundman. “Who Pays?: A Distributional Analysis of the Tax Systems in All 50 States, Sixth Edition.” The Institute on Taxation and Economic Policy. October 2018. https://itep.org/whopays
[8] Davis, Carl, Marco Guzman, and Jessica Schieder. “State Income Taxes and Racial Equity: Narrowing Racial Income and Wealth Gaps with State Personal Income Taxes.” Institute on Taxation and Economic Policy. October 4, 2021. https://itep.org/state-income-taxes-and-racial-equity/
[9] Note that states that already have a state Child Tax Credit, we assume that that the existing credit would be absorbed into the credit that we model. As a result, the credit levels provided in this report are not on top of existing credits, but in place of those credits.
[10] Collyer, Sophie, Christopher Wimer, and David Harris. “Left Behind: The One-Third of Children in Families Who Earn Too Little to Get the Full Child Tax Credit.” Poverty and Social Policy Brief. Center on Poverty and Social Policy, Columbia University. Vol. 3, no. 6. May 13, 2019. https://www.povertycenter.columbia.edu/news-internal/leftoutofctc
Curran, M. & S. Collyer (2020) Left Behind in Larger Families: The Uneven Receipt of the Federal Child Tax Credit by Children’s Family Size. Poverty & Social Policy Brief 4(4). New York: Center on Poverty and Social Policy at Columbia University. www.povertycenter.columbia.edu/s/Child-Tax-Credit-Larger-Families-CPSP-2020.pdf
Goldin, J. & K. Michelmore (2020) Who Benefits from the Child Tax Credit? NBER Working Paper 27940. doi:10.3386/w27940
[11] In addition to leaving behind children in many families because of low or no earnings, the credit’s value increases (or “phases in”) as earnings rise, giving progressively more to families that earn more, up to the maximum credit. And while some families with lower incomes receive partial credits through a refund, this value is lower at its maximum than more affluent families receive in the credit’s non-refundable form. Lastly, many immigrant children are ineligible because of documentation status.
[12] ARPA made 17-year-old children eligible for the Child Tax Credit for the first time.
Also, the federal Child Tax Credit has different phaseout thresholds for families headed by single parents and those headed by dual parents. Such a structure creates what some have called a “single parent penalty” by providing a smaller benefit or no benefit at all to a family with only one parent. At the same time, without different phaseout rates for single and dual parent families, there is the risk that a state could impose a “marriage penalty” on a single parent who chooses to marry, thus possibly increasing the family’s income, and pushing them out of eligibility. These tradeoffs deserve careful consideration. However, they will not directly impact the poverty reduction impact of the policy if the phaseouts are set to begin above the poverty line.
[13] Davis, Aidan. “More States are Boosting Economic Security with Child Tax Credits in 2022.” Institute on Taxation and Economic Policy. September 2022. https://itep.org/more-states-are-boosting-economic-security-with-child-tax-credits-2022/
[14] Some state CTCs were designed to replace dependent exemptions rather than offer genuinely new support to families with children. For instance, Idaho and Maine replaced dependent exemptions with nonrefundable credits. Massachusetts replaced a dependent deduction with a refundable credit (an enhancement), and Colorado and Connecticut do not offer dependent exemptions.
[15] Wiehe, Meg, Aidan Davis, Carl Davis, Matt Gardner, Lisa Christensen Gee, and Dylan Grundman. “Who Pays?: A Distributional Analysis of the Tax Systems in All 50 States, Sixth Edition.” The Institute on Taxation and Economic Policy. October 2018. https://itep.org/whopays
[16] The federal Child Tax Credit includes ITIN filers but benefits remain unavailable to otherwise qualifying children who do not have Social Security Numbers. Prior to TCJA, a Social Security Number was not required. This policy shift leaves children who are undocumented ineligible for the Child Tax Credit, regardless of their tenure in the United States.
[17] States have also issued one-time payments under a variety of names including stimulus checks, economic impact payments, and rebates. While achieving meaningful child poverty reduction year after year would require enacting permanent credits, states can take steps to temporarily maximize child poverty reduction and child benefits. Similar design principles should be considered when creating new one-time payments, including “per capita” designs that include the same per person benefit for both children and adults alongside full refundability.
[18] For more, see: Collyer, Sophie, Christopher Wimer, and David Harris. “Earnings Requirements, Benefit Values, and Child Poverty under the Child Tax Credit: Eliminating the earnings requirement does more to impact child poverty than increasing benefit levels.” Poverty and Social Policy Brief. Center on Poverty and Social Policy, Columbia University. Vol. 3, no. 3. March 5, 2018. https://www.povertycenter.columbia.edu/publication/2019/child-tax-credit-earnings-requirement
Curran, M. & S. Collyer (2020) Left Behind in Larger Families: The Uneven Receipt of the Federal Child Tax Credit by Children’s Family Size. Poverty & Social Policy Brief 4(4). New York: Center on Poverty and Social Policy at Columbia University. www.povertycenter.columbia.edu/s/Child-Tax-Credit-Larger-Families-CPSP-2020.pdf
Collyer, Sophie, Christopher Wimer, and David Harris. “Keeping Up with Inflation: How policy indexation can enhance poverty reduction.” Report for Century Foundation. August 25, 2022. https://tcf.org/content/report/keeping-up-with-inflation-how-policy-indexation-can-enhance-poverty-reduction/
[19] For more, see: Curran, M. & S. Collyer (2020) Left Behind in Larger Families: The Uneven Receipt of the Federal Child Tax Credit by Children's Family Size. Poverty & Social Policy Brief 4(4). New York: Center on Poverty and Social Policy at Columbia University. www.povertycenter.columbia.edu/s/Child-Tax-Credit-Larger-Families-CPSP-2020.pdf
Curran, M. (2021) The Efficacy of Cash Supports for Children by Race and Family Size: Understanding Disparities and Opportunities for Equity. Race and Social Problems, 13:34-48.
[20] Garfinkel, I., Sariscsany, L., Ananat, E., Collyer, S., Hartley, R. P., Wang, B., & Wimer, C. (2022) The Benefits and Costs of a Child Allowance. Journal of Benefit-Cost Analysis, 1-28.
[21] With monthly payments, policymakers should not count Child Tax Credits as taxable income to ensure that the CTC does not compromise eligibility for the Supplemental Nutrition Assistance Program (SNAP) and other benefits.
[22] States could even consider beginning with credits for infants, sometimes referred to as “birth grants,” to target the benefits to children at the most critical period of development while decreasing infant poverty (Hamilton, Collyer, Garfinkel, Harris, Kimberlin, and Wimer, forthcoming).
[23] For the latest information on EITC income eligibility thresholds, see www.irs.gov/credits-deductions/individuals/earned-income-tax-credit/earned-income-and-earned-income-tax-credit-eitc-tables.
[24] It would also ensure that the lowest-income families are not facing even higher marginal tax rates, which could occur if their EITC and state credits were phasing out simultaneously.
[25] Wimer, Chris, Sophie Collyer, David Harris, Aidan Davis, and Meg Wiehe. “The Case for Extending State Level Child Tax Credits to Those Left Out: A 50-State Analysis.” Institute for Taxation and Economic Policy and the Center for Poverty and Social Policy, Columbia University. April, 2019. https://itep.org/the-case-for-extending- state-level-child-tax-credits-to-those-left-out-a-50-state-analysis/
[26] Duncan, G.J., Morris, P.A., Rodrigues, C. (2011) Does Money Really Matter? Estimating Impacts of Family Income on Young Children’s Achievement With Data From Random-Assignment Experiments. Dev Psychol. 47(5):1263-1279. Doi: 10.1037/a0023875
[27] Hamilton, C., C. Wimer, S. Collyer, L. Sariscsany (2022) Monthly Cash Payments Reduce Spells of Poverty Across the Year. Poverty & Social Policy Brief, Vol. 6, No. 5. Columbia University: Center on Poverty and Social Policy. www.povertycenter.columbia.edu/s/Monthly-Cash-Payments-Reduce-Spells-of-Poverty-CPSP-2022.pdf
[28] This is measured relative to our estimate of general, own-source revenue.
[29] For additional details, see: https://tcf.org/content/report/keeping-up-with-inflation-how-policy-indexation-can-enhance-poverty-reduction/