Taxes and Racial Equity: An Overview of State and Local Policy Impacts
report

Executive Summary
Historic and current injustices, both in public policy and in broader society, have resulted in vast disparities in income and wealth across race and ethnicity. Employment discrimination has denied good job opportunities to people of color. An uneven system of public education funding advantages wealthier white people and produces unequal educational outcomes. Racist policies such as redlining and discrimination in lending practices have denied countless Black families the opportunity to become homeowners or business owners, creating extraordinary differences in intergenerational wealth. These inequities have long-lasting effects that compound over time.
State and local tax policies interact with this severe inequality in important ways. Revenues raised through taxes are vital to funding public investments in education, health, and the safety net, all of which can help combat inequality. But some state tax systems exacerbate racial income inequality by taxing low-income people, a disproportionate share of whom are people of color, at higher rates than other families. Such regressive tax structures can make racial income inequality worse as incomes become more unequal after state and local taxes. A progressive system for raising revenue, however, can narrow racial income gaps by asking more of families with the highest incomes, who are predominately white. When state policymakers leave immense racial and ethnic income inequality unaddressed in state tax codes, they solidify that inequality.
It is difficult for policymakers and the public to fully understand the impact of tax laws across race and ethnicity in part because tax return data do not include information on taxpayers’ races. To fill this void, we have merged tax and survey data within our microsimulation tax model to allow for race and ethnicity-specific tax estimates. We use this new capacity in this report to illuminate how state and local tax policies have differential impacts across race.
Consumption taxes, most notably general sales taxes, are the most regressive type of taxes relied on by state and local governments and the most significant drivers of racial inequity in state and local tax codes. Low- and middle-income families pay a larger share of their incomes in consumption taxes than the rich. While most low-income taxpayers are white because they remain a majority of the U.S. population, a disproportionate share of Black, Hispanic, Indigenous and other households of color are in lower-income groups due to the legacy of racist public policies and ongoing discrimination. So, policies that disadvantage low-income individuals and families—like heavy reliance on sales and excise taxes—have a disproportionately negative effect on people of color. Wealthier white families, who enjoy systemic advantages that have positioned them to save and build their wealth, tend to pay lower sales and excise tax rates since the portion of income set aside into savings is only taxed after a lengthy delay, if at all.
Income taxes can help to address income inequality by asking more of families with higher incomes, thus narrowing post-tax income gaps between high and low-income taxpayers. Flat-rate income taxes, or those littered with carveouts for investors or other high-income families, have limited potential to reduce yawning racial income gaps. Robust, progressive personal income taxes—which include meaningfully graduated tax rates, broad bases, and significant refundable low-income tax credits—are more effective at narrowing the racial income gap. Income taxes are, of course, just one part of a much larger package of policies needed to address inequality as evidenced by the fact that states with robust income taxes continue to experience severe racial income inequality even after those taxes are applied.
The effect of real estate property taxes across race and ethnicity is nuanced and complex. Vast differences in intergenerational wealth and a long history of racist housing policy have allowed white households to achieve homeownership rates far beyond those in communities of color. Those forces, together with white homebuyers’ aversion to living in areas with large nonwhite populations, have also led to significantly higher market values for white-owned homes relative to those owned by people of color. These factors can lead to higher property tax payments and, as a result, better-funded schools in majority white areas. But renters, a disproportionate share of whom are people of color, also pay the property tax indirectly through their rent payments. Compounding the challenges in property tax payments, housing segregation and assessment discrimination can result in higher tax bills for people of color relative to what white homeowners in similarly valued homes pay.
The overall tax level also has important consequences for racial equity, as states need robust revenues to fund deep investments in services and institutions that can advance racial and economic equity. Adequate funding for education, health, childcare, affordable housing, and other priorities is essential for moving toward broadly shared prosperity. A regressive tax code that asks the least of high-income families will struggle to raise adequate revenues during times when affluent, predominately white families, are enjoying an outsized share of all new income growth.
One way this report illustrates the disparate impact of various tax policies is by comparing and contrasting taxes in Tennessee and Minnesota, two states with dramatically different tax codes. Tennessee does not levy a personal income tax, relies very heavily on sales taxes to fund public services and institutions, and does not offer any refundable credits to low-income families. As a result of these policy choices, Tennessee’s tax code is worsening racial income gaps. Hispanic and Black families are taxed at higher average rates than higher-income white residents. Relative to the statewide average, Black families tend to pay an additional 1 percent of their income in Tennessee state and local taxes while Hispanic families pay an additional 0.9 percent.
Minnesota, by contrast, levies a robust personal income tax with refundable credits for low-income families and higher rates for top earners, thereby allowing the state to rely less heavily on regressive sales taxes. Minnesota appropriately taxes lower-income groups at rates slightly below the statewide average. Black families, for instance, pay a rate 0.4 percentage points below average while Indigenous families pay an average rate 0.5 percent below average, and Hispanic families’ average rate is 0.7 percent below average. White families, by contrast, pay slightly more on average because they have higher average incomes. Overall, by tending to tax people of color at slightly lower rates than white families with higher incomes, Minnesota’s tax system slightly mitigates racial income inequality. Of course, high-income households of color pay taxes above the state average and poor white families pay tax rates below the state average. And to be clear, racial income inequality remains intact post tax in Minnesota.
Different tax types have varying impacts on the racial income divide, which has significant implications for reformers seeking to overhaul their tax codes. Centuries of policy advantage and privilege have led to a significant overconcentration of white families among the nation’s top earners. Because of this, tax policies designed to benefit high-income or high-wealth taxpayers—like cutting top income tax rates, affording preferential tax treatment to investors, neglecting to levy estate taxes and other forms of wealth taxation, and funding government mainly through regressive consumption taxes—primarily benefit an affluent group of families that is overwhelmingly white. Similarly, increasing sales and excise taxes to buy down income tax or property tax rates, as many states have done in recent years, tends to redistribute income away from moderate-income families of all races and mostly toward wealthier white families instead.
Raising income taxes to lessen reliance on regressive sales and excise taxes can help state tax systems move toward easing the racial income divide, or at least not worsening it. Taxing the rich at higher rates is arguably the most important thing state and local governments can do to improve racial equity in their tax codes both because of the direct effect of the tax on narrowing income divides and because of the public investments made possible by the revenue that such a reform can raise. Higher taxes on top earners, a group that is disproportionately white, allow states to use their tax codes to reduce racial inequity.
Socioeconomic disparities by race and ethnicity extend beyond current income levels, and it is important to account for those differences when assessing the impact of taxes on racial equity. Years of racism and discrimination across all segments of society—the housing market, labor market, financial industry, education systems, criminal justice, and other areas—have prevented people of color from building wealth on the same level as white families. Policies that advantage wealth, such as tax subsidies for investment or business income, therefore disproportionately favor white households even if income is held constant. Similarly, Black and Hispanic households are much less likely than white households of the same income level to own their homes, and this tilts certain tax policies such as the mortgage interest deduction, property tax deduction, exclusion of gains on home sales, and other homeowner-only tax breaks heavily in favor of white households.
Policymakers can generate more economic and racial equity with better decisions about state and local taxes. By enacting progressive income taxes with more brackets at the top, restoring estate or inheritance taxes, taxing earnings from wealth at least as much as earnings from work, and taxing wealth itself, policymakers can meaningfully address economic and racial inequality and create a more equitable nation.
Introduction
Nearly all state tax codes are upside-down. They collect a larger share of income in taxes from those with the lowest incomes than from those with the highest. While revenues raised through taxes are vital to funding public investments in education, health, and the safety net that help to combat income inequality, ITEP’s Who Pays? report shows that the lopsided way in which those taxes are collected deepens the yawning income gap between high-income households and low-income households in 45 states.[1] Over-reliance on consumption taxes like sales and excise taxes are hallmarks of the most regressive state tax codes, or tax codes that require a greater share from low-income households than from high-income households. State and local tax systems are demanding the most from those with the least resources while asking comparatively little of those who already have the most. Yet policy offers tools that could instead reduce inequality. Some states are starting to pioneer a better approach, offering powerful lessons for advocates and leaders.
As quantitative tax policy research advances, it is important to expand the scope of work to include analysis by race when data allow. Policymakers, advocates, and community members will be better equipped to advance more racially equitable tax policy when analysts provide stronger racial analysis. This paper adds to the literature on taxes and race by presenting analyses, based on a merging of tax and survey data, of state and local effective tax rates by race and ethnicity in two states with very different tax codes. We use this new capacity in this report to illuminate how state and local tax policy choices can have differential impacts across race.
Those disparate impacts across race are often an intentional policy choice, such as under an 1875 property tax cap in Alabama designed to protect former enslavers after emancipation.[2] The cap remains in place to this day. In other instances, the bias may be less obvious but equally destructive. Disaggregation of tax data by race can expose both types of discrimination.
State and local tax codes are not the sole contributors to, nor will they be the sole solution to, racial economic inequities. This report helps to shine light on aspects of state and local tax structures that widen racial income and wealth gaps and presents solutions that can instead narrow those gaps. Improving racial economic disparities will not only help people in affected communities but will also allow society as a whole to benefit from the shared prosperity that occurs when communities invest in all people’s potential.
A note on the terminology used in this reportIn discussing race and ethnicity, it is necessary to apply labels to groups but also important to acknowledge that those labels can be limiting, imprecise, or even rejected by many of the people they are meant to describe. For instance, we use the term Hispanic in this report to describe people tracing their roots to Latin America and Spain because it is currently the most widely accepted term among the group it describes. But we acknowledge that this label is Eurocentric and many members of this group would prefer to be called Latino or Latinx (a gender-neutral alternative to Latino). Similarly, we use the term Black to refer to people who describe themselves as Black or African American. In public opinion polling of Black individuals, these two terms are roughly equally preferred, with a significant majority of Black people stating that the two terms are equally acceptable. This report generally refers to people of Native American descent as Indigenous peoples. We use the term “American Indian” in our table labels and methodology documents as it seems to have reasonably wide acceptance among the population it describes, it is the term used in the Census surveys on which we relied in building our model databases, and it is found frequently in statute. Throughout this report, the term “white” is generally meant to refer only to non-Hispanic white people. The phrase “people of color” is an inexact term used to describe people who have been marginalized because of their race or ethnicity. In the context of this report, it is typically meant to refer to groups facing discrimination that has resulted in below-average incomes or wealth such as Black, Hispanic, and Indigenous people as well as Native Hawaiians, Pacific Islanders, and many segments of the Asian community. |
State and Local Taxes Exist Against a Backdrop of Severe Racial Inequity
Many aspects of capitalism and public policy contribute to racial economic disparities and tax policy often makes them worse. The result is a system that perpetuates racism and makes it much more challenging for people of color to achieve the same economic successes as their white counterparts. The disparities in taxes paid by race reflect broader social, economic and political injustices.
Federal law “guaranteed” equal employment protection in 1964. Nevertheless, Black and Hispanic unemployment rates have remained persistently above white unemployment rates since the 1970s. (The Bureau of Labor Statistics did not begin disaggregating employment data by race until 1972.)[3] During times of crisis, like the Great Recession and coronavirus pandemic, the gaps worsened.[4] In January 2021, while the white unemployment rate sat at 6.2 percent, the Hispanic rate was 9.4 percent, and the Black rate was 9.3.[5] Employment discrimination and fewer employment opportunities in lower-income communities are just two of many causes for employment disparities.
Quality education at all levels is highly indicative of future economic achievements.[7] Early childhood education has positive long-term benefits, particularly for low-income students, but structural challenges stemming from how states and localities tax and allocate those tax dollars mean many Black and Hispanic students often attend under-resourced schools.[8] These early advantages for white students snowball. White adults are more likely to hold a four-year degree than their Black and Hispanic peers.[9] Households headed by someone with at least a four-year degree earn on average four times as much as those headed by someone with only a high school diploma.[10] But the pernicious impact of systemic racism does not end on graduation day.[11] Black college graduates carry far more student loan debt than white graduates on average, due in large part to differences in family wealth. Those higher debt loads impact Black families’ ability to build wealth for the long-term, as evidenced by the fact that the wealth gap between college-educated white households and college-educated Black households has grown significantly in recent years.[12]
Once in the labor force, people of color tend to earn less than their white counterparts due to inequities in educational opportunities and discrimination in pay and hiring, among other reasons. The median income for white households in 2019 was $86,000, compared to $63,000 for Hispanic households, $56,000 for Indigenous households, and $54,000 for Black households.[13] Asian households’ median income was $109,000 that year, though it is important to note that this figure is skewed upward by the fact that a disproportionate share of Asian households live in high-cost areas such as California, Hawaii, and New York, and that many segments of the Asian community have median incomes far below this level.[14]
According to ITEP analyses, white households are also more likely than most other race or ethnic groups to be among each state’s top earners. While 69 percent of households nationwide are white, they comprise 79 percent of top earners (defined as the top 20 percent of earners, or those earning over $114,000 in 2019). Just 9 percent of Black and Indigenous households and 11 percent of Hispanic households are among this group, compared to 23 percent of white households.[15]
While most of those in poverty are white, people of color experience poverty at higher rates. Under the supplemental poverty measure, which accounts for cash income as well as noncash benefits and tax credits, 18.9 percent of Hispanic households were in poverty in 2019 along with 18.3 percent of Black households, 11.7 percent of Asian households, and 8.2 percent of white households.[16] The relatively high rate of poverty among Asian households, despite this group’s above-average income overall, is an indication of the diversity of communities and economic circumstances seen within this group. While poverty rates under the supplemental poverty measure are not reported for American Indian, Alaska Native, Native Hawaiian, and other Pacific Islander families, it is clear from other datasets that these groups experience high rates of poverty as well.
While this study focuses primarily on income and taxes paid as a share of income, there is also an important interplay between systemic racism and wealth that is highly relevant to the impact of taxes across race. Income can be used to survive from day to day and provide for immediate needs. Wealth, or the stock of resources accumulated over time, provides a safety net and allows for investments in the future like paying for college, buying a home, or retiring with security. Since the 1980s, wealth has become increasingly concentrated in the hands of a few. From 1986 to 2016, 99.4 percent of all gains in wealth went to the wealthiest 20 percent. In the same period, the average wealth for white households increased by 84 percent, which was slightly higher than the growth rate for Hispanic households and three times the growth rate for Black households.[17] In 2016, the wealthiest 100 Americans, according to Forbes, owned as much wealth as the entire Black population and the wealthiest 186 on the list owned as much wealth as the entire Hispanic population.[18]
Years of racism and discrimination across all segments of society—the housing market, labor market, financial industry, educational systems, criminal justice, and other areas—have prevented people of color from building wealth on the same level as white families. Black Americans account for 13 percent of the U.S. population but only 4 percent of the country’s wealth. The median Black household holds only 2 percent of the wealth of the median white household.[19] Boosting total Black wealth to be proportionate with the share of the population would require an additional $10 trillion.[20] Or put another way, if Black and Hispanic wealth continue to grow at the same rate they have since the 1980s, it will take Black households 228 years and Hispanic families 84 years to reach white households’ current wealth levels.[21] Asian, American Indian, Alaska Native, Native Hawaiian, and other Pacific Islander households also face barriers to wealth building, but due to smaller population size and diversity within these communities, it is difficult to produce nationally representative data.
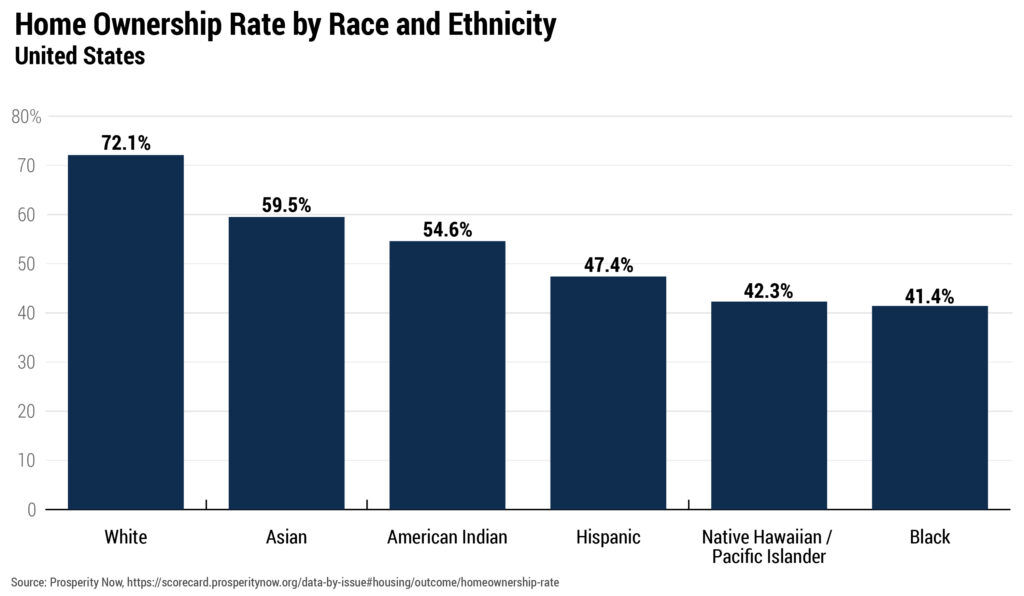
Homeownership is an important component of wealth, and disparities in homeownership across race are profound. Discrimination in government housing policies and the mortgage lending industry, together with white homebuyers’ aversion to living in areas with large Black populations, have led to immensely unequal homeownership rates and home values across race. Black and Hispanic households are much less likely than white households of the same income level to own their homes and tend to see much slower growth in their homes’ values. This tilts certain tax policies such as the mortgage interest deduction, property tax deduction, exclusion of gains on home sales, and other homeowner-only tax breaks heavily in favor of white households.[22] In 2018, while 72.1 percent of white households owned their homes, the same was true for only 59.5 percent of Asian households, 54.6 percent of Indigenous households, 47.4 percent of Hispanic households, 42.3 percent of Native Hawaiian and other Pacific Islander households, and 41.4 percent of Black households.
FIGURE 1
Vast differences in intergenerational wealth and discriminatory lending practices have also created an uphill battle for people of color trying to start or grow a business.[24] As a result, people of color are less likely to own businesses and tend to own smaller businesses than white families. On average, white-owned businesses are valued at four times more than Hispanic-owned businesses and eight times more than Black-owned businesses.[25] Eighty-eight percent of private business wealth nationwide is held by white households compared to just 2 percent by Black households and 1.5 percent by Hispanic households.[26] Typically, the bulk of state and local tax benefits given to businesses flow to very large companies and disproportionately benefit white households.
Given immense racial income inequality, policies such as cutting top income tax rates primarily benefit a well-off group of taxpayers that is overwhelmingly white and therefore tend to worsen racial economic disparities. But the racial wealth gap is even more pronounced than the gap in income, and tax policies that advantage wealth—such as subsidies for investors, business owners, and homeowners, or shunning estate taxes and other forms of wealth taxation—are also highly detrimental to racial equity.
Enormous gaps in income and wealth across race and ethnicity have deep roots in racism, discrimination, and policy failure. Society and the nation’s public policies have provided historical and current advantages that have allowed white communities to build wealth and denied those opportunities to many Black and brown families. But good policy can make a difference and state and local tax codes can be part of the solution if they include robust taxes on income and wealth.
Different Taxes and Revenue Sources Have Stark, Varying Impacts by Race
Tax codes can reduce economic and racial inequality but are generally falling far short of their potential in this regard. State and local governments generally choose from three broad categories of taxes to fund public services: consumption, property, and income taxes. Progressive taxes can reduce income inequality by taxing top-earning filers at higher rates than lower-income people. Regressive taxes do the opposite. Typically, consumption taxes are very regressive, property taxes are somewhat regressive, and income taxes are usually progressive. Just as different types of taxes affect households by income differently, they also have varying impacts by race. This section will illuminate the tax policies and structures that address racial inequity and those that deepen it.
Consumption Taxes
Sales and excise taxes are the primary revenue source for many states. They are also the most regressive type of tax states levy.
Sales taxes are levied on goods and services broadly and excise taxes are levied on specific goods like gas or tobacco. Sales taxes inevitably take a larger share of income from low- and middle-income families than wealthy families because lower-income families usually have to spend much more of what they earn on basic expenses.[27]
Mississippi established the first modern sales tax in 1932. While the policy was not explicitly racialized, the governor’s support of the measure emphasized that it would shift the tax base from property owners (who were mostly white) to consumers (which included Black residents with little else to tax).[28] Other states soon followed Mississippi in adding a sales tax, and today all but five states have a statewide sales tax.
Consumption taxes tend to worsen racial income inequality. They are not based on ability to pay, but rather spending. Low-income households, which are disproportionately households of color, must spend a larger share of what they earn to make ends meet. This means that a larger share of their income is subject to consumption taxes than high-income households, and that lower-income households, therefore, pay a higher consumption tax rate, relative to their income.
Higher-income households, which are predominately white, can also set aside much of their income as savings and, therefore, substantially delay or entirely avoid paying sales and excise taxes. In other words, sales taxes tend to ask the least of white families building large amounts of wealth while asking more of those lower-income families and people of color who are unable to set aside significant amounts in savings.
In Tennessee, for example, both Black and Hispanic households face average effective sales and excise tax rates (5.0 percent of income) that are 28 percent higher than the rate faced by white households (3.9 percent).[29] In other words, people of color are required to spend a larger share of their incomes paying sales and excise tax. This worsens racial disparities in the state by pushing Black and brown families’ incomes even lower relative to white households.
Real Estate Property Taxes
Property taxes are often the primary source of revenue for local governments and a considerable source for funding public K-12 education. Property tax bases typically include only a subset of total wealth: primarily homes and business real estate and, in some states, cars and business property other than real estate. Wealth in the form of business equity, stocks, bonds, patents, copyrights, savings, and other “intangible” assets is not generally taxed by any level of government.
Property taxes are regressive, but not as regressive as consumption taxes. While higher-income households typically own more expensive homes than middle- or low-income households, those homes generally represent a smaller share of both their income and wealth. For instance, a middle-income household’s home might be worth three times its annual income, while a wealthy household’s home might be valued at one-and-a-half times its annual income or potentially much less. Taxes on these homes, then, tend to represent a larger share of income for middle-income families—a fact exacerbated by inaccurate assessments that often overvalue modest homes relative to valuable ones.[30] Property taxes are also levied on renters indirectly as landlords pass along some of that cost in the form of higher rent, and those taxes can represent a large share of income for lower-income renters who spend much of their earnings on rent.
Property taxes have been racialized in their application for as long as nonwhites have been permitted to legally own property. The aftereffects of some of these centuries-old policies are apparent in how contemporary property tax policies are framed. During the brief period of Reconstruction after the Civil War, newly elected Black legislators and their allies raised property tax rates in states like Alabama to fund public education and other public services for all communities. In 1875, when white landowners seized political power, they set to undo many of the political gains advanced by the biracial coalition during Reconstruction. These so-called “Redeemers” enshrined property tax limits in the Alabama state constitution to hamper the ability of future legislators to use property taxes to invest in communities. Today, these constitutional limits still apply and Alabama’s property tax revenue as a share of its state economy is the lowest in the country. Limiting property tax revenue constricts the ability of localities to provide adequate services and forces them to turn to other regressive and racially biased revenue sources such as fines and fees.[31]
The impact of property taxes on racial equity can be complex. Homeownership has been put out of reach for many families of color by long-running disparities in housing policies and mortgage lending. Vast differences in intergenerational wealth, meanwhile, have afforded many white families’ sizeable inheritances that they can put toward a down payment on a home—an advantage less often enjoyed by people of color.[32] As a result, white households are much more likely to own homes and business real estate than households of color and tend to own much more valuable properties on average, factors that tend to result in higher property tax payments from white households. This means that much like in the Reconstruction-era American South, sweeping proposals to reduce property taxes are often advocating for a reduction in taxes paid largely by white households. This is particularly troubling when such proposals are paired with proposals to increase consumption taxes which fall heaviest on people of color and low-income households.
Much of the disparity in home value is driven by explicit racial bias. A 2018 report found that a home in a majority Black neighborhood was likely to be worth 23 percent less than a similar home in a majority white neighborhood, even after controlling for differences in home and neighborhood characteristics.[33] This discrimination in the housing market, driven by white homebuyers’ aversion to living in areas with large Black populations, strips wealth from Black households and other households of color.[34]
A heavy concentration of property wealth in the hands of white families also brings with it higher funding levels for schools in majority white areas. One national analysis found that the average predominately white school district has an additional $2,226 in funding per student compared to the average predominately nonwhite school district – a disparity that creates early advantages for white students and disadvantages for many children of color.[35]
The disparity in education funding levels across communities is arguably the most serious inequity embedded in the property tax, but it is far from the only one. Assessment practices, whereby the value of real estate is estimated for property tax purposes, are wrought with racial bias. Specifically, assessments systematically overestimate the value of Black and Hispanic-owned homes by failing to fully consider racial bias and neighborhood characteristics that lower the market value of these homes. This can leave Black and Hispanic homeowners with tax bills 10 to 13 percent higher than white homeowners living in homes with the same market value.[36] In other words, homes in majority Black and Hispanic neighborhoods are devalued because of racial bias in the market (thereby diminishing owners’ opportunities to build wealth through homeownership), but tax assessments tend to overvalue those homes and increase owners’ property tax payments by comparison.
Moreover, segregation of Black homeowners into areas with lower property values also tends to result in higher statutory property tax rates, or millage rates, in those areas.[37] A jurisdiction with high property values can raise a given amount of revenue with a relatively low tax rate, whereas a jurisdiction with much lower values will require much higher tax rates to achieve the same level of revenue. Besides pushing up tax rates in poorer areas, these disparities make it exceedingly difficult for property taxes to fulfill their function of providing adequate local revenue, particularly for K-12 education. Absent robust state and federal aid, low-wealth communities with smaller property tax bases struggle to fund public education adequately and sustainably, further contributing to economic and racial disparities.[38]
Figure 2 helps to illustrate how some of these complex interactions in income level, home value, assessment practices, and tax rates can play out for homeowners of different races.[39]
FIGURE 2
Illustrating the Racial Equity Impact of Differences in Income Level, Home Value, Assessment Practices, Tax Rates
Example 1: Homeowners with Identical Home Values |
|||
| Black | White | ||
| Annual income | $90,000 | $40,000 | |
| Market value of home | $160,000 | $160,000 | |
| Assessment Ratio | 95% | 90% | |
| Assessed value of home | $152,000 | $144,000 | |
| Tax rate | 0.9% | 0.8% | |
| Property tax bill | $1,368 | $1,152 | |
| Property tax bill relative to home value | 0.9% | 0.7% | |
| Property tax bill relative to income | 1.5% | 2.9% | |
Example 2: Homeowners with Identical Incomes |
|||
| Black | White | ||
| Annual income | $60,000 | $60,000 | |
| Market value of home | $140,000 | $190,000 | |
| Assessment Ratio | 95% | 90% | |
| Assessed value of home | $133,000 | $171,000 | |
| Tax rate | 0.9% | 0.8% | |
| Property tax bill | $1,197 | $1,368 | |
| Property tax bill relative to home value | 0.9% | 0.7% | |
| Property tax bill relative to income | 2.0% | 2.3% | |
| Note: The income and market value levels in these hypothetical examples are informed by ITEP’s analysis of ACS data for North Carolina. |
In the first example, two people own homes with identical market values of $160,000, though the Black homeowner has a significantly higher income ($90,000 instead of $40,000) because they had a lower level of wealth at the time of purchase that prevented them from affording the down payment needed to purchase a more expensive home. (Our review of data from the American Community Survey indicates that, on average, a Black homeowner has a higher income than a white homeowner owning a home of equivalent value.) In this example, the Black homeowner is both over-assessed and faces a higher statutory tax rate than the white homeowner, resulting in a higher property tax bill both in absolute terms ($1,368 vs. $1,152) and relative to home value (0.9 percent of home value vs. 0.7 percent of value). Because the Black homeowner in this example has a higher income, however, the tax bill relative to income is lower for the Black homeowner (1.5 vs. 2.9 percent).
The second example illustrates a related point but does so by holding income constant rather than home value. In this example, both homeowners earn $60,000 per year but the white-owned home is worth $190,000 and the Black-owned home is worth only $140,000. (It is well established that, at any given point in the income distribution, Black homeowners tend to own homes that are less valuable than those owned by white homeowners—partly because of differences in home characteristics and neighborhood amenities but also because of racial bias among white homebuyers.) In this example, the Black homeowner is again over-assessed and faces a higher statutory tax rate than the white homeowner leading to a higher property tax bill relative to home value (0.9 vs. 0.7 percent of value) but a lower nominal property tax bill ($1,197 vs. $1,368) and a lower property tax bill relative to income (2.0 vs 2.3 percent of income).
In sum, while tax bills for the Black homeowners in these examples are lower relative to income, this overlooks the fact that these homeowners are facing discriminatory assessment practices and higher tax rates that push up their tax bills relative to their homes’ market values.
For a Black homeowner and a white homeowner owning homes of similar value in the same taxing district, the Black homeowner is likely to incur a higher property tax bill because of assessment discrimination while receiving the same, or worse, bundle of public services. Looking across taxing districts, a Black homeowner may face a higher statutory tax rate than a white homeowner in a neighboring area if residential segregation has caused the Black homeowner’s taxing district to have a lower overall level of property wealth.
For a Black homeowner and a white homeowner at the same income level, the Black homeowner may pay less property tax because their home is likely to be of lower value (though this effect can be undercut by disparities in assessments and tax rates). But a lower tax bill in this case often brings with it lower education funding levels and school quality in the Black homeowner’s school district.
Fortunately, states have a variety of options for addressing inequities in the property tax. Assessment practices can be improved using more sophisticated price data and techniques.[40] Very high-value homes more likely to be owned by white families can be subject to statewide “mansion taxes.”[41] Revenue from statewide property taxes or other statewide levies should be allocated based on need to ensure that children living in low-wealth communities can receive a high-quality education. And property taxes on lower-income families who may struggle to pay those bills—including renters who pay property tax indirectly through their rent—can be offset through refundable property tax circuit breaker credits.[42] All these reforms can meaningfully improve the racial equity of real estate property taxes.
Estate and Inheritance Taxes
Taxation of inherited wealth is essential to slow the growth of the racial wealth gap and of overall wealth disparity. People of color will not be able to catch up to the compounding generational wealth of white households solely by increases to their own wealth and income. White households are four and a half times more likely to receive a gift or inheritance from family members than Black households and tend to receive much larger inheritances on average.[43] Estates and inheritances, which are major contributors to intergenerational wealth disparities, are generally exempt from income and property taxation and are only taxed under more limited estate or inheritance taxes in 17 states and the District of Columbia.
Estate and inheritance taxes have shrunk in their scope and effectiveness in the past two decades. Currently, only estates valued over $11.58 million are subject to the federal estate tax (or double that amount for married couples). This is the highest exemption ever, even after adjusting for inflation, and means that less than two out of every 1,000 estates are subject to estate tax collection.
The weakening of the estate tax at the federal level has trickled down to states. Repeal of a federal estate tax credit eventually contributed to 38 states’ decisions to repeal their estate taxes as those taxes could no longer be credited against federal estate tax liability. Moreover, many states’ estate tax rules are linked to the federal exemption level and significant increases in that exemption enacted by Congress in recent years have caused many states to boost their own estate tax exemptions as well.[44] The estate tax is one of the few ways wealth is taxed at all and is essential to reducing growing economic inequality. Because wealth is so disproportionately held by white households, increasing racial equity requires a strong estate tax.
Two Dimensions to Assessing the Equity Impact of TaxesThe fairness of any tax can be looked at in two important ways, vertical equity and horizontal equity. Both lenses offer valuable insights when assessing the effect of taxes across race and ethnicity. Vertical equity addresses how a tax affects different families from the bottom of the income spectrum to the top—from poor to rich. In a nation with enormous racial income gaps, vertical equity is a key consideration when evaluating racial equity. A highly regressive tax that asks less of top earners than of lower- and middle-income families is much more likely to worsen racial income inequality than a progressive tax. This is because the top earners who pay the least under regressive taxes are disproportionately white, while high-taxed families of more modest means will include a disproportionate share of people of color. Horizontal equity is a measure of whether taxpayers with similar circumstances such as income or family size pay similar amounts of tax. In general terms, if one family pays much higher taxes than a similarly situated family next door, that may violate horizontal fairness. Horizontal inequities across race appear throughout state and local tax codes. Assessment discrimination under the property tax is one example, where owners of similarly valued homes receive different assessments and pay different amounts of property tax, often resulting in people of color paying more. There are also many examples of horizontal inequity in personal income taxes. Often this occurs when states or the federal government advantage certain types of income that are more likely to flow to white taxpayers not just overall, but at any given point in the income distribution. Generations of policy advantage and privilege have allowed white families to build wealth far in excess of the wealth held by families of color. As a result, income generated from wealth such as capital gains, business income, and even retirement income disproportionately flows to white families—and states often afford these types of incomes preferential treatment. When comparing a Black family and a white family that each earn $100,000, the white family will, on average, derive more of its income from these tax-advantaged sources and the Black family will pay more tax as a result. When states choose to treat income from wealth more favorably than income from work, they are advantaging white families at the expense of people of color. Such an approach results in vertical inequities because upper-income white families with the greatest ability to pay receive an outsized share of the tax cuts. And it creates horizontal inequities because it allows white families to pay less tax than families of color with similar overall incomes. |
Personal Income Taxes
Graduated personal income taxes are the most progressive tax structure commonly used by states and can be a powerful tool for narrowing racial income and wealth gaps as they are based on households’ ability to pay. Targeted refundable credits also help to offset the other more regressive taxes that disproportionately impact low-income people. Because households of color are more likely to fall in lower income groups and white households are more likely to fall in higher income groups, a graduated income tax narrows the racial income gap by taxing low-income households of color less and high-income white households more.
Our analysis of Minnesota’s relatively progressive personal income tax, with rates ranging up to 9.85 percent for high-income filers, illustrates this point. As is true throughout the country, Black and brown families confronting the compounding effects of years of racism and discrimination receive incomes significantly below Minnesota’s statewide average. Black households, for instance, earn an average of $47,000 per year, Indigenous households earn $54,000, and Hispanic households earn $55,000 on average. White families, meanwhile, earn almost $95,000 on average.[45] Appropriately, then, the average white family in Minnesota pays a somewhat higher personal income tax rate (4.1 percent) than most other groups. Indigenous families pay 3.4 percent on average, Hispanic families pay 3.2 percent, and Black families pay 3.1 percent.[46] Simply by basing tax liability on ability to pay, Minnesota’s income tax is able to narrow racial income inequality somewhat.
But opportunities abound for building on the success of personal income taxes. Making state personal income taxes more progressive will bolster their effectiveness in addressing racial inequalities in income. Even putting progressivity aside, however, reforms focused on broadening the tax base can also improve racial equity. Many types of income that are afforded special treatment in state tax codes, such as income derived from investments, businesses, and retirement savings, disproportionately flow to white households even if overall income is held constant. A long history of scholarship has pointed to carveouts for these income sources as being highly problematic from the perspective of racial equity.[47]
While state personal income taxes are generally applied to both earned and unearned income, states treat income that is derived from investments more favorably. For instance, in nine states (Arizona, Arkansas, Hawaii, Montana, New Mexico, North Dakota, South Carolina, Vermont, and Wisconsin), income tax deductions or preferential rates are provided for all long-term capital gains, meaning earnings from the sale of assets such as stocks, bonds, or antiques. And while other states may not give as complete a preference to capital gains income many others, such as Connecticut, Idaho, Kansas, Kentucky, Louisiana, Maine, Maryland, Mississippi, Nebraska, New Jersey, North Carolina, and Oklahoma offer tax reductions for realized gains from certain types of assets.[48] Moreover, every state income tax offers a “deferral” benefit where gains in asset value are not taxed until assets are sold, allowing investors to generate returns tax-free for years or even decades before any tax must be paid.
Higher-income households are more likely to derive a large portion of their income from investments than lower-income households. A disproportionate share of higher-income households are white and are more likely to benefit from the preferential treatment of investment income for that reason. But even at a given point in the income distribution, large differences in wealth across race make white people more likely to benefit from tax subsidies for investment income.[49] In other words, preferential treatment of investment income worsens racial equity across two separate dimensions: vertically (comparing rich to poor) and horizontally (comparing households of different races with similar overall incomes).
Approximately 8.1 percent of Black households and 7.3 percent of Hispanic households own stocks or mutual fund shares outside of a retirement savings account. Among non-Hispanic white households, by contrast, the comparable figure is 27.9 percent. Even among asset owners, the gaps in the asset value are staggering. The median white household owning stocks or mutual fund shares owns $45,100 in such assets compared to just $20,000 for Hispanic households and $8,500 for Black households.[50]
Itemized deductions, which include homeowner tax subsidies such as the mortgage interest and property tax deductions, also favor wealthier white households. Thirty-one states allow some type of itemized deduction and most of the benefits of such policies tend to flow to higher-income households. In 2018 just 5.7 percent of households with income under $100,000 claimed federal itemized deductions compared to nearly half of all households with income over $200,000. Among filers with income above $1 million, more than seven in ten claimed federal itemized deductions that year.[51] The benefits of itemized deductions are particularly concentrated across race because people of color are less likely than white people to own their homes even after controlling for differences in income and because homes owned by people of color tend to have lower market values.[52] That is, the combination of higher incomes, higher homeownership rates, and higher home values among white households makes itemized deductions especially skewed toward white families.[53] The same is true for the exclusion from income for capital gains received from the sale of a home, which tends to be most beneficial to white homeowners’ whose property values appreciate more rapidly than other homeowners due in part to white homebuyers’ aversion to living in areas with large nonwhite populations.[54]
Furthermore, tax subsidies for income passed through from a business to an individual are also tilted toward high-income white households. A few states (Colorado, Idaho, and Iowa) are coupled to the new federal pass-through deduction created by the 2017 Trump tax law while others like Ohio, Oregon, and South Carolina have their own breaks for pass-through income. Wealthy business owners receive the bulk of the benefits from pass-through business tax subsidies, a group which is overwhelmingly white.
Most states also offer tax preferences to seniors or on retirement income, thereby reducing their personal income tax. These preferences can take the form of flat dollar deductions for taxpayers above a certain age or exemptions from income tax for Social Security, pension, or other retirement income. These kinds of tax subsidies are skewed in favor of older and more affluent white taxpayers and tend to worsen racial inequities in both income and wealth.[55] Centuries of racism and discrimination have given white families retirement savings and incomes far beyond those held by people of color, meaning that tax subsidies directed toward this type of income will largely benefit white families. People of color are less likely to have access to tax-preferred retirement accounts through their work and more likely to provide financial support to parents or grandparents—both things that make it more difficult to build significant retirement savings.[56] Moreover, the structure of many state tax subsidies by their nature makes the distribution even more lopsided, offering larger tax cuts per dollar of income to higher-income seniors in higher tax brackets, who are more likely to be white.
Despite shortcomings in many state income tax designs, the personal income tax is often the most progressive tax equity tool at states’ disposal and can play an important role in addressing racial disparities. Income taxes that include graduated rates, low-income credits, and a broad base free of carveouts for investment income, retirement income, or homeowners will tend to be most effective at advancing racial equity.
Corporate Income Taxes
The vast majority of states levy corporate income taxes on the profits earned by C corporations, though various tax subsidies, sophisticated tax avoidance techniques, and tax rate reductions have eroded these taxes substantially in recent years. Nevertheless, corporate income taxes are a meaningful, progressive source of revenue for state governments. Because they fall on owners of corporate stock, a group that is predominately very high income and white, they tend to narrow income gaps along racial, ethnic and economic lines. In total, close to 90 percent of corporate equities and mutual fund shares are owned by white families. Just 1 percent are owned by Black families and less than 1 percent are owned by Hispanic families.[57]
Fees and Fines
ITEP’s analyses typically focus on the revenue and distributional impact of taxes, but non-tax revenue is also important to state and local coffers and to families’ financial wellbeing. Non-tax revenue can include fees, fines, service charges, or any other monies collected by a state or local government outside of the tax code. As state governments have cut funding and limited jurisdictions’ taxing authority, localities have become more reliant on fees and fines as a source of revenue. But fees for government services and public safety fines are generally regressive revenue sources, and the communities from which these non-tax revenues are collected are often communities of color and low-income communities.[58]
Government officials who collect fees and fines, often police officers and court officials, have an enormous degree of discretion in choosing who is subjected to monetary penalties. The U.S. Commission on Civil Rights found that the “unchecked discretion or stringent requirements to impose fines or fees can lead and have led to discrimination and inequitable access to justice.”[59] That is, a lack of oversight and pressure to collect revenue are encouraging over-policing and criminalization of communities of color. In 600 localities across the country, fines account for more than 10 percent of general revenues and in one-third of those communities, fines account for 20 percent or more of the budget. In 2015, the U.S. Department of Justice found that every branch of the city of Ferguson, Missouri’s government participated in a system that disproportionately targeted Black residents with fees and fines. Investigative reporting in 2018 found that the city of Chicago’s enforcement practices for vehicle registrations were forcing low-income Black residents into a cycle of debt.[60] And a 2020 study found that Black, Hispanic, and low-income New Yorkers disproportionately suffer driver’s license suspensions due to unpaid traffic tickets and racially disproportionate traffic stops.[61]
Fees and fines make state and local revenue systems even more regressive than ITEP’s analyses typically show. Further, inequitable enforcement of public safety fines can lead to a cycle of debt and criminalization, stripping more wealth and human capital from already disadvantaged communities.
Case Study: Distribution of Taxes by Race in Minnesota and Tennessee
The choices state and local lawmakers make in setting tax policy matter enormously in determining the overall equity of their tax systems. Revenues raised through taxes are vital to funding public investments in education, health, and the safety net that can combat inequality and systemic racism. But how governments collect those taxes also has a direct effect on racial disparities. At their worst, regressive state and local taxes can actively exacerbate racial inequities by asking the most of those groups with the lowest incomes. At their best, state and local taxes are chipping away at racial income and wealth gaps, though even the best performing states by these measures have much work to do before their tax structures can begin meaningfully addressing racial inequities.
To illustrate these points, this section compares two states with dramatically different tax structures. Tennessee levies an extraordinarily high sales tax rate, includes groceries in its sales tax base, declines to levy a personal income tax, and does not offer families any tax-offsetting refundable credits, such as an Earned Income Tax Credit (EITC) or property tax circuit breaker.[62] Minnesota, by contrast, raises a significant share of its tax revenue through a robust personal income tax with graduated rates on higher-income families paired with refundable tax credits, and it relies less heavily on sales taxes to fund its public services and institutions.
The result of these divergent policy choices is a starkly different distribution in tax liability by both income level and race.
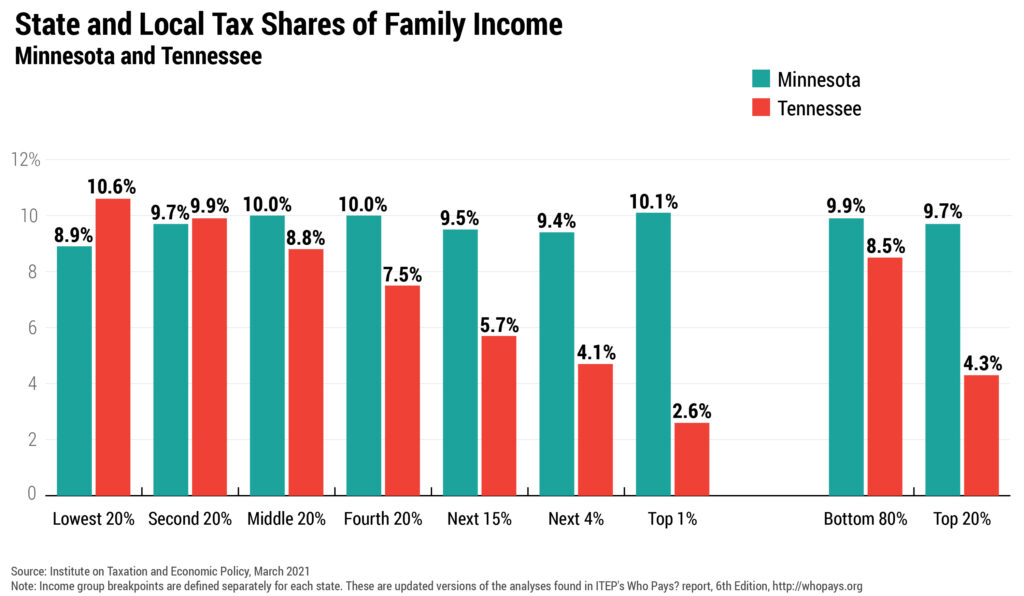
Figure 3 compares the distribution of these two tax systems by income level. It shows that for upper-income families, Minnesota is the higher-tax state because it levies an income tax on those families’ sizeable incomes. For lower-income families, however, Tennessee is the higher-tax state because of its high sales tax. A previous ITEP analysis found that Tennessee has among the most regressive tax systems in the nation, meaning that it asks far more of low- and middle-income families than of the wealthy. Minnesota, by contrast, has a system that ranks among the least regressive—though even its system falls short of being truly progressive at all income levels.[63]
FIGURE 3
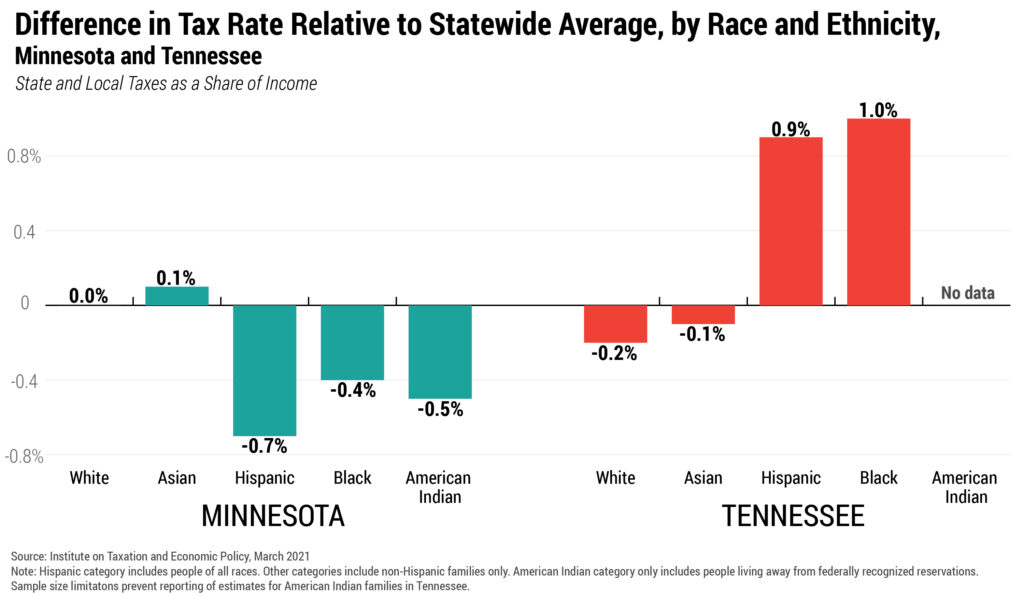
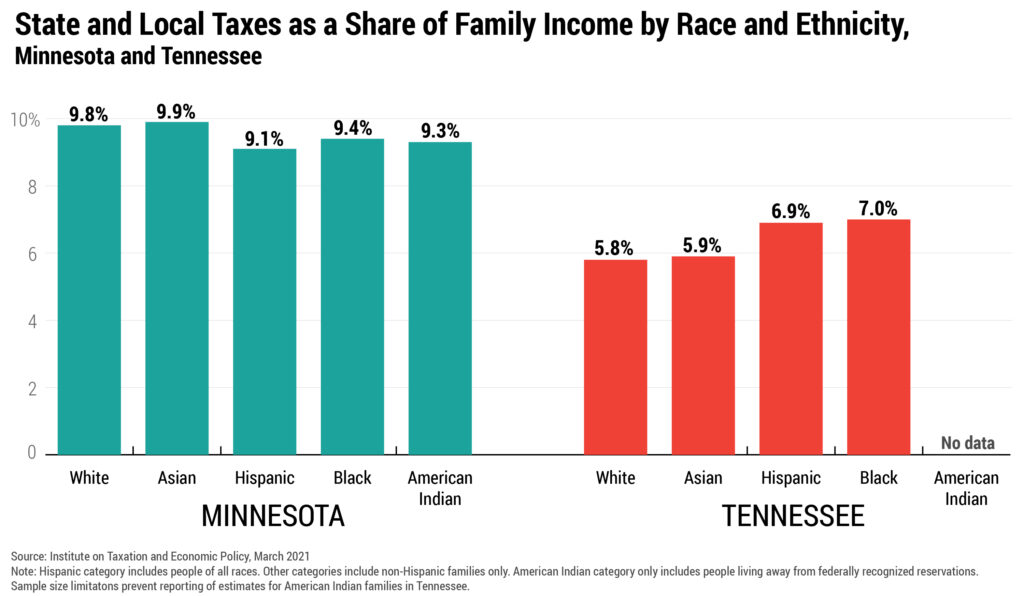
Using our new capacity to disaggregate state and local tax incidence by race, we find that these differences in policy—with Minnesota raising significant revenue through a personal income tax and Tennessee raising the bulk of its money through a high general sales tax—lead to starkly different impacts across race and ethnic groups.[64] Figure 4 shows that in Minnesota, groups with lower average incomes that are being disadvantaged by years of racism and discrimination are appropriately taxed at rates slightly below the statewide average. Black families pay a tax rate 0.4 percentage points below average, Indigenous families pay an average rate 0.5 percent below average, and Hispanic families’ average tax rate is 0.7 percent below average. White families, by contrast, pay slightly more on average because they have higher average incomes. And Asian families on average pay slightly more as well, though this likely does not hold true through all segments of the Asian community as Hmong, Laotian, and Burmese people in Minnesota, for instance, have incomes significantly below the statewide average.[65] Overall, by tending to tax people of color at slightly lower rates than white families with higher incomes, Minnesota’s tax system helps to advance racial equity, albeit slightly. But it must be recognized that this outcome is partly due to Minnesota’s extremely wide racial disparities in income—that is, if incomes across race in Minnesota were less unequal before taxes, tax rates across groups would be even more similar.
In Tennessee, the racial and ethnic distribution of taxes is turned on its head. The groups with lower average incomes, including Hispanic and Black families, are taxed at higher rates than groups with higher average incomes such as white and Asian residents. (Sample size limitations prevent us from estimating the effective tax rate paid by Indigenous families in Tennessee, but we expect that it is above average.) Relative to the statewide average, Black families tend to pay an additional 1 percent of their income in Tennessee state and local taxes while Hispanic families pay an additional 0.9 percent. These higher tax rates on groups with the lowest incomes directly exacerbate racial income inequality. In other words, the highly unequal distribution of incomes across race and ethnicity in Tennessee is actively made worse by Tennessee’s regressive tax system.
FIGURE 4
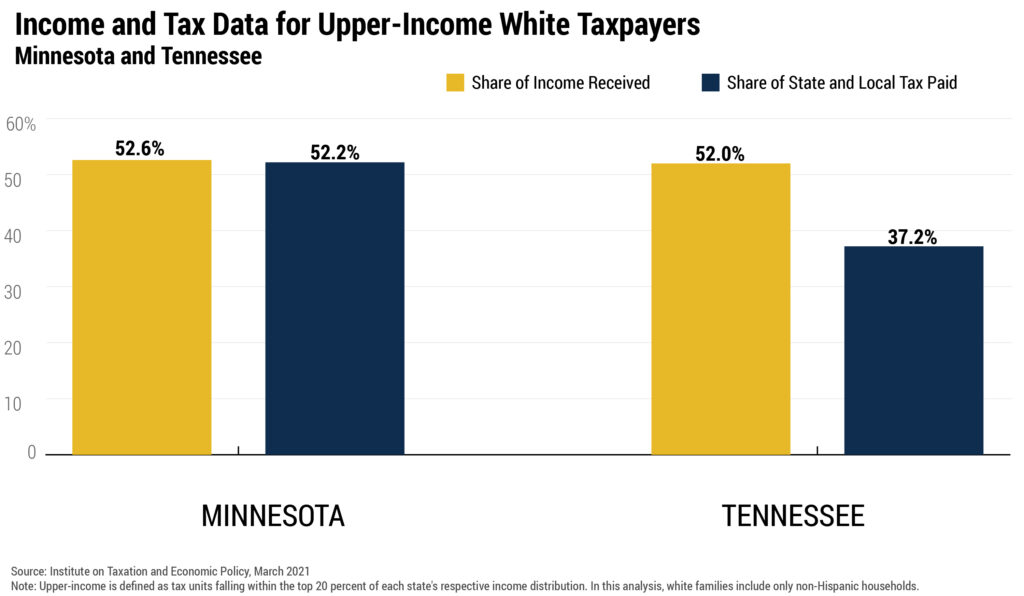
White families pay the lowest overall tax rate in Tennessee, but of course families at different income levels experience Tennessee’s highly regressive tax system very differently. The low overall average tax rate paid by white families is heavily skewed by top earners who receive an outsized share of income and yet pay very low tax rates. More than half (52 percent) of all income in Tennessee flows to a relatively small group of white families earning more than $87,500 in income per year (enough to put them among the top 20 percent of Tennessee earners). And yet despite enjoying most of the state’s income, this group pays just 37.2 percent of residents’ state and local taxes. This underpayment relative to income leaves a diverse mix of lower- and middle-income families to pay an outsized share of all tax dollars. Families of all races and ethnicities earning below $87,500 in Tennessee enjoy just 40.1 percent of statewide income but pay 57 percent of residents’ state and local taxes.
Minnesota’s tax system produces a very different outcome by this measure. Upper-income white families (defined in Minnesota as those earning more than $115,300) earn a similar share of income to their counterparts in Tennessee (52.6 percent of statewide income) and yet under Minnesota’s more equitable tax code this group pays a share of taxes closer in line with its share of income: 52.2 percent of the total. Under a truly progressive system, upper-income families would pay a share of tax dollars that exceeds their share of income, so by that standard Minnesota still has significant room for improvement. Nonetheless, Minnesota and Tennessee’s outcomes by this measure are quite different.
FIGURE 5
Clearly, Minnesota lawmakers have better positioned their tax code to be a positive force in addressing racial income inequality. But the story is not an entirely positive one. There are horizontal inequities embedded throughout Minnesota’s tax code that advantage white families relative to families of color with similar incomes. Recent research has shown that Black and Hispanic homeowners in Minnesota see their properties over-assessed relative to white homeowners, a fact that results in higher property tax bills for people of color relative to white people living in similarly valued homes.[66] Moreover, income tax preferences for homeowners such as the mortgage interest deduction, property tax deduction, and exclusion from income for gains on home sales also disproportionately subsidize white families as those families have higher homeownership rates even after controlling for differences in income. Additional advantages afforded to wealthy households such as deferral of tax on unrealized capital gains and stepped-up basis for assets passed on to heirs also privilege white wealth holders over people of color.
Minnesota is also confronting a higher degree of pre-tax racial income inequality than exists in Tennessee, and indeed Minnesota’s disparity is among the worst in the nation.[67] Even after state and local taxes are collected, the gap in average income between white families and Black families, and between white families and Hispanic families, remains larger in Minnesota than it is in Tennessee. Scholars have referred to Minnesota’s status of being one of the best states to live in, but among the worst for Black families, as the “Minnesota Paradox.”[68] This paradox is demonstrated not just in racial income disparities, but also disparities in unemployment rates, homeownership rates, incarceration rates, and school disciplinary rates. These outcomes can be traced back to racially discriminatory policies such as redlining, racial covenants, hiring discrimination, and the construction of an interstate highway directly through thriving Black neighborhoods—all policies that became institutionalized and “baked into” Minnesota life.
In an ideal system, then, it may be appropriate for Minnesota to be doing substantially more than Tennessee to address racial inequity through its tax code simply because its underlying racial income gap is larger. But neither of these states are maximizing the potential of their tax codes in this area. Enormous, unconscionable gaps in income across race and ethnicity persist in both even after taxes are applied, indicating that much work remains to be done both through the tax system and other policy areas.
Inevitably, the answer lies in more robust taxes on income and wealth. In Minnesota, this could involve reforms such as higher rates on investment income or new tax brackets for very high incomes, both of which Gov. Tim Walz has recently proposed.[69] Currently, Minnesota’s top bracket applies to taxable income in excess of $166,040 for single filers or $276,200 for married couples—a higher threshold than in most states but one that does not fully reflect the much higher incomes and ability-to-pay of taxpayers at the very top where incomes are measured in the millions of dollars per year. In Tennessee, the path toward a more racially equitable tax code is more difficult as the state lacks any taxes on personal income, estates, or inheritances and the state’s constitution specifically forbids taxes on earned income. The starting point for beginning to address income and wealth inequalities through the tax code is to levy taxes on income and wealth.
Of course, the distribution of tax liability is not the only relevant factor to consider when assessing the racial equity impact of a state’s tax system. Taxes exist first and foremost to pay for public investments, and thus the overall tax level is critical in determining whether a state and its localities have the resources needed to fund services and institutions that are essential to advance equity and build broadly shared prosperity. By this measure as well, Minnesota outperforms Tennessee in raising significantly more revenue overall – largely as a result of its higher overall tax rates on the top earners who enjoy an outsized share of all income.
Figure 6 shows that average tax rates are higher in Minnesota than in Tennessee for all race and ethnic groups—though recall from Figure 3 that many lower-income families pay more tax in Tennessee than they would if they lived in Minnesota. The largest gaps in overall average tax rates between these two states are for the higher-income groups. Looking at population wide averages, white and Asian households each pay about 4 percentage points less on average in Tennessee than in Minnesota. Hispanic and Black households, by contrast, pay just 2.2 and 2.4 percentage points less in Tennessee relative to Minnesota. These lower overall tax levels directly translate into less adequate funding for vital services and institutions.
FIGURE 6
Minnesota, for instance, spends 36 percent more on education per student relative to Tennessee.[70] Unlike Tennessee, Minnesota built on its history of investing in health care coverage and expanded Medicaid under the Affordable Care Act. The state now has among the best rates of health insurance coverage in the nation. While Minnesota’s health insurance rates are still worrisomely low for Black, Hispanic, and other low-income families, it has better coverage rates than Tennessee for all these groups.[71] In particular, Tennessee has the second-worst coverage rate for Hispanic families of any state, with more than one in three Hispanic families lacking health coverage.[72] Also unlike Tennessee, Minnesota offers a state Earned Income Tax Credit that boosts the incomes of workers earning lower wages. This income boost can help close opportunity gaps by providing additional funds that can be used for things like a damage deposit on an apartment, to cover expenses needed to succeed in the workplace, or to get children off to a stronger start.
Looking ahead, Minnesota should be poised for more sustainable revenue growth than Tennessee because it asks more of top earners—the group enjoying the fastest growth in their incomes. But Minnesota’s budget outlook is not entirely rosy, and the long-run trend has been a decline in revenues relative to personal income. Minnesota Gov. Tim Walz has recently proposed boosting taxes on top earners, which would bring in new revenues that could be used for important new investments such as quality education for every Minnesota child—including by recruiting and supporting more teachers of color—bringing down the cost of a college education, addressing the state’s affordable housing shortage, expanding the state’s mass transit systems, ensuring all Minnesota families can have affordable child care that meets their needs, and closing broadband access gaps.
The lessons from Minnesota and Tennessee’s tax policy choices are clear. A robust, progressive personal income tax can directly counteract racial inequity by asking more of affluent white families, and the revenue it raises is also vital to funding health, education, and other areas that are essential to building broadly shared prosperity.
Heavy reliance on regressive sales taxes, by contrast, leads to a tax system that asks the most of lower-income people, including a disproportionate share of people of color. And it can hamper long-run revenue growth during times of widening income inequality when an outsized share of new income flows to high-income families who are unlikely to spend it on items subject to sales tax.
Minnesota lawmakers can do much more to meaningfully address racial inequities through the tax code. But the initial steps they’ve taken illustrate that tax policy choices matter, and that state and local tax codes can promote racial equity.
Revenue Adequacy and Sustainability Are Racial Equity Issues
Unlike the federal government, in most instances states and localities cannot operate on a deficit. This means that most revenue needed to provide essential services to residents must be derived from taxes and fees. An equitable tax code must adequately fund necessary services and must have long-term sustainability.
The most vital function of any tax code is to provide adequate funding for the public services and institutions needed for broadly shared economic prosperity. Far too often, communities of color are asked to bear the brunt of regressive tax systems both by contributing a larger share of their income in taxes and by enduring cuts to programs when overall funding levels fall short.
Tax policy choices do not occur in a vacuum. They reflect society’s biases and values. When a local government raises revenues via fines and fees and disproportionately targets underserved communities with violations, it can send lower-income people into a spiral of debt from mounting fees and penalties, and in some instances, it unjustly criminalizes people who cannot afford to pay. Similarly, when a state or local government shifts taxes away from those most able to pay (e.g., by reducing personal income taxes) to those least able to pay, it increases inequity and threatens tax adequacy.
Perhaps the most well-known example of racial biases and inadequacy in tax policy choices is California’s Proposition 13. Passed by popular vote in 1978, the measure prevented property assessments and taxes from keeping pace with rising home values under the guise of protecting middle-income homeowners. This insulated established white homeowners from increased taxation and shifted the burden onto new homeowners who were more likely to be Hispanic and Black. It also ravaged the state’s property tax base, stripped available funding for public schools and dropped California’s school rankings from “First to Worst.”[73] Passage of the measure was a dramatic shift from the previous consensus among people and the business community that taxes should be able to keep pace with the cost of funding vital public investments, from water projects to public education. The state, once majority white, was growing increasingly diverse. A vocal Black and Hispanic population began demanding equity in education, housing, job opportunities and other areas of life. Growing white resentment and campaign rhetoric centered on so-called taxpayers and takers contributed to the outcome, which had lasting effects on California communities’ ability to raise revenue.
Nearly three decades later, tax cuts and spending cuts damaged low-income communities and communities of color in Kansas. In 2011, Gov. Sam Brownback’s overhaul of state government included massive income tax cuts that primarily benefitted the highest-earning Kansans. The policy changes also resulted in cuts to public benefits program spending and a restructuring of school financing formulas in a way that primarily harmed poorer districts. While the Brownback income tax cuts primarily benefitted high-income white households, the accompanying increase to sales taxes and elimination of targeted low-income tax credits resulted in a tax increase for the lowest-earning 40 percent of Kansas taxpayers. This hurt many white families—the state is over 85 percent white and the vast majority of poor Kansans are white. But Black and Hispanic Kansans are overrepresented among low earners, meaning most Black and Hispanic Kansans faced a tax increase from the so-called Brownback tax cuts.[74] These low-income households of color were also hurt by reduced per pupil spending in public schools and a failure to expand Medicaid.[75]
These examples from different states and time periods illustrate the importance of a tax structure that not only collects revenue in an equitable way, but also collects an adequate and sustainable amount of revenue. Advancing racial and economic equity through tax policy requires as much.,
Tax Treatment of Indigenous Families Living on Tribal LandThe U.S. government robbed Indigenous nations of their land, forced citizens onto reservations, and repeatedly violated treaties.[76] This apartheid has contributed to economic barriers for many Indigenous peoples.[77] The Minnesota analysis included in this report only includes Indigenous families who are not living on federally recognized reservations, a group known as urban Indians, who are subject to all the same state and local tax laws as people of any other race or ethnicity. Indigenous families living on reservations are excluded from all our analyses of state and local taxes because, as sovereign nations, many tribal governments have their own independent systems of taxation.[78] The power to tax is inherent to tribal sovereignty and nationhood, but that sovereignty is often infringed upon. This is partly because current federal tribal tax policy is incomplete, which leaves room for legal disputes between governments with overlapping jurisdictions and competing interests such as revenue needs.[79] While the complexity of their tax situations prevents us from estimating the taxes paid by tribal citizens living on reservations, it is important to note that tribal citizens living on reservations pay significant federal, state, local, and tribal taxes. Tribal citizens living on reservations pay federal income tax and often pay state and local income tax as well. Tribal citizens who both live and work on their reservation are not subject to state and local income taxes but a scarcity of jobs on reservations forces many Indigenous workers to look for employment elsewhere, thereby bringing them within reach of state and local income tax law. Our review of data published by revenue departments in Montana and New Mexico suggests that most income earned by Indigenous people living on reservations is earned away from the reservation and is therefore subject to state income tax. Purchases made on reservations by tribal citizens are often not subject to state and local sales or excise taxes though they may be subject to tribal taxes. In practice, most reservations lack a significant retail sector and tribal citizens must therefore travel outside their reservations to purchase many goods and services, thereby causing them to pay state and local sales taxes. But tax laws vary considerably across states. In Montana, for instance, the state collects excise taxes on tobacco, alcohol, and motor fuel purchases made on reservations. Because of revenue-sharing agreements between the state and various tribal nations, tribal governments recoup some of that lost revenue.[80] Tribal citizens living on reservations may be subject to state and local property taxes if the property’s title is classified as fee simple. The title for fee simple land is held by the owner in contrast with reservation trust land which has the title held in trust by the federal government. While fee simple land is subject to state and local taxation, reservation trust land cannot be taxed.[81] It is also important to recognize that many people transition between living on or away from reservations and are thus subject to different tax systems at different times. The taxation of commercial activity on reservations can also be highly complex and contentious, at times leading to dual taxation that interferes with tribal sovereignty and makes it difficult for tribes to chart their own policy course.[82] In sum, while data limitations prevent us from estimating the precise state and local tax contribution of tribal citizens living on reservations, it is clear that they contribute significant funding to those governments in part because poor economic conditions on reservations lead many tribal citizens to work or shop in areas away from their reservations. |
Tax Policy Recommendations to Advance Racial Equity
State and local tax codes are potentially important tools in advancing racial justice. To shrink the racial income gap after taxes and improve the lives of residents of color, states should strengthen the most progressive parts of state tax codes and raise significant new resources to invest in people and communities. Policymakers should consider a few broad themes when crafting more racially equitable tax policy. To work toward a more racially equitable tax code, lawmakers should:
- Ensure the wealthy pay their fair share by structuring a progressive tax code free of special treatment for people with high incomes or wealth.
- Improve the financial standing of low-income families with targeted, refundable credits.
- Reduce reliance on fees and fines by shifting toward progressive revenue sources at the state and local levels.
- Create adequate, sustainable revenue levels to support the public services and institutions that are essential to building broadly shared prosperity.
Meaningfully advancing racial equity through state tax policy will require bold tax reforms. There is no shortage of potential tax reform options within these broad categories.
Ensure the wealthy pay their fair share. One of the biggest drivers of racial inequity in state and local tax codes is the comparatively low rate paid by the wealthiest taxpayers. To ensure the wealthy pay their fair share, lawmakers should strengthen personal income taxes by widening outdated income tax brackets, adjusting tax brackets for inflation, raising rates for upper brackets, and implementing a “millionaires’ tax” or surcharge on very high-income earners. States can also improve corporate income taxes by adopting worldwide combined reporting to include domestic and foreign profits, including “GILTI” (Global Intangible Low-Taxed Income) in their tax bases, creating or increasing corporate minimum taxes, improving corporate tax disclosure, decoupling from federal giveaways, and improving tax subsidy oversight.[83] Under state income tax law, the wealthy often avoid paying significant amounts of tax through use of special tax subsidies such as credits, deductions, exemptions, or preferential tax rates. Often, policies intended to help average families are unnecessarily also made available to wealthy individuals who need no such assistance. To ensure that tax breaks are going to those with the greatest need, states can pare back or eliminate itemized deductions for expenses such as mortgage interest, property taxes, and charitable gifts as well as tax subsidies for investment income, pass-through business income, and other regressive subsidies such as deductions for federal income tax payments.[84]
States can also seek to tax wealth, or property, more equitably. For instance, they can make property taxes more progressive by applying a higher rate to higher-value homes and second homes.[85] States should explore expanding property taxes to include intangible assets like stocks, bonds, patents, and copyrights and can tax income from wealth at higher rates than income from work. Lastly, states should be sure to levy robust taxes on inherited fortunes to reduce the buildup of extreme wealth across generations and reduce the racial wealth gap. This can be done by enacting or raising estate and/or inheritance tax rates and decoupling from recent federal estate tax cuts.[86]
Improve the financial standing of low-income families. States have a variety of powerful options at their disposal for lifting the incomes of lower- and moderate-income families. The Earned Income Tax Credit (EITC), for instance, is offered by most states in some form. The credit is both a highly effective way to boost wages for lower-income workers and a relatively easy credit to administer because states can piggyback on the existing federal credit.[87] The EITC has been effective at helping to reduce income inequality for Black and Hispanic households.[88] It is important that the credit be made refundable so that even the lowest-income workers with little personal income tax liability can access its full benefits.
Property tax “circuit breaker” credits are also a valuable tool for advancing racial and economic equity. These provisions assist families whose property tax bills, or rent payments, are very high relative to income.[89]
Refundable tax credits for households with children, or for those paying significant childcare expenses, can also bring financial stability for families that has been shown to improve child wellbeing.[90]
Reduce reliance on fees and fines. Fees and fines are punitive rather than based on ability to pay, making them generally regressive. Their link to the criminal justice system also makes racial bias deeply entrenched in how some fees and fines are levied. But many states and localities are overly reliant on revenues from fees and fines to fund basic functions.
State governments have a range of much more equitable revenue options at their disposal and should avoid a heavy reliance on fees and fines. Local governments, unfortunately, often have fewer choices because most states restrict the ability of their cities, counties, and other local jurisdictions to levy progressive revenue sources such as personal income taxes. As a result, most localities are forced to choose between funding local services with somewhat regressive property taxes, sharply regressive sales taxes, and fines and fees that are also generally regressive. Rather than ‘stacking the deck’ with these problematic options, state policymakers should expand local control and allow these jurisdictions to choose progressive revenue options such as local income taxes, which can be structured as surtaxes that easily piggy-back on the state income tax structure. Extending such options would empower residents and local officials to choose policies that reduce inequalities in their own local communities.
Create adequate, sustainable revenue levels. The main role of tax policy is to raise the money needed to fund public investments in education, infrastructure, health, and other areas that are essential to building broadly shared prosperity. With this in mind, the case for progressive tax policy is even stronger.
An outsized share of all income, and an even more outsized share of all wealth, is held by a relatively small number of the nation’s most affluent households—the overwhelming majority of whom are white. Making matters worse, these same affluent households are also enjoying much faster income growth than most families. With these two facts in mind, it is apparent that robust, progressive taxes on affluent families are a powerful way to generate revenue both in the short-run and over time.
Asking more of high-income and high-wealth households is an effective way to directly combat racial inequities in income and wealth. It is also a powerful way to raise meaningful, sustainable revenues to be put toward public investments that allow people of color, and working people broadly, to prosper.
Tax Policies to Advance Racial EquityLevy Progressive Personal Income Taxes
Tax Wealth
Offer Targeted Refundable Credits
Tax Corporate Income
Reform Consumption Taxes
Reduce Fees and Fines
|
Conclusion
State and local tax codes are not race-neutral. Historical and contemporary policy choices have resulted in state tax codes that at best maintain, and in fact often worsen, racial inequities. But just as policymakers and stakeholders came together to create our current systems, we can also work together to create something better. Taxes on income and wealth have a valuable role to play in narrowing unconscionable disparities across race and ethnicity. Racial justice movements challenge us to end systemic racism wherever it arises. Activists and community members should work with policymakers to create more progressive and sustainable tax codes. Doing so will advance social and economic justice for all of us.
More Reading on Taxes and Race
A Tax Code Optimized for White Wealth Leaves Black People Behind, Bloomberg, Dorothy Brown
Closing the racial wealth gap requires heavy, progressive taxation of wealth, Brookings, Vanessa Williamson
Black families pay significantly higher property taxes than white families, new analysis shows, Washington Post, Andrew Van Dam
How Unfair Property Taxes Keep Black Families from Gaining Wealth, Bloomberg, Jason Grotto
More for Less: How Property Tax Fuels Racial Inequity, Tax Notes, Andrew Kahrl
A Progressive Restructuring of All Tax Codes at the Local, State, and Federal Levels to Ensure a Radical and Sustainable Redistribution of Wealth, Movement for Black Lives
U.S. Tax System Needs Anti-Racist Restructuring, Francine J. Lipman, Nicholas A. Mirkay, and Palma Joy Strand
Whitelashing: Black Politicians, Taxes, and Violence, Trevor D. Logan
The Illusion of Race-Neutral Tax Policy, ITEP, Misha Hill, Jenice Robinson, Alan Essig, Meg Wiehe, Steve Wamhoff, and Carl Davis
The Whiteness of Wealth: How the Tax System Impoverishes Black Americans – And How We Can Fix It, Dorothy A. Brown
Advancing Racial Equity With State Tax Policy, Center on Budget and Policy Priorities, Michael Leachman, Michael Mitchell, Nicholas Johnson, and Erica Williams
How the Federal Tax Code Can Better Advance Racial Equity, Center on Budget and Policy Priorities, Chye-Ching Huang and Roderick Taylor
Race, Wealth and Taxes: How the Tax Cuts and Jobs Act Supercharges the Racial Wealth Divide, Prosperity Now and ITEP, Emanuel Nieves, David Newville, Jeremie Greer, and Meg Wiehe
Homes in poor neighborhoods are taxed at roughly twice the rate of those in rich areas, study shows, Washington Post, Christopher Ingraham
States’ Senior Tax Breaks Reinforce Unequal Wealth, Income by Race, Center on Budget and Policy Priorities, Cortney Sanders
Black Homeowners Face Discrimination in Appraisals, New York Times, Debra Kamin
Tax Code Inequities Fuel Call for IRS to Collect Race-Based Data, Bloomberg Tax, Lydia O’Neal and Allyson Versprille
Please send us your ideas for additional articles, reports and books we should include on our recommended reading list!
Acknowledgments
The authors wish to thank Jessica Schieder, Lorena Roque, Matt Salomon, Matt Gardner, and Erika Frankel for their data work that made the analyses in this report possible. Thanks also to Kamolika Das, Aidan Davis, Lisa Christensen Gee, Marco Guzman, and Dylan Grundman O’Neill for research support and to Stephanie Clegg for the report’s layout.
[1] Meg Wiehe, Aidan Davis, Carl Davis, Matt Gardner, Lisa Christensen Gee, and Dylan Grundman, “Who Pays? A Distributional Analysis of the Tax Systems of All 50 States, 6th Edition,” Institute on Taxation and Economic Policy. October 2018. http://whopays.org.
[2] Misha Hill, Jenice Robinson, Alan Essig, Meg Wiehe, Steve Wamhoff, and Carl Davis. “The Illusion of Race-Neutral Tax Policy,” Institute on Taxation and Economic Policy. February 2019. https://itep.org/the-illusion-of-race-neutral-tax-policy/.
[3] U.S. Bureau of Labor Statistics, “Labor Force Statistics from the Current Population Survey.” https://www.bls.gov/cps/demographics.htm#race.
[4] Chuck Collins, Dedrick Asante-Muhammed, Josh Hoxie et al., “The Ever-Growing Gap: Without Change, African-American and Latino Families Won’t Match White Wealth for Centuries,” Institute for Policy Studies. August 2016. https://ips-dc.org/report-ever-growing-gap/.
[5] U.S. Bureau of Labor Statistics, “Table A-2. Employment status of the civilian population by race, sex and age.” January 2021. https://www.bls.gov/news.release/empsit.t02.htm. U.S. Bureau of Labor Statistics, “Table A-3. Employment status of the Hispanic or Latino population by sex and age.” January 2021. https://www.bls.gov/news.release/empsit.t03.htm.
[6] Marianne Bertrand and Sendhil Mullainathan, “Are Emily and Greg More Employable Than Lakisha and Jamal: A Field Experiment on Labor Market Discrimination,” 94(4) American Economic Review, 2004, pp. 991-1013.
[7] Derek Thompson, “The Workforce Is Even More Divided by Race Than You Think,” The Atlantic. November 2013. https://www.theatlantic.com/business/archive/2013/11/the-workforce-is-even-more-divided-by-race-than-you-think/281175/.
[8] Prosperity Now, “Early Childhood Education Enrollment.” https://scorecard.prosperitynow.org/data-by-issue#education/outcome/early-childhood-education-enrollment. The Education Trust, “Young Learners, Missed Opportunities.” https://edtrust.org/early-childhood-tool/.
[9] Prosperity Now, “Four Year College Degree.” https://scorecard.prosperitynow.org/data-by-issue#education/outcome/four-year-college-degree.
[10] Ibid.
[11] Dorothy A. Brown, “The Whiteness of Wealth: How the Tax System Impoverishes Black Americans—And How We Can Fix It.” New York, Crown, 2021.
[12] Tatjana Meschede, Joanna Taylor, Alexis Mann, and Thomas Shapiro, “‘Family Achievements?’: How a College Degree Accumulates Wealth for Whites and Not for Blacks,” Federal Reserve Bank of St. Louis Review, Vol.99(1), 2017, pp. 121-37.
[13] ITEP staff calculations based on 1-year ACS PUMS.
[14] Farah Z. Ahmad and Christian E. Weller, “Reading Between the Data: The Incomplete Story of Asian Americans, Native Hawaiians, and Pacific Islanders,” Center for American Progress, March 2014. https://cdn.americanprogress.org/wp-content/uploads/2014/03/AAPI-report.pdf. Jeff Guo, “The Asian American ‘advantage’ that is actually an illusion,” Washington Post. December 29, 2016. https://www.washingtonpost.com/news/wonk/wp/2016/12/29/the-asian-american-advantage-that-is-actually-an-illusion/.
[15] These data come from the ITEP model and the unit of analysis here is actually a “tax unit,” meaning a person or group of people who file one income tax return or, in the case of non-filers, who could be expected to file one return if they did file. We use the words “household” and “family” to describe these tax units because they are more familiar terms.
[16] Liana Fox, “The Supplemental Poverty Measure: 2019,” U.S. Census Bureau. September 2020. https://www.census.gov/content/dam/Census/library/publications/2020/demo/p60-272.pdf.
[17] Chuck Collins, Dedrick Asante-Muhammed, Josh Hoxie et al., “The Ever-Growing Gap: Without Change, African-American and Latino Families Won’t Match White Wealth for Centuries,” Institute for Policy Studies. August 2016. https://ips-dc.org/report-ever-growing-gap/.
[18] Ibid.
[19] Chuck Collins, Dedrick Asante-Muhammed, Josh Hoxie, and Sabrina Terry, “Dreams Deferred: How Enriching the 1% Widens the Racial Wealth Divide,” Institute for Policy Studies. 2019. https://ips-dc.org/wp-content/uploads/2019/01/IPS_RWD-Report_FINAL-1.15.19.pdf.
[20] Dedrick Asante-Muhammad, “The simplest way to close the racial wealth gap? Direct cash payments,” The Guardian. July 2020. https://www.theguardian.com/commentisfree/2020/jul/12/racial-wealth-gap-black-white-americans.
[21] Chuck Collins, Dedrick Asante-Muhammed, Josh Hoxie et al., “The Ever-Growing Gap: Without Change, African-American and Latino Families Won’t Match White Wealth for Centuries,” Institute for Policy Studies. August 2016. https://ips-dc.org/report-ever-growing-gap/.
[22] Kerwin Kofi Charles and Erik Hurst, “The Transition to Home Ownership and the Black-White Wealth Gap,” 84(2) Review of Economics and Statistics, 2002, pp. 281-297.
[23] “State Data: Homeownership Rate,” Prosperity Now. https://scorecard.prosperitynow.org/data-by-issue#housing/outcome/homeownership-rate.
[24] Marissanne Lewis-Thompson, “Black Business Owners Face An Uphill Battle Securing Bank Loans,” St. Louis Public Radio. January 2020. https://news.stlpublicradio.org/economy-business/2020-01-06/black-business-owners-face-an-uphill-battle-securing-bank-loans.
[25] Chuck Collins, Dedrick Asante-Muhammed, Josh Hoxie et al., “The Ever-Growing Gap: Without Change, African-American and Latino Families Won’t Match White Wealth for Centuries,” Institute for Policy Studies. August 2016. https://ips-dc.org/report-ever-growing-gap/.
[26] Board of Governors of the Federal Reserve System, “Distribution of Household Wealth in the U.S. since 1989.” https://www.federalreserve.gov/releases/z1/dataviz/dfa/distribute/table/#frb-rs-dfa-table;quarter:120;series:Private%20businesses;demographic:race;population:1,3,5,7;units:shares.
[27] Meg Wiehe, Aidan Davis, Carl Davis, Matt Gardner, Lisa Christensen Gee, and Dylan Grundman, “Who Pays? A Distributional Analysis of the Tax Systems of All 50 States, 6th Edition” Institute on Taxation and Economic Policy. October 2018. http://whopays.org.
[28] Michael Leachman, Michael Mitchell, and Nicholas Johnson et al., “Advancing Racial Equity With State Tax Policy,” Center on Budget and Policy Priorities. November 2018. https://www.cbpp.org/research/state-budget-and-tax/advancing-racial-equity-with-state-tax-policy.
[29] ITEP Microsimulation Tax Model. Our method for disaggregating state and local tax incidence by race is explained here: https://itep.org/itep-tax-model/iteps-approach-to-modeling-taxes-by-race-and-ethnicity/.
[30] Christopher Berry, “Reassessing the Property Tax.” February 2021. https://cpb-us-w2.wpmucdn.com/voices.uchicago.edu/dist/6/2330/files/2019/04/Berry-Reassessing-the-Property-Tax-2_7_21.pdf.
[31] Michael Leachman, Michael Mitchell, and Nicholas Johnson et al., “Advancing Racial Equity With State Tax Policy,” Center on Budget and Policy Priorities. November 2018. https://www.cbpp.org/research/state-budget-and-tax/advancing-racial-equity-with-state-tax-policy.
[32] Hannah Thomas, Tatjana Meschede, Alexis Mann, Janet Boguslaw, and Thomas Shapiro, “The Web of Wealth: Resiliency and Opportunity or Driver of Inequality?.” Institute on Assets and Social Policy. July 2014. https://heller.brandeis.edu/iere/pdfs/racial-wealth-equity/leveraging-mobility/web-of-wealth.pdf.
[33] Andre M. Perry, Jonathan Rothwell, and David Harshbarger, “The devaluation of assets in Black neighborhoods: The case of residential property.” Brookings Institution. November 2018. https://www.brookings.edu/research/devaluation-of-assets-in-black-neighborhoods/.
[34] Dorothy A. Brown, “The Whiteness of Wealth: How the Tax System Impoverishes Black Americans—And How We Can Fix It.” New York, Crown, 2021.
[35] EdBuild, “$23 Billion,” Feb. 2019. https://edbuild.org/content/23-billion/full-report.pdf.
[36] Carlos Avenancio-León and Troup Howard, “The Assessment Gap: Racial Inequalities in Property Taxation,” Washington Center for Equitable Growth. June 2020.
[37] Isaac William Martin and Kevin Beck, “Property Tax Limitation and Racial Inequality in Effective Rates,” Critical Sociology, Vol.43(2), 2017, pp. 221-236.
[38] Alana Semuels, “Good School, Rich School; Bad School, Poor School,” The Atlantic. August 2016 https://www.theatlantic.com/business/archive/2016/08/property-taxes-and-unequal-schools/497333/.
[39] Most of the parameters in these examples are calibrated to resemble North Carolina, though the basic forces at work here exist in virtually every state.
[40] Carlos Avenancio-León and Troup Howard, “The Assessment Gap: Racial Inequalities in Property Taxation,” Washington Center for Equitable Growth. June 2020.
[41] Michael Leachman and Samantha Waxman, “State ‘Mansion Taxes’ on Very Expensive Homes,” Center on Budget and Policy Priorities. October 2019. https://www.cbpp.org/research/state-budget-and-tax/state-mansion-taxes-on-very-expensive-homes.
[42] Aidan Davis, “Property Tax Circuit Breakers in 2018,” Institute on Taxation and Economic Policy. September 2018. https://itep.org/property-tax-circuit-breakers-in-2018/.
[43] Hannah Thomas, Tatjana Meschede, Alexis Mann, Janet Boguslaw, and Thomas Shapiro, “The Web of Wealth: Resiliency and Opportunity or Driver of Inequality?.” Institute on Assets and Social Policy. July 2014. https://heller.brandeis.edu/iere/pdfs/racial-wealth-equity/leveraging-mobility/web-of-wealth.pdf.
[44] Dylan Grundman O’Neill and Meg Wiehe, “State Estate and Inheritance Taxes,” Institute on Taxation and Economic Policy. December 2016. https://itep.org/state-estate-and-inheritance-taxes-2/.
[45] The unit of analysis here is actually a “tax unit,” meaning a person or group of people who file one income tax return or, in the case of non-filers, who could be expected to file one return if they did file. We use the words “household” and “family” to describe these tax units because they are more familiar terms.
[46] ITEP Microsimulation Tax Model. Our method for disaggregating state and local tax incidence by race is explained here: https://itep.org/itep-tax-model/iteps-approach-to-modeling-taxes-by-race-and-ethnicity/.
[47] Beverly I. Moran and William Whitford, “A Black Critique of the Internal Revenue Code,” Wisconsin Law Review, 1996, pp. 751-820. Dorothy A. Brown, “The Whiteness of Wealth: How the Tax System Impoverishes Black Americans—And How We Can Fix It.” New York, Crown, 2021.
[48] Marco Guzman, “State Taxation of Capital Gains: The Folly of Tax Cuts & Case for Proactive Reforms,” Institute on Taxation and Economic Policy. September 2020. https://itep.org/state-taxation-of-capital-gains-the-folly-of-tax-cuts-case-for-proactive-reforms/.
[49] Beverly I. Moran and William Whitford, “A Black Critique of the Internal Revenue Code,” Wisconsin Law Review, 1996, pp. 751-820. Sherman D. Hanna, Cong Wang, and Yoonkyung Yuh, “Racial/Ethnic Differences in High Return Investment Ownership: A Decomposition Analaysis,” 21 Journal of Financial Counseling and Planning. 2010.
[50] U.S. Census Bureau, “Wealth, Asset Ownership, & Debt of Households Detailed Tables: 2017.” https://www.census.gov/data/tables/2017/demo/wealth/wealth-asset-ownership.html.
[51] Carl Davis, “State Itemized Deductions: Surveying the Landscape, Exploring Reforms,” Institute on Taxation and Economic Policy. February 2020. https://itep.org/state-itemized-deductions-surveying-the-landscape-exploring-reforms/.
[52] Kerwin Kofi Charles and Erik Hurst, “The Transition to Home Ownership and the Black-White Wealth Gap,” 84(2) Review of Economics and Statistics, 2002, pp. 281-297.
[53] Dorothy Brown, “Shades of the American Dream,” 87 Washington University Law Review, 2009, pp. 329-378.
[54] Dorothy A. Brown, “The Whiteness of Wealth: How the Tax System Impoverishes Black Americans—And How We Can Fix It.” New York, Crown, 2021.
[55] Cortney Sanders, “States’ Senior Tax Breaks Reinforce Unequal Wealth, Income by Race,” Center on Budget and Policy Priorities. August 2019. https://www.cbpp.org/blog/states-senior-tax-breaks-reinforce-unequal-wealth-income-by-race.
[56] Dorothy A. Brown, “The Whiteness of Wealth: How the Tax System Impoverishes Black Americans—And How We Can Fix It.” New York, Crown, 2021.
[57] For the third quarter of 2020, the most recent period with available data as of this writing, 89.5 percent are held by white families, 1.0 percent by Black families, 0.4 percent by Hispanic families, and 9.0 percent by other families. Board of Governors of the Federal Reserve System, “Distribution of Household Wealth in the U.S. since 1989.” https://www.federalreserve.gov/releases/z1/dataviz/dfa/distribute/table/#frb-rs-dfa-table;quarter:120;series:Corporate%20equities%20and%20mutual%20fund%20shares;demographic:race;population:1,3,5,7;units:shares.
[58] Meg Wiehe, “Why Local Jurisdictions’ Heavy Reliance on Fines and Fees Is a Tax Policy Issue,” Institute on Taxation and Economic Policy. September 2019. https://itep.org/why-local-jurisdictions-heavy-reliance-on-fines-and-fees-is-a-tax-policy-issue/.
[59] “Targeted Fines and Fees Against Communities of Color: Civil Rights and Constitutional Implications,” U.S. Commission on Civil Rights. September 2017. https://www.usccr.gov/pubs/docs/Statutory_Enforcement_Report2017.pdf.
[60] Meg Wiehe, “Why Local Jurisdictions’ Heavy Reliance on Fines and Fees Is a Tax Policy Issue,” Institute on Taxation and Economic Policy. September 2019. https://itep.org/why-local-jurisdictions-heavy-reliance-on-fines-and-fees-is-a-tax-policy-issue/.
[61] “Driving while Black and Hispanic: Stops, Fines, Fees, and Unjust Debts,” New York Law School Racial Justice Project. February 2020. http://www.nyls.edu/racial-justice-project/wp-content/uploads/sites/173/2020/02/RJP-drivers-license-suspension-final.pdf.
[62] These tax credit policies are discussed in: Aidan Davis, “State Tax Codes as Poverty Fighting Tools: 2019 Update on Four Key Policies in All 50 States,” Institute on Taxation and Economic Policy, September 2019. https://itep.org/state-tax-codes-as-poverty-fighting-tools/.
[63] In ITEP’s most recent comprehensive 50-state report, Tennessee ranked 6th most regressive while Minnesota ranked 47th. Meg Wiehe, Aidan Davis, Carl Davis, Matt Gardner, Lisa Christensen Gee, and Dylan Grundman, “Who Pays? A Distributional Analysis of the Tax Systems of All 50 States, 6th Edition” Institute on Taxation and Economic Policy. October 2018. http://whopays.org.
[64] Our method for disaggregating state and local tax incidence by race is explained here: https://itep.org/itep-tax-model/iteps-approach-to-modeling-taxes-by-race-and-ethnicity/.
[65] Leona Thao, “Redefining Wealth Through Communal & Cultural Assets,” Coalition of Asian American Leaders, 2020. https://caalmn.org/wp-content/uploads/2020/12/CAAL-Redefining-Wealth-Digi.pdf.
[66] Carlos Avenancio-León and Troup Howard, “The Assessment Gap: Racial Inequalities in Property Taxation,” Washington Center for Equitable Growth. June 2020.
[67] Ana Hernández Kent, “Examining U.S. Economic Racial Inequality by State,” Federal Reserve Bank of St. Louis, August 2020. https://www.stlouisfed.org/publications/bridges/volume-3-2020/examining-us-economic-racial-inequality-by-state.
[68] Samuel L. Myers Jr., “The Minnesota Paradox,” Roy Wilkins Center for Human Relations and Social Justice. https://www.hhh.umn.edu/research-centers/roy-wilkins-center-human-relations-and-social-justice/minnesota-paradox.
[69] Office of Governor Walz & Lt. Governor Flanagan, “Minnesota’s COVID-19 Recovery Budget: Revenue Changes.” 2021. https://mn.gov/governor/assets/2021%20Fact%20Sheet_Revenue_final_tcm1055-466468.pdf.
[70] Mel Hanson, “U.S. Public Education Spending Statistics,” Educationdata.org. Accessed March 2020. https://educationdata.org/public-education-spending-statistics.
[71] John S Kiernan, “State Uninsured Rates,” WalletHub. October 2020. https://wallethub.com/edu/uninsured-rates-by-state/4800.
[72] Ibid.
[73] Palma Joy Strand and Nicholas A. Mirkay, “Racialized Tax Inequity: Wealth, Racism, and the U.S. System of Taxation,” 15 Northwestern Journal of Law and Social Policy 265, University of Hawai’i Richardson School of Law Research Paper No. 3442674. August 2019. http://dx.doi.org/10.2139/ssrn.3442674.
[74] Kansas Center for Economic Growth, “Kansas’ Tax Plan Makes Racial Economic Disparities Worse.” 2016.
[75] Palma Joy Strand and Nicholas A. Mirkay, “Racialized Tax Inequity: Wealth, Racism, and the U.S. System of Taxation,” 15 Northwestern Journal of Law and Social Policy 265, University of Hawai’i Richardson School of Law Research Paper No. 3442674. August 2019. http://dx.doi.org/10.2139/ssrn.3442674.
[76] “Broken Treaties,” The African American Policy Forum. https://aapf.org/broken-treaties/.
[77] Chuck Collins, Dedrick Asante-Muhammed, Josh Hoxie et al., “The Ever-Growing Gap: Without Change, African-American and Latino Families Won’t Match White Wealth for Centuries,” Institute for Policy Studies. August 2016. https://ips-dc.org/report-ever-growing-gap/.
[78] National Congress of American Indians, “Examples of Tribal Tax Codes, Tax Agreements & Other Resources,” Accessed September 2020. http://www.ncai.org/initiatives/partnerships-initiatives/ncai-tax-initiative/examples-of-tribal-tax-codes-tax-agreements-other-resources.
[79] Heather Cahoon. “Revenue Competitions between Sovereigns: State and Tribal Taxation in Montana,” American Indian Culture and Research Journal, 42, 2018, pp. 17-39.
[80] “Policy Basics: Taxes in Indian Country Part 2: Tribal Governments,” Montana Budget and Policy Center. November 2017. https://mbadmin.jaunt.cloud/wp-content/uploads/2017/11/Taxes-in-Indian-Country-Tribal-Governments.pdf.
[81] “Policy Basics: Taxes in Indian Country Part 1: Individual Tribal Members,” Montana Budget and Policy Center. July 2017. https://montanabudget.org/report/policy-basics-taxes-in-indian-country-part-1-individual-tribal-members.
[82] F. Michael Willis, “The Power to Tax Economic Activity in Indian Country,” Natural resources & Environment, Vol. 28, No.4, Spring 2014. https://www.americanbar.org/publications/natural_resources_environment/2013-14/spring/the_power_tax_economic_activity_indian_country.html.
[83] Matthew Gardner et al., ”3 Percent and Dropping,” Institute on Taxation and Economic Policy. April 2017. https://itep.org/3-percent-and-dropping-state-corporate-tax-avoidance-in-the-fortune-500-2008-to-2015/. Richard Phillips and Nathan Proctor, “A Simple Fix for a $17 Billion Loophole: How States Can Reclaim Revenue Lost to Tax Havens,” Institute on Taxation and Economic Policy and U.S. PIRG. January 2019. https://itep.org/a-simple-fix-for-a-17-billion-loophole/. Michael Mazerov, “Legislators: Don’t Feel Guilty about Taxing GILTI,” Center on Budget and Policy Priorities. November 2018. https://www.ncsl.org/Portals/1/Documents/Taskforces/GILTI.pdf.
[84] Carl Davis, “State Itemized Deductions: Surveying the Landscape, Exploring Reforms,” Institute on Taxation and Economic Policy, February 2020. https://itep.org/state-itemized-deductions-surveying-the-landscape-exploring-reforms/. Marco Guzman, “State Taxation of Capital Gains: The Folly of Tax Cuts & Case for Proactive Reforms,” Institute on Taxation and Economic Policy, September 2020. https://itep.org/state-taxation-of-capital-gains-the-folly-of-tax-cuts-case-for-proactive-reforms/. “How States Should Respond to the Federal Tax Cuts for ‘Pass-Through’ Business Income,” Center on Budget and Policy Priorities. March 2018. https://www.cbpp.org/research/state-budget-and-tax/how-states-should-respond-to-the-federal-tax-cuts-for-pass-through.
[85] Michael Leachman and Samantha Waxman, “State ’Mansion Taxes’ on Very Expensive Homes,” Center on Budget and Policy Priorities. October 2019. https://www.cbpp.org/research/state-budget-and-tax/state-mansion-taxes-on-very-expensive-homes.
[86] Elizabeth McNichol, “State Taxes on Inherited Wealth,” Center on Budget and Policy Priorities. September 2019. https://www.cbpp.org/research/state-budget-and-tax/state-taxes-on-inherited-wealth.
[87] Aidan Davis, “Boosting Incomes and Improving Tax Equity with State Earned Income Tax Credits in 2020,” Institute on Taxation and Economic Policy. September 2020. https://itep.org/boosting-incomes-and-improving-tax-equity-with-state-earned-income-tax-credits-in-2020/.
[88] Chye-Ching Huang and Roderick Taylor, “How the Federal Tax Code Can Better Advance Racial Equity,” Center on Budget and Policy Priorities. July 2019. https://www.cbpp.org/research/federal-tax/how-the-federal-tax-code-can-better-advance-racial-equity.
[89] Aidan Davis, “Property Tax Circuit Breakers in 2018,” Institute on Taxation and Economic Policy, September 2018. https://itep.org/property-tax-circuit-breakers-in-2018/.
[90] Danilo Trisi and Ife Floyd, “Benefits of Expanding Child Tax Credit Outweigh Small Employment Effects,” Center on Budget and Policy Priorities. March 2021. https://www.cbpp.org/research/federal-tax/benefits-of-expanding-child-tax-credit-outweigh-small-employment-effects.