The Impact of Work From Home on Commercial Property Values and the Property Tax in U.S. Cities
reportExecutive Summary
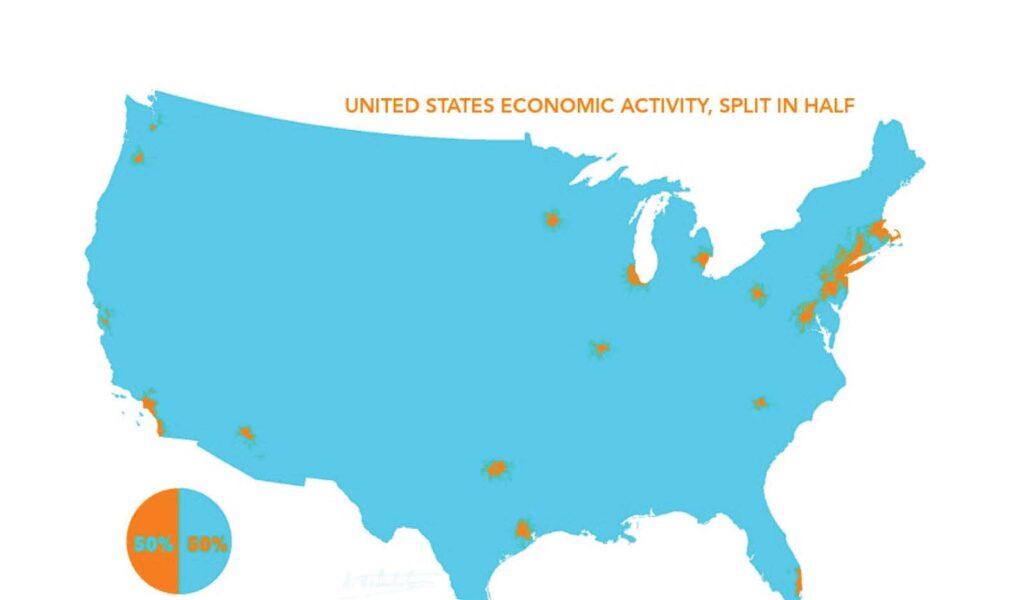
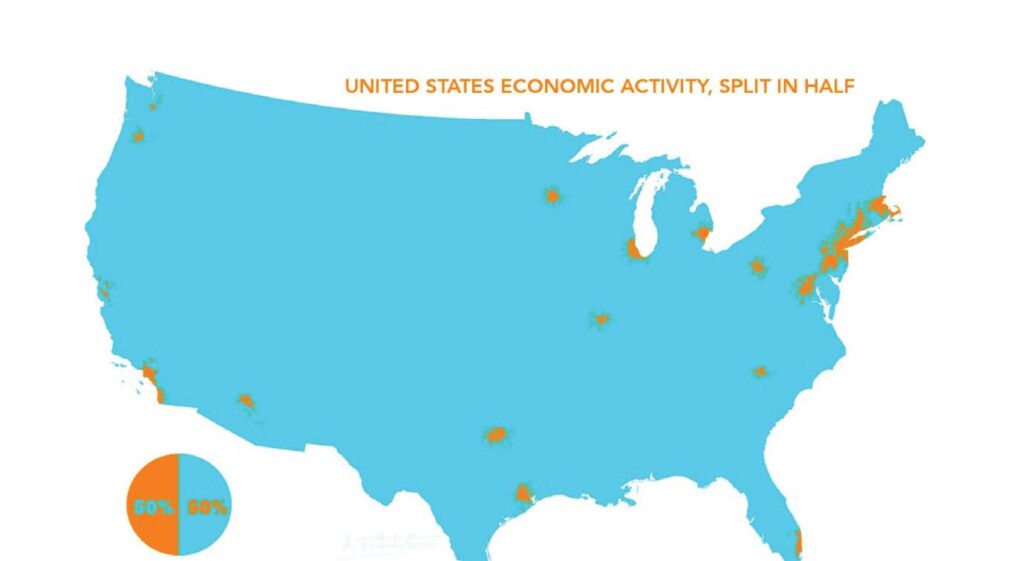
A small number of large core cities and their larger metro areas account for fully half of all economic output in the U.S. (see the picture below for 2013) For cities to continue to play this vital role, they must be both economically robust and fiscally healthy, with revenues sufficient to provide the essential services that businesses and residents rely on, and financed by competitive tax rates. The stakes are high, as lasting change in the economic fortunes of big cities cores poses a long-term threat to the economy.
By combining data on employment, earnings, and city fiscal structure with estimates of the potential decline in commercial real estate values, this research helps to pull back the curtain on the black box of the pandemic threat to cities and their finances.
The COVID-19 recession and the increase in work from home (WFH) catapulted by the pandemic pose major risks for commercial real estate and for the revenues derived from commercial real estate. In the 8 cities in this study – Atlanta GA, Austin TX, Charlotte NC, Chicago IL, Los Angeles CA, Miami FL, New York NY and San Francisco CA – commercial real estate accounts for an average of 37% of property taxes, ranging from 26% in LA to 56% in Atlanta. In key central city industry groups – information, finance, professional, scientific and technical, and management – a high proportion of jobs, up to 80% in one estimate, can be performed away from the office, and these industries comprise a large share of total wages paid – 41% on average, and more than 60% in NYC. Even with a strong economic revival, if elevated levels of WFH persist, we estimate that demand for space, and prices for commercial real estate, will fall by between 12% and 25%, eventually leading to proportional declines in assessed values and ultimately the amount of property taxes paid by owners (directly) and renters (indirectly) of commercial real estate. Though magnitudes vary somewhat across cities, all face significant fiscal risks.
Based on data from the Bureau of Labor Statistics Quarterly Census of Employment and Wages (QCEW) we track employment changes in 2020 by city and industry, and use this information to estimate the direct effect of the COVID-19 recession on the demand for commercial space. Assuming no change in space per worker, we estimate that employment effects alone will cause the value of commercial real estate to fall by an average of 6%, ranging from 1% in Austin to 13% in San Francisco. Price reductions from a decrease in space per worker are much more uncertain. We estimate lower bound (two days or less of WFH) and upper bound (three or more days of WFH) averages of 12% and 25%. Our lower bound reductions from a decline in SPW are comparable to those from commercial real estate experts, while our upper bound estimates are substantially higher. Combining employment effects with decreases resulting from reduced space per worker, New York and San Francisco are the most vulnerable of the 8 cities, with predicted commercial price drops ranging from 25% to 43%. Declines are smaller, but still significant, in the other cities. Valuation changes predicted by our analyses are also broadly consistent with observed price changes in several publicly traded portfolios of commercial real estate assets.
Comparing our results for NYC to the roughly 25 percent decline in the value of office buildings in Manhattan for assessment purposes, as estimated by the NYC Dept of Finance for 2022, our results suggest that roughly two-thirds of the decline is due to the emptying out of Manhattan office districts due to increased WFH. As more commercial property leases expire, our estimates suggest that, unless there is a very large employment rebound, commercial property values will continue to fall in NYC for at least the next few years.
Using a specially developed comprehensive database on city finance, we translate the decline in property values in the commercial sector into effects on the property tax and overall city revenues. The overall effect depends on the extent of the decrease in commercial property values, the share of CI property in the property tax base, and the share of revenues derived from the property tax. Timing depends on how fast reductions in market value are reflected in assessed values, and the ability to offset losses by raising property tax rates on all properties.
Because the larger cities in our sample have more diversified revenue structures, while smaller cities like Austin and Miami are more dependent on the property tax, overall revenue effects are more even across cities than commercial property tax effects alone. Due to its high share of CI property in the property tax base and its relative dependence on the property tax, Atlanta has the largest revenue effect (-5.7%). Despite its strong economy, Austin, with 50% of all revenues from the property tax, faces revenue losses between 2% and 4%, similar to the forecasts for New York and San Francisco. Diversified revenue structures, with a major role for state aid, and in NYC’s case the local personal income tax, partially insulate both NYC and SF from the pandemic fiscal shock. By contrast, cities in Texas and Florida, where state aid is low and property tax shares are high, will need to reevaluate their fundamental fiscal stance, which is based on no state income taxes.
The cost of city services typically rises by several percentage points each year. Our estimates of the revenue deficit, as compared to previous years, are between 5% and 7%, exceeding 8% in Austin, NYC, and SF. Temporarily backstopped by federal fiscal relief, we expect the fiscal stress from these reductions to grow as federal funds to cities and states under the CARES Act and the American Rescue Plan phase out from 2022 to 2024.
Acknowledgments
This research was commissioned by the Communications Workers of America. We thank Nell Geiser, Director of Research, Communications Workers of America, and Amy Hanauer, Executive Director, Institute on Taxation and Economic Policy (ITEP), for guidance on this project. We would also like to thank Lisa Christensen Gee, David Crawford, Madison Burns, Devin Douglass and Sydnee Galusha, all of ITEP, for assistance in data collection.
We thank Don Liebman, Attorney at Tuchman Korngold Weiss and Liebman, Philip Pitruzzello, Real Estate Professional based in NYC, Peter Riguardi, Chairman and President, New York Region, Real Estate Licensed Broker, Jones Lang LaSalle Brokerage, Inc., and Phoebe Holtzman, Senior Director of Research for the New York/Tri-State Region, Jones Lang LaSalle Brokerage Inc., and Barbara Denham for sharing their insights on commercial real estate markets in NYC. We would also like to thank Carmela Quintos, NYC Dept of Finance, for help in understanding NYC’s assessments of Commercial and Industrial property, Steven Malpezzi, for a helpful overview of the economics of commercial real estate, and Andrew Reschovsky and Cordelia Reimers for comments on earlier drafts. We are grateful to Tim Gage, Jennifer Ito, and Lenny Goldberg for providing us with data on assessed value shares of commercial and industrial property in California.
Howard Chernick: Emeritus Professor, Department of Economics, Hunter College and the Graduate Center, City University of New York. Email: [email protected]
David Copeland: Adjunct Lecturer, Department of Economics, Hunter College, City University of New York. Email: [email protected]
David Merriman: Interim Dean College of Urban Planning and Public Affairs, University of Illinois Chicago and Stukel Presidential Professor, Dept. of Pub. Admin. Illinois. Email: [email protected]
Contents
-
- Introduction
- Literature Review
- Logic Chain Underlying Analysis
- The Economic Effects of COVID-19 in Eight Cities
- The Effect of WFH on Commercial Property Values
- Fiscal Impacts
- Conclusions
- Appendix 1: Methodology for Estimating the Change in the Price of Commercial Real Estate
- Appendix 2: Methodology for Estimating Fiscal Effects on Cities
- Appendix 3: The Effect of WFH on Sales Taxes and Residential Property Taxes
- References
Introduction
The COVID-19 recession and the accompanying increase in work-from-home (WFH) have the potential to severely impact the finances of cities, by reducing the demand for commercial real estate and the property tax revenues that depend on a robust commercial sector. The fiscal implications of a decline in commercial property values are important because the property tax is the dominant local source of taxes, and commercial property makes up a significant portion of the property base in cities.
In this report, we examine the potential fiscal impact of the recession and the increase in WFH, using a sample of 8 U.S. cities, chosen for their size, geographic variation, and economic growth patterns. The 8 cities are Los Angeles, San Francisco, Atlanta, Chicago, Miami, New York, Charlotte NC, and Austin TX.[1]
If WFH proves to be long-lasting, there could be additional fiscal pressure from a decline in the price of residential properties in central cities, as the increase in remote work reduces demand for city, in favor of suburban or exurban locations.[2] Local sales tax revenues may also be negatively affected, as the location of taxable consumption shifts from central business districts to residential neighborhoods outside of the city’s political boundaries. Though not the primary focus of this report, our analysis includes rough estimates of the fiscal effects of reduced taxable sales and lower residential housing prices.
While the increase in WFH has been well documented, the degree of persistence is linked both to the end of the pandemic and the post-COVID adaptations of firms and employees.[3] We draw on basic economic theory, existing academic literature, and consultations with commercial real estate professionals, to place plausible lower and upper bounds on the long-run increase in WFH and the effect on commercial real estate values. To link the commercial property sector to the property tax, we assemble data from individual city assessor’s offices that includes the market and assessed value of commercial and industrial (CI) property, the effective property tax rate on CI property, and the CI share of each city’s total property tax base. To estimate fiscal impacts, the CI data are merged with a unique fiscal database for cities called the Fiscally Standardized City (FiSC) (Chernick et al, 2015) that takes into account all spending and revenues raised on behalf of city residents.
Because reassessment typically lags changes in market value, in most cities a reduction in market value leads to reduced property tax revenues only after several years. Moreover, cities are typically able to offset a portion of any reduction in the tax base by adjusting tax rates.
Both factors help to promote stability in property tax revenues. However, in the aftermath of the COVID-19 shock, generous federal fiscal relief under the American Rescue Plan has given cities a few years of fiscal breathing room to avoid budget cuts, even as they are collecting lower property taxes.
The fiscal effect of the increase in remote work depends both on the city’s industrial mix and on the city’s fiscal structure. The greater the concentration of employment in industries with high WFH potential, the greater the potential reduction in commercial property values. The greater the reliance on the property tax, and in particular the non-residential segment of the property tax base, the greater the fiscal risk. Cities that rely more heavily on alternative taxes, such as NYC’s local income tax, or on intergovernmental aid, are less vulnerable. The results stand in dramatic contradiction to the conventional wisdom that the property tax is the most stable of all city revenue sources, and that cities that rely more heavily on the property tax are likely to have more stable revenues over time. (Chernick, Copeland, and Reschovsky, 2020)[4]
The paper has 6 sections. The first section reviews the literature on the potential effect of the COVID-19 recession on the demand for central city commercial property. Section two presents a flow chart that outlines the steps in our modeling of the effect of the pandemic and the increase in WFH on city finances. The third section compares the economic impact of the COVID-19 recession across cities, based on employment and wage data from the U.S. Bureau of Labor Statistics Quarterly Census of Employment and Wages (QCEW). In the fourth section, we develop lower and upper bound scenarios for the impact of WFH on commercial real estate values. To validate our forecasts, we also examine the financial performance of commercial real estate, as expressed in the share prices for various types of Real Estate Investment Trusts (REITS). In the fifth section we link our commercial price scenarios to the potential effects on revenues from the property tax revenues, and relative to total city revenues. The final section summarizes results, discusses some caveats, and presents a brief discussion of policy implications. Technical details are described in three appendixes.
Literature Review
Much of the academic literature supports the idea that the increase in WFH will be substantial and long-lasting. Based on data from the Survey of Working Arrangements and Attitudes, Barrero et al (2021) project that U.S. workers will supply about 20 percent of full workdays from home in the post-pandemic economy, four times the pre-COVID level. They find that the preference for WFH at least part of the week is pervasive across groups defined by age, education, gender, earnings, and family circumstances, and that workers are prepared to accept sizeable wage cuts in exchange for the option of working from home several days a week.[5] Their review of plans suggests that the extent of WFH will rise sharply with education and earnings in the post-pandemic economy, and that employer preferences dovetail more closely with worker desires at the upper end of the wage distribution. Lower down the earnings distribution, there is more potential conflict between worker preferences for WFH and employer preferences for on-site work.
Based on survey responses, Barrero et al argue that WFH will stick because it improves firm productivity, due mainly to time saved in commuting.[6] However, Barrero et al also recognize that long-term effects on productivity may be overestimated, if workers actually put in more hours working from home than they report or firms lose the external benefits that result from collaboration and interaction at the work site.[7][8]
Dingel and Neiman (2020) use surveys describing the typical experience of US workers in nearly 1,000 occupations to classify each occupation as able or unable to be done from home. They find that 37 percent of jobs in the United States can be performed entirely at home, with significant variation across cities and industries. These jobs typically pay more than jobs that cannot be done at home and account for 46 percent of all US wages. They point out that their classification is an upper bound, as it does not rule out job characteristics that would merely make working from home difficult, such as teaching, and greatly exceeds the share of jobs that have actually been performed entirely at home in recent years.
Another approach to study the effect of COVID-19 on cities is to look at commercial rents by location.[9] Rosenthal et al (2021), using data from 55,000 commercial leases signed between 2019 and 2020, find that, while after the initial COVID-19 shock businesses continue to pay premiums for density and its correlates, there is a clear reduction in the value of density, particularly in cities that rely extensively on mass transit, as opposed to what they call ‘car cities’. Among car cities, rent patterns are largely the same as pre-COVID. Among the six rapid transit cities (NYC, Washington DC, Chicago, Boston, San Francisco, LA, and Philadelphia) central city commercial rents have fallen relative to rents in the suburbs prior to COVID-19.[10] Companies also place less value on locations within one-half mile of a transit station. Rosenthal et al conclude that COVID-19 does weaken city centers, but they still remain attractive, and the weakening is only in the largest and most dense cities.
Wang, C. and T. Zhou (2020) treat the COVID-19 pandemic as an exogenous shock that will have differential effects on the financial performance of firms, depending on the extent to which they rely on face-to-face interactions. Based on a sample of 32,000 properties owned by equity REITs, they find that face-to-face measures have weakened in terms of effect on long-term investment outcomes, and argue that this weakening is consistent with the view that the pandemic shock will prove to be transient in nature.
Althoff et al (2020) find that the share of employment in 4 key industries – Information, Finance and Insurance, Professional Services, and Management of Companies and Enterprises – is the strongest variable in explaining the proportion of work that can be done at home. Because these proportions are highest in dense cities, they argue that the denser the city, the more vulnerable it is to the pandemic shock. At the same time, the cost of increased WFH by skilled workers will be borne most heavily by low-wage workers in the denser cities, as demand for their services plummets.[11][12]
Logic Chain Underlying Analysis
FIGURE 1
Flow Chart of the Conceptual Model
Abbreviations: C&I: commercial and industrial; MV: market value; AV: assessed value
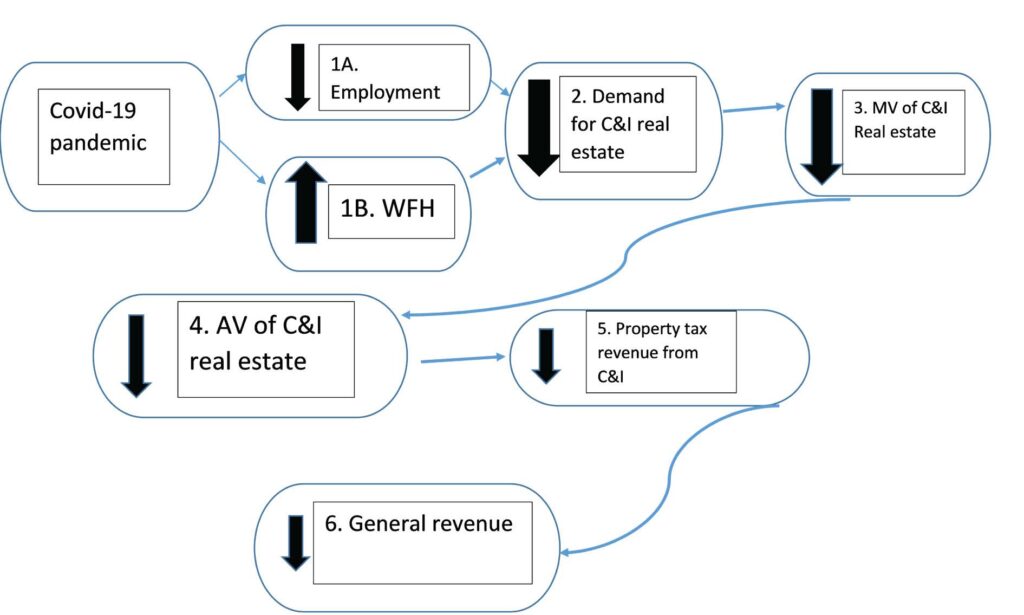
Figure 1 depicts the logic chain that we use to model the impact of the COVID-19 pandemic on local government revenues. While there is great uncertainty about the magnitude and timing of several steps in the chain and therefore about the ultimate fiscal impact of the pandemic, our analysis represents our best judgment based on theory, consultation with industry experts and quantitative data.
The pandemic had two relevant major impacts: it greatly reduced employment in some cities and industries and it was associated with a very large increase in WFH in many areas. The first step in the chain is both a decline in employment and an increase in WFH. Employment fell dramatically in the early days of the pandemic but gradually recovered in many industries and cities (see section III). If employment does not fully recover over the long term, employers will need less C&I real estate even if WFH diminishes to pre-pandemic levels. On the other hand, robust employment growth could offset the effect of a permanent increase in WFH. We have extensive data comparing employment levels pre-COVID (2019) through the end of 2020, by industry and city.
WFH data is much less complete, but the literature, as discussed in Section 1, suggests not only that it increased substantially in many workplaces and industries, but that the increases will persist. Though many employers transitioned to business processes that are compatible with WFH, there is great uncertainty about the extent to which WFH will persist once the health threats from COVID-19 diminish. If WFH does persist, because C&I real estate is very durable and often difficult to convert to other (e.g., residential) uses, over time the decline in demand for commercial office space is likely to lead to significant reductions in the market value (MV) of existing C&I real estate. (Step 3)
Most states require that property tax assessments are related to the market value of real estate. Thus, over time C&I assessed values (AV) will reflect diminished market values. The exact timing of reductions in assessments will reflect a city’s normal assessment cycle and any proactive attempts to reduce property tax burdens on commercial property, for example by speeding up either the reassessment of commercial property or the appeal process for property owners seeking lower assessments based on lower market values. (Step 4)
Reductions in assessments are likely to result in reductions in property tax revenues. (Step 5). While elected officials could conceivably raise property tax rates to compensate for lower C&I assessments, in most cities C&I property tax rates must, by law, be equal to residential property tax rates. Thus, an increase in property tax rates could lead to fierce political opposition. Even if local officials have the freedom to set C&I property tax rates independently of residential property tax rates, we would expect significant political opposition if higher rates were imposed on real estate owners who had recently experienced significant reductions in the market value of their assets.
The final step (#6) in our logic chain is the relationship between reductions in property tax revenue from C&I real estate and reductions in the general revenue of local governments. If local governments are unable to increase other own-source revenues (such as sales taxes) and state governments do not increase intergovernmental aid, a reduction in C&I property tax revenues will result in a reduction in the general revenue of local governments. While timing is uncertain, this is a reasonable base case. States often give local governments very limited discretion with regard to increasing other taxes, by raising rates or expanding the base), so using other tax sources to compensate for reductions in property tax revenue may not be legally or politically feasible.[13] Fiscal relief from states and the federal government provides one possible way to compensate local governments for losses in property tax revenues. Our estimates can be thought of as measuring the necessary magnitude of such increases.
The Economic Effects of COVID-19 in Eight Cities
The best available data for understanding the economic impact of the COVID-19 recession come from the U.S. Bureau of Labor Quarterly Census of Employment and Wages (QCEW). The Census provides county-based information on monthly employment, and weekly wages (averaged by quarter), by detailed industry sector. The latest data is for the fourth quarter of 2020. Workers in the QCEW are those covered by State unemployment insurance and Federal workers covered by the Unemployment Compensation for Federal Employees program.
To examine monthly changes in employment and wages through the first year of the pandemic, for each of our cities we create an index that sets initial levels of both measures at 1.0 in the first month (for employment) or first quarter (for average wages) of 2020, and shows the deviation through December 2020 or the 4th quarter averages. We show these changes across all industry sectors (Fig. 2), for the accommodation and food services sector (Fig. 3), and for the Professional, Scientific, and Technical Services sector (Fig.4). The patterns in the three graphs will help to inform our analysis of the decline in demand for commercial space, as discussed in Section IV.
FIGURE 2
Monthly Changes in Employment and Wages in 2020 – All Industries
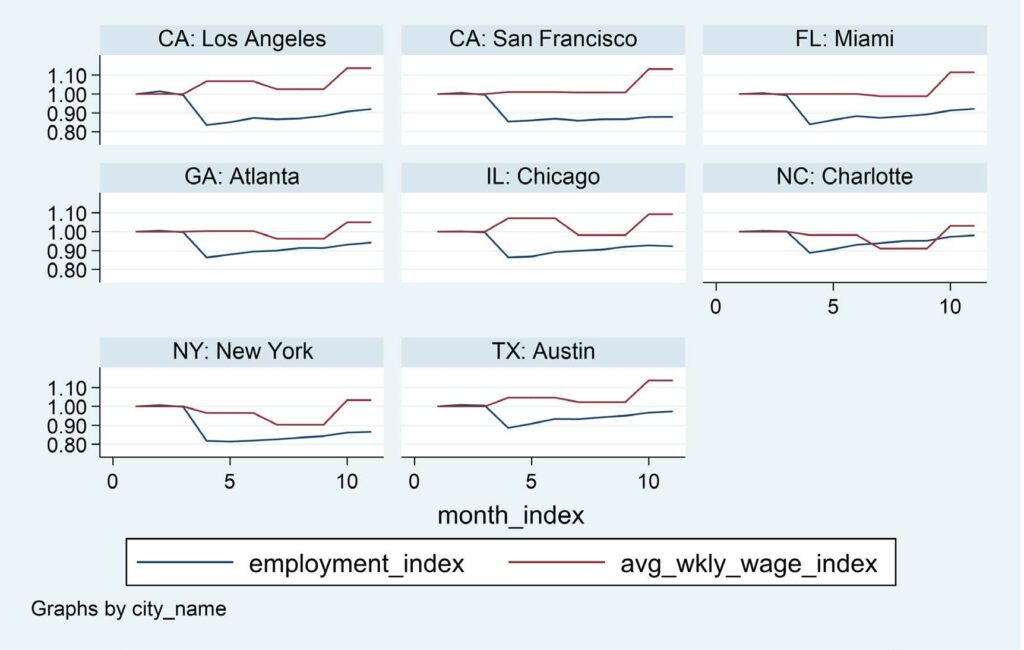
Figure 2 shows that in all cities except Charlotte employment fell more sharply than wages. Though magnitudes varied, in all cities employment fell sharply from March to April, then stayed constant or showed a slight increase for the rest of the year. Except for Charlotte and Austin, employment at the end of 2020 was still 10 percent or more below January levels. Average wages fell in NYC and Charlotte, but were approximately unchanged through September in the other six cities. In October all cities experienced wage increases relative to prior month levels, surpassing initial levels.
FIGURE 3
Monthly Changes in Employment and Wages in 2020 – Accommodation and Food Services
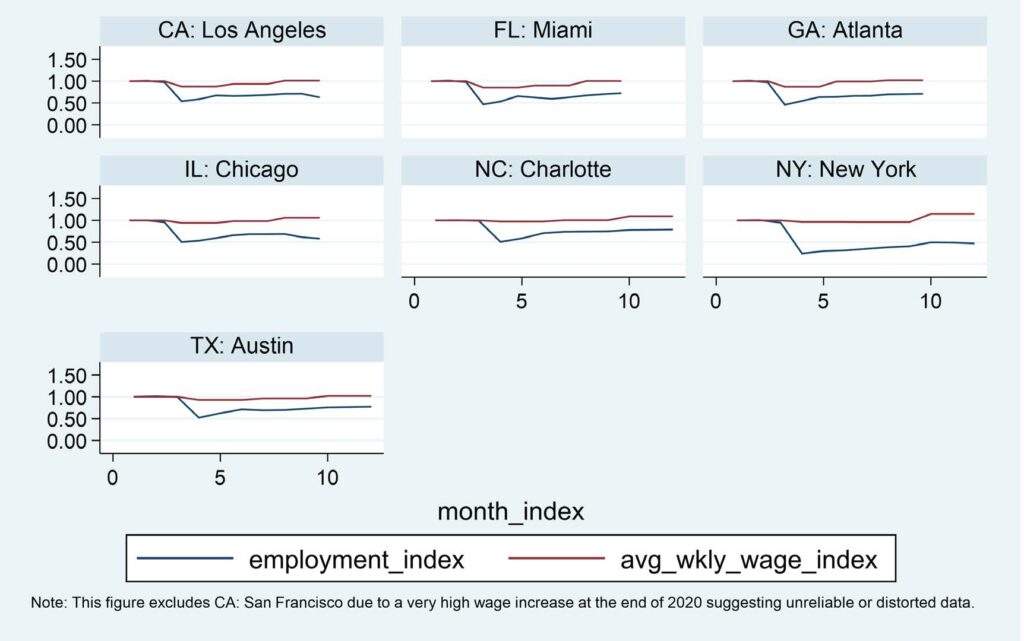
Figure 3 shows the path of employment and wages in 2020 in the Accommodation and Food Services sector (NAICS code 72) a sector that provided 10% of jobs in 2019, but with relatively low wages. The graphs highlight the employment shock from the pandemic and the lock-down, with a decline in employment more than twice as high as the overall decline in employment. New York, Chicago, and Los Angeles were particularly hard-hit, with declines of approximately 50%. Average wages in this sector were flat through 2020.
FIGURE 4
Monthly Changes in Employment and Wages in 2020 – Professional, Scientific, and Technical Services
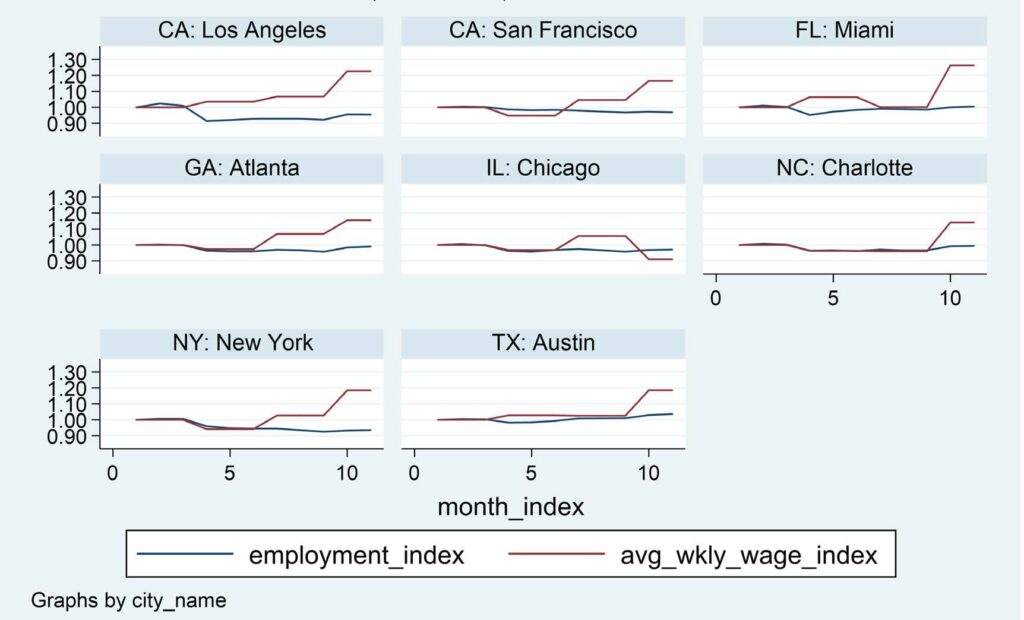
Figure 4 shows the high-wage Professional, Scientific, and Technical sector. In this sector, which comprised an average of 17% of total wages in our sample cities, the pattern is one of substantial wage increases in the last quarter of 2020 in all cities except Chicago. Employment declined in April, then recovered to initial levels in Miami, Atlanta, and Charlotte, while rising above initial levels in Austin in September. Though there are differences across cities, the general pattern in this sector – employment relatively flat, but wages increasing substantially – is reflective of the K-shaped nature of the COVID-19 recession, with compensation in high wage sectors increasing sharply despite the overall severity of the national recession. The implications of these wage-employment patterns are discussed in the next section.
The Effect of WFH on Commercial Property Values
Model
The effect of the pandemic on commercial real estate prices reflects both the severity of the recession-induced change in demand, which had a particularly strong effect on retail establishments and hotels, and the potential change in space per worker (SPW) that results from the increase in WFH.
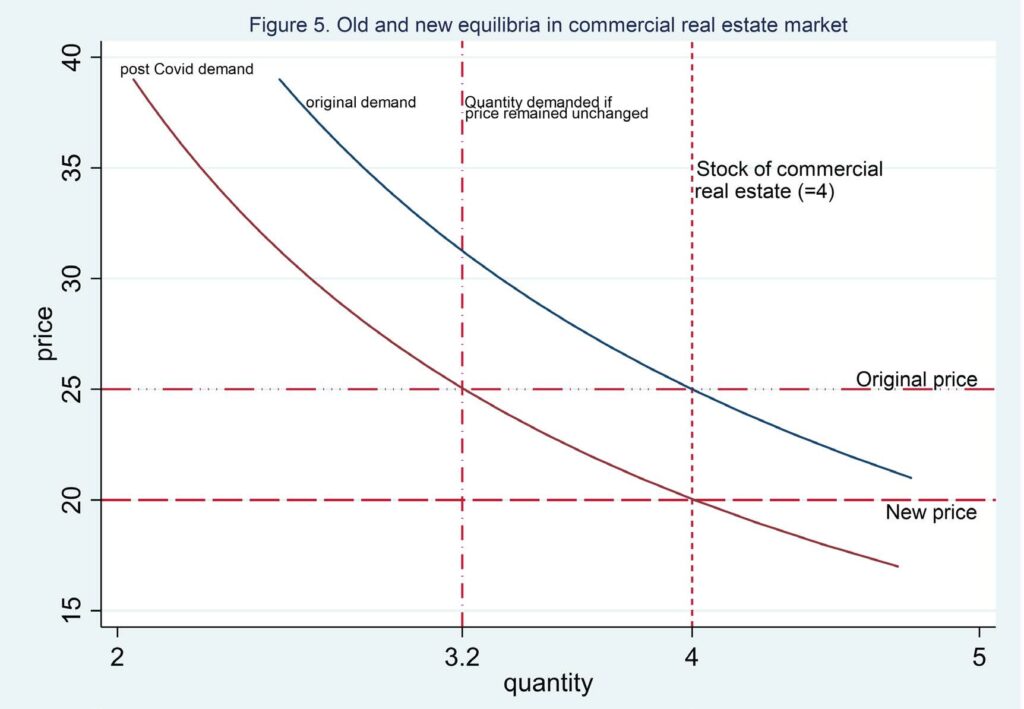
The most prominent feature of the stock of commercial buildings is its durability. Additions to the overall supply comprise less than one percent of the total stock in any year. This durability is represented by the inelastic (vertical) line for supply in Figure 5. Inelastic supply implies that the COVID-induced change in price per square foot for commercial space depends primarily on the change in demand.[14][15]
Figure 5 represents the stock of commercial real estate solely along the quantity dimension. In practice, it is important to recognize the heterogeneity of the stock. As emphasized by Peter Riguardi and Phoebe Holtzman of Jones Lang Lasalle Brokerage, Inc., declines are likely to be greater for older and lower valued commercial space (Class B and C office buildings) than for new or recently renovated buildings.[16][17] Buildings in the middle of blocks may also be more at risk than those at corners. Preliminary evidence for the heterogeneity of effects comes from data on new leases compiled by JLL Brokerage, Inc., and from NYC’s initial 2022 assessment roll. The assessment roll shows a 10% decline for so-called ‘trophy’ properties, a 16.5 % decline for Class B, an 18.5 % decline in the market value of Class C properties, and a 19.5% decline for all other office properties.[18]
FIGURE 5
Old and New Equilibria in Commercial Real Estate Market
Forecasts of the Effect of WFH on Commercial Real Estate Prices
Our forecasted changes in the price of commercial real estate are summarized in Table 1. The results are also shown graphically in Figure 6, with the blue bar corresponding to column 2 of Table 1, the red bar to column 4, and the green bar to Column 6. Appendix 1 provides a detailed description of the methodology and assumptions used to predict changes in the price of commercial real estate.
Table 1. Simulated Percentage Change in Price of Commercial Real Estate: 8 Cities.*
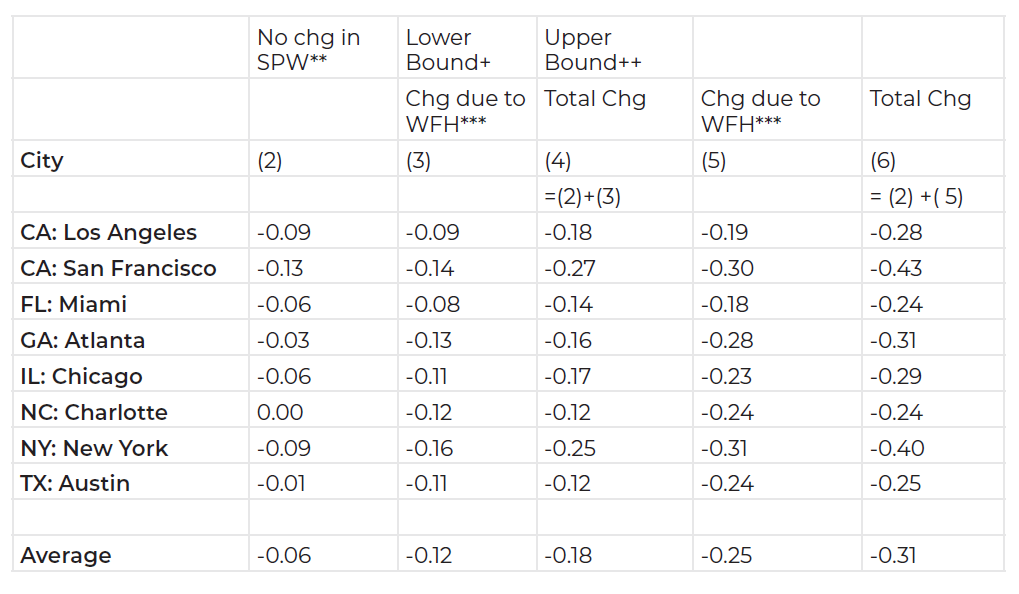
*Industry Weight equals (Employment x Average Wage)
**Employment Related Effect on Demand for Commercial Real Estate (Dec. 2019-Dec. 2020)
*** Effect on CI price of reduced Space Per Worker due to increase in Work From Home.
+ Assumes WFH less than 2 days per week in industries where WFH is feasible (Dingel and Naiman, 2020)
++ Assumes WFH more than 3 days per week in industries where WFH is feasible (Dingel and Naiman, 2020)
Column 2 of Table 1 summarizes the effect on commercial real estate prices from the decrease in employment (weighted by pre-COVID average wages) between December 2019 and December 2020, assuming no change in space per worker. The average decrease in prices is 6% decrease. Atlanta, Charlotte, and Austin show small or negligible effects, while NYC, LA, and San Francisco, harder hit by the COVID recession, show declines of 9%, or more.
The changes in NYC, LA, and San Francisco reflect both the overall decline shown in Figure 2, and the decrease in employment in the high wage sectors in NY and San Francisco.
Column 3 shows the decline in price under our lower bound assumptions for the change in SPW, assuming zero employment effect. The decline in price is substantial in all 8 cities, with an average reduction of 12 percent, and a range from 8% in Miami to 16% in NYC. Adding the lower bound space decrease to the employment effect (column 4), the average decline in market value is 18%, exceeding 12% in all 8 cities, and reaching 25% in NYC, and 27% in San Francisco. Columns (5) and (6) replicate columns (3) and (4), using our upper bound assumptions for the change in SPW. The upper bound assumptions on space reduction (column 5) imply an average price reduction of 25%, ranging from 18% in Miami to 31% in NYC. The total change, including both employment effects and decreases in SPW, averages 31% under the upper bound assumptions, and exceeds 40% in NY and San Francisco.
The difference in vulnerability of commercial real estate across cities is due largely to differences in the concentration of employment and wages in industries that are at risk for large increases in WFH. The average share of wages in the Information, Finance, Professional, and Management sectors in Q4 2019 was 41% but ranged from 24% in Miami to 62% in NYC.[19] These results suggest that even in cities that were able to sustain robust employment through the 2020 pandemic year, the commercial property base is vulnerable to an increase in WFH. The potential importance of WFH is emphasized by comparing the employment effect (column 2) to the WFH effect (columns 3 and 5). Even under our lower impact assumption, cities would need an increase in employment in key industries of at least 6% to avoid substantial losses in commercial property values.
FIGURE 6
Change in Demand for Non-residential Real Estate Space
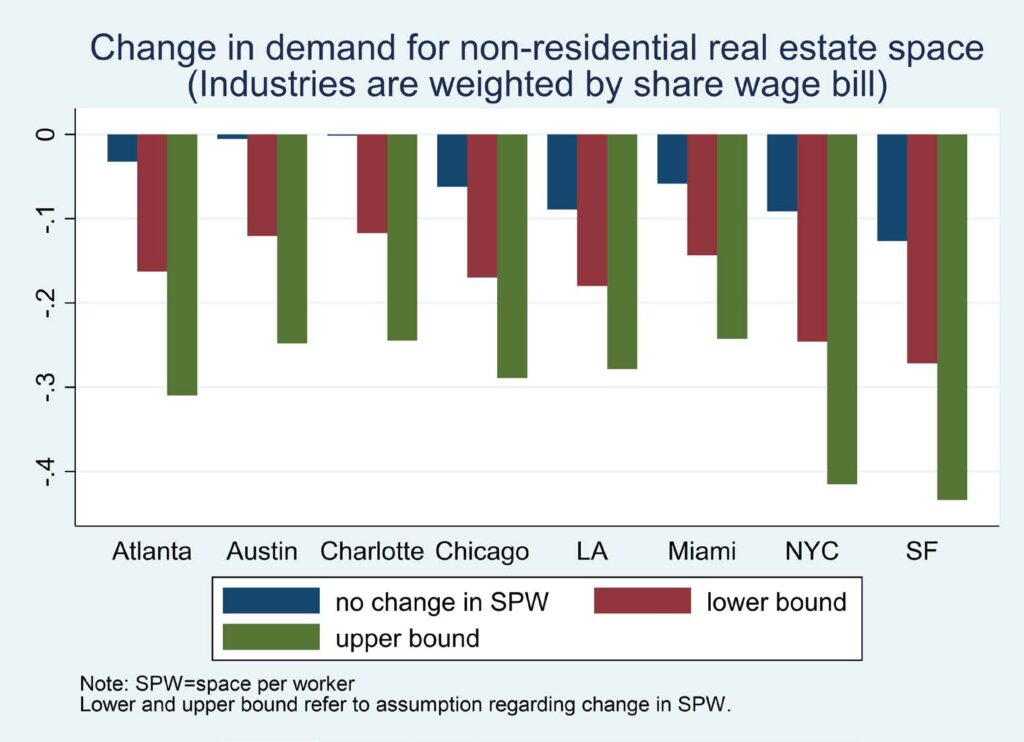
Lower Bound assumes WFH less than 2 days per week; Upper Bound assumes WFH 3 or more days per week. See Appendix 1 for details.
Discussion
How do our estimates compare to the expectations of commercial real estate professionals? As one example, in June of 2021 the head of REIT research at Green Street Properties predicted a 15% drop in demand for office space in the U.S., with somewhat greater decreases in coastal cities. (Lachance, 2021) This estimate is slightly smaller than our lower bound estimate of 18% (Table 2, column 4), and only half as big as our upper bound estimate of 31 percent. (Table 2, column 6). However, while not specified as such, analyst estimates probably incorporate the impact of the ongoing macro revival in the economy and the stock market in pulling up the value of all fixed assets, including commercial real estate.
By contrast, our estimates of the total effect include the negative employment impacts in 2020. Hence, the 15% estimate by Lachance is more directly comparable to our stand-alone estimates of the effect of WFH on reduced SPW – 12 percent lower bound and 25 percent upper bound. Thus, our lower bound estimates are more conservative than the 15% estimate, while our upper bound estimates are considerably larger. Should the economic recovery sputter because of the rise in the Delta variant, as suggested by the August 2021 jobs report, our total effect estimates could be more relevant than our stand-alone WFH estimates.[20]
Our average upper bound estimate of the decline in market value (25%) due to the increase in WFH is more than double our lower bound estimate (12%). The key question is where actual market value declines will land in different cities over the longer term. Our discussions with real estate professionals, as well as the academic research, suggest that over time the percent of days of WFH will gradually decrease from their peak pandemic highs, as vaccination rates grow, and organizational dynamics – e.g., the need for in-person mentoring for new hires, and firm-specific internal dynamics of competition gradually reassert the prior stigma effect of working remotely.[21] This reasoning suggests that the lower bounds, consistent with less than 2 days per week working remotely, might be more realistic in the long run. However, we emphasize the uncertainty regarding the long-run equilibrium.[22]
While the above estimates of the effect of COVID-19 on commercial real estate are model and assumption-based, NYC 2022 assessment rolls provide some initial information on the COVID-19 effect on commercial real estate market values. NYC has by far the largest number and value of commercial properties of any city in the country. Valuations for assessment purposes rely on income and expense reports filed by commercial landlords in the preceding year. The Department of Finance estimates that the value for assessment purposes of commercial and industrial property (Class 4), after taking into account past deferred increases, declined by 17.3 percent from 2021 to 2022 (fiscal years).[23] The largest drop was for hotels, with a decrease of 24.4 percent. Stores (retail) dropped by more than 20%. Both the uniformity of the drop and its overall magnitude suggest that the COVID-19 induced recession and the accompanying drop in employment across many sectors has been the key short-term driver of commercial real estate prices.
Subtracting our estimated employment effect of 9% from the assessment decline in NYC suggests that the WFH effect alone was responsible for at least an additional 8 percent drop in the assessed value of commercial properties, or about half of the total impact, in the first year following the COVID -19 recession. Recalling that DOF’s estimate of the actual decline in market value in 2022 for office buildings in Manhattan was 25 percent. Thus, subtracting our estimated 9 percent employment impact, implies a drop in market values due to work from home of 25 percent – nine percent, or 16 percent. This estimate is almost exactly equal to our lower bound estimate of 16 percent for the stand-alone effect of WFH on commercial property in NYC (Table 2, col 3), and about 2/3 of our upper bound estimate of 25 percent. If the actual space reductions are closer to our lower bound assumptions, and the economic recovery is robust, these calculations suggest that the decline in commercial property values will end by in 2023. However, if actual space reductions are closer to our upper bound assumptions, the fall in values will continue for the next few years. The substantial pause in the economic recovery caused by the emergence of the Delta variant and the repricing of commercial property that will occur with the gradual expiration of existing commercial leases, suggest that there are likely to be significant additional price declines in NYC commercial real estate in the next few years.
The smaller decline among Class A buildings in NYC – the flight to quality – reflects the robustness of rent rolls in newer buildings, likely to be occupied by firms with higher profit margins. So-called ‘trophy’ properties have also benefited from a shift in demand from lower to higher quality office space, as overall prices drop. This shift is reflected in the dominance of lease renewal activity in the trophy and Class A properties. (JLL Realty, 2021).
To summarize, there are opposing forces affecting the future path of commercial real estate prices. More favorable macroeconomic conditions could set the stage for a healthy rebound in 2022. Robust wage gains in key space-using industries, as illustrated in Figure 4 above, may allow some firms to actually increase, rather than reduce, their effective space per worker, just by keeping constant their current space usage, even as the number of workers in the office on any given day goes down. On the other hand, the multi-year term for most commercial leases suggests that as leases expire, the underlying decrease in demand will translate more strongly into declines in price, implying that longer-term effects could exceed initial impacts.[24]
Federal fiscal relief is also important, as suggested by the positive effect of the passage of the American Rescue Plan in March 2021 on REIT performance (shown in Figure 8.3 below). However, the winding down of this assistance may pose an additional long-term danger for commercial real estate values. While $220 B of fiscal relief to states must be spent by the end of 2024, the $130 B of fiscal relief to cities and counties under the ARP must be allocated by March of 2022.
Financial Performance of Commercial Real Estate
We also examined the financial performance of commercial real estate to see what markets are predicting regarding future financial performance. Not surprisingly, short-term securities are generally more sensitive to underlying market changes than longer-term securities. We also found significant differences by the underlying type of real estate assets constituting different securities.
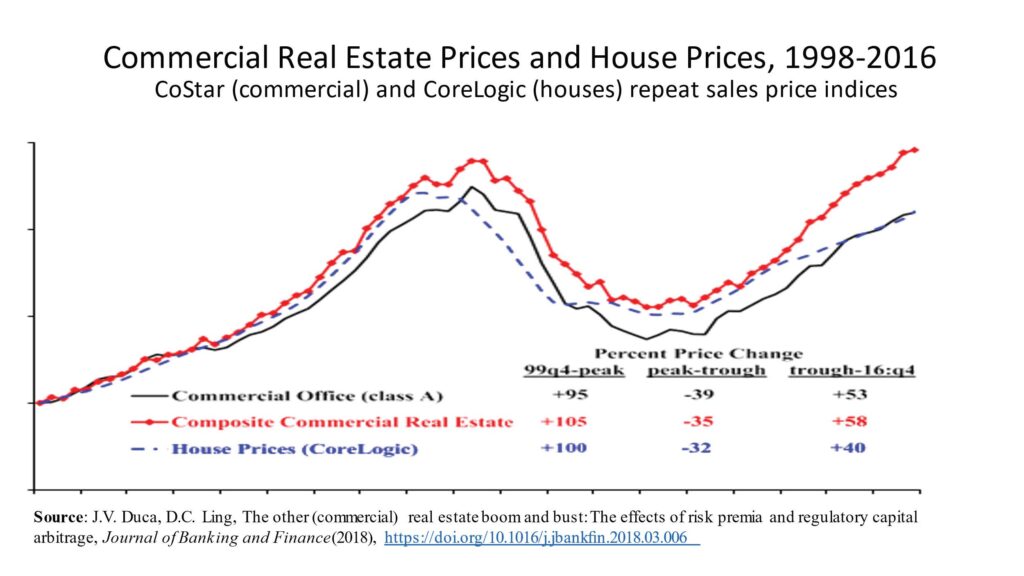
As shown in Figure 7, in the Great Recession, the market performance of commercial real estate closely mirrored the performance of the residential housing market, despite the fact that the wave of foreclosures in the housing market did not spread into the commercial market. DeLuca and Ling (2018) attribute this close link to the regulatory lending constraints on banks, which affected both residential and non-residential real estate, as well as the diffusion of the perception of higher risk across sectors of the overall real estate market.
FIGURE 7
Commercial Real Estate Prices and House Prices, 1998-2016
The major investment vehicle for commercial real estate is the REIT (Real Estate Investment Trust), a financial instrument which allows individual investors or larger funds to invest in the various subsectors of the commercial real estate market. The graphs below show monthly closing costs for each security as reported on a monthly basis. Prices are indexed to their value on January 1 of 2020, three months before the beginning of the pandemic.
We consider three REITs representing distinct subsectors. The Simon Property Group (SPG), (orange lines in Figs.8.1-8.3) is a REIT focused on shopping malls and shopping centers, mainly in suburban areas. Holdings include the Woodbury Commons in New York and the Forum at Caesars Palace in Las Vegas. Prologis, Inc. (PLD) (yellow lines in the figures) concentrates on logistics centers with a focus on global supply chains. Vornado Realty Trust (VNO) (light blue lines) invests in office buildings and street retail in Manhattan, a geography hit especially hard during the pandemic.
For comparison purposes, we also consider two additional securities. The Blackstone Group (BX), represented by the grey lines in the graphs below, is a U.S. alternative investment management company whose real estate business is actively invested in the commercial real estate sector. The Russell 1000 (RUI), represented by the dark blue lines in the graphs below, is a stock market index that tracks the 1,000 highest U.S. stocks by market capitalization.
Each graph represents one of three specific periods relevant to COVID-19 – (1) the period between January 2020 and mid-March 2020 when COVID-19 was declared a pandemic by the World Health Organization and a national emergency by then President Trump (Fig 8.1)
(2) the period between that beginning point and President Biden’s announcement of the American Rescue Plan in January 2021 (Fig. 8.2), and (3) the period since that announcement (Fig. 8.3).
In the first period, the crash and recovery surrounding the beginning of the COVID-19 pandemic is readily apparent. In the second, there is some variation but all the indices move more or less together. Some of this variation could be attributed to indecision in the markets. The final period demonstrates substantially less variation than the previous one with the exception of one security that shows significant growth.
FIGURE 8.1
January 2020-April 2020, Figure 8.2. May 2020-January 2021, Figure 8.3. February 2021-August
2021
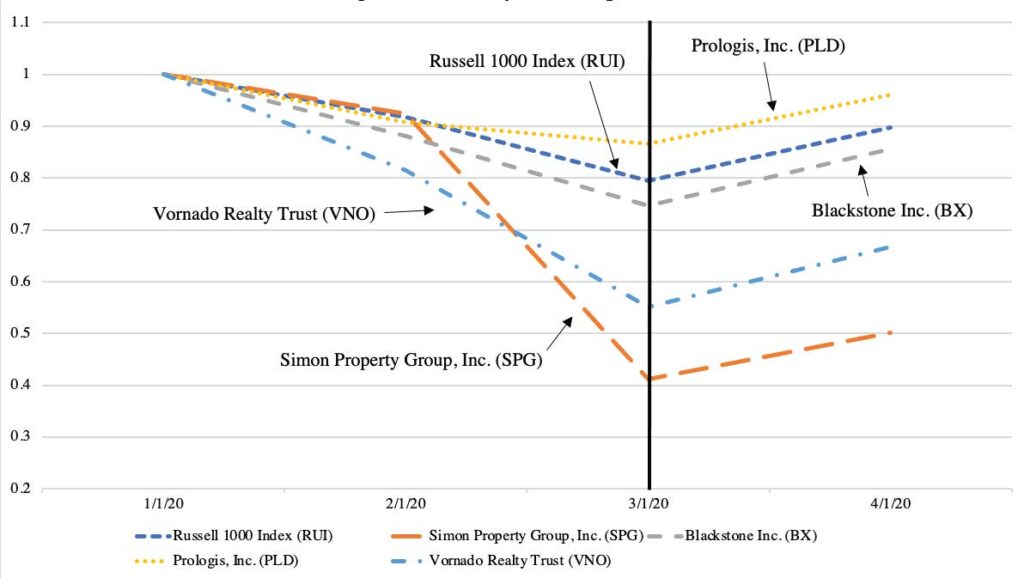
FIGURE 8.2
May 2020 – January 2021
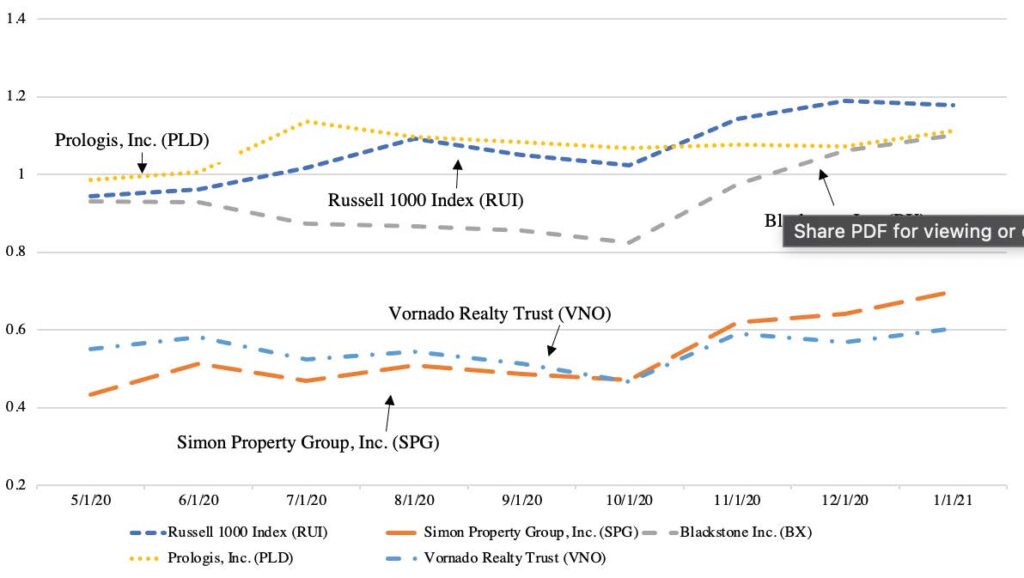
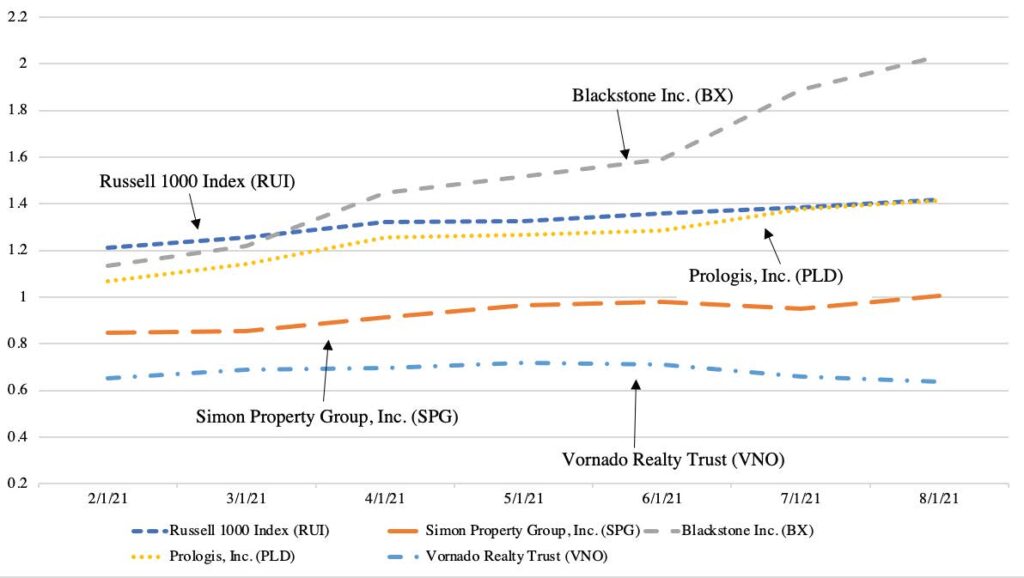
FIGURE 8.3
February 2021 – August 2021
These five securities displayed similar trends relative to their values in January of 2020 before late-February/mid-March of 2020. At that point, all five securities experienced significant declines, due to the beginning of COVID-19. The REIT’s mirrored the stock market index in this period, though Prologis, the logistics REIT, outperformed the other two REITs and the additional securities included on the graph. There were bigger declines in the Simon national shopping center and NYC based Vornado REITS. In April of 2020, all five securities rebounded from relative lows, though still not regaining their pre-pandemic positions.
From the beginning of COVID-19 to the announcement of the American Rescue Plan, recovery has been variable. Vornado Realty Trust, invested in what is arguably the hardest hit commercial real estate market in the United States, and Simon Property, were still far
from regaining their pre-COVID peak. These results suggest investor pessimism regarding prospective returns from commercial real estate in New York City and suburban retail across the country.[25]
Prologis, Inc., invested in one of the most resilient commercial real estate subsectors, recovered relatively quickly and surpassed its pre-COVID peak by the 3rd quarter of 2020. Its recovery paralleled the stock market index recovery over the same period, which regained its pre-pandemic value during this period. Starting in Q4 2020, the Blackstone Group also demonstrated significant strength, surpassing its pre-pandemic price by November of 2020.
Since the announcement of the American Rescue Plan, recovery among these five securities has been variable. The Blackstone Group stands out as one of the winners amid the commercial real estate crash and recovery, particularly since the announcement of the Rescue Plan. Blackstone broke away both from the stock market index and the logistic REIT during this period, after mirroring these indices in the two previous two periods. This suggests a connection between optimism in the commercial real estate market, particularly outside of syndicated REIT investments, and the announcement of the federal rescue plan for city finances that would help to offset declines in the value of the real estate base, thus reducing the pressure on cities to increase property tax rates. Performance among the other four securities has been positive, but significantly less so than for Blackstone. Vornado has been the worst performing, a result that is consistent with the forecasts from this paper of a significant decline in the market value of commercial real estate in NYC.
The results in the three periods are consistent with the broader picture of the performance of office REITs in the 19 months from March 2020 through September 2021. The Nariet T-Tracker reports that “WFH related uncertainty has lowered office occupancy and rent growth, contributing to a 12.5% decline in FFO (cash flow) of office REITs in the first quarter of 2021. Total returns of office REITs were a negative 11.7% in the fifteen months through May 21, 2021.” (Worth, John, 2021) However, most of this drop occurred in 2020. As of October 2021, the return on all office REITS was close to Russell 1000 stock market index for 2021. (Schnure, 2021).
The investment perspective on the commercial real estate crisis informs the overall impact on property tax revenues in a number of ways. First, differences in short-term and long-term expectations of the same underlying assets suggests the considerable uncertainties regarding valuations. Given the importance of commercial property tax revenues to city revenues overall, this uncertainty is problematic for forecasting revenues and budget planning. Second, longer term confidence suggest that the market has already priced in actual and expected federal government intervention. While this intervention may provide a short-term bounce, it also suggests future budgetary problems as federal funding runs out. Finally, disparities in confidence across cities could drive capital investment towards stronger and more resilient commercial real estate markets, further widening revenue disparities.
Fiscal Impacts
To examine the fiscal impact of WFH, we use a data set created by Adam Langley of the Lincoln Institute of Land Policy, Andrew Reschovsky, and Howard Chernick, that draws on the U.S. Census of Governments data, but takes account of the spending and revenue of all overlapping governments for each city in the sample. The unit of analysis is called the Fiscally Standardized City (FiSC). We use the most recent FiSC data, for the fiscal year 2018. The methodology for estimating fiscal effects is described in Appendix 2.
The results are illustrated in a series of graphs for the 8 cities, showing fiscal structure, effects on commercial property tax revenues, and general revenue effects. Figure 9 illustrates the variation in fiscal structure for the cities in our sample. ‘It shows the shares of the property tax, other taxes, state aid, and user charges in general revenue.
Figure 9 highlights the importance of the property tax in all 8 cities. Because WFH will most directly affect property taxes, cities that are more reliant on the property tax are potentially more vulnerable to a shock to commercial property values than cities with more diversified revenue structures. The blue part of the bar shows the importance of the property tax in the general revenue of the FiSC. The highest share is in Austin (50%), the second highest is Miami (34%), while the lowest share is in LA (20%.) Figure 9 also shows the wide variation in dependence on intergovernmental revenue from the state, with Austin and Miami at less than five percent, Atlanta at 9%, and NYC, Chicago, Los Angeles, and San Francisco at 20% or more. Charges are particularly important in Atlanta, Austin, Charlotte, Miami, and San Francisco.
FIGURE 9
Revenue Structure, 8 Fiscally Standardized Cities, 2018
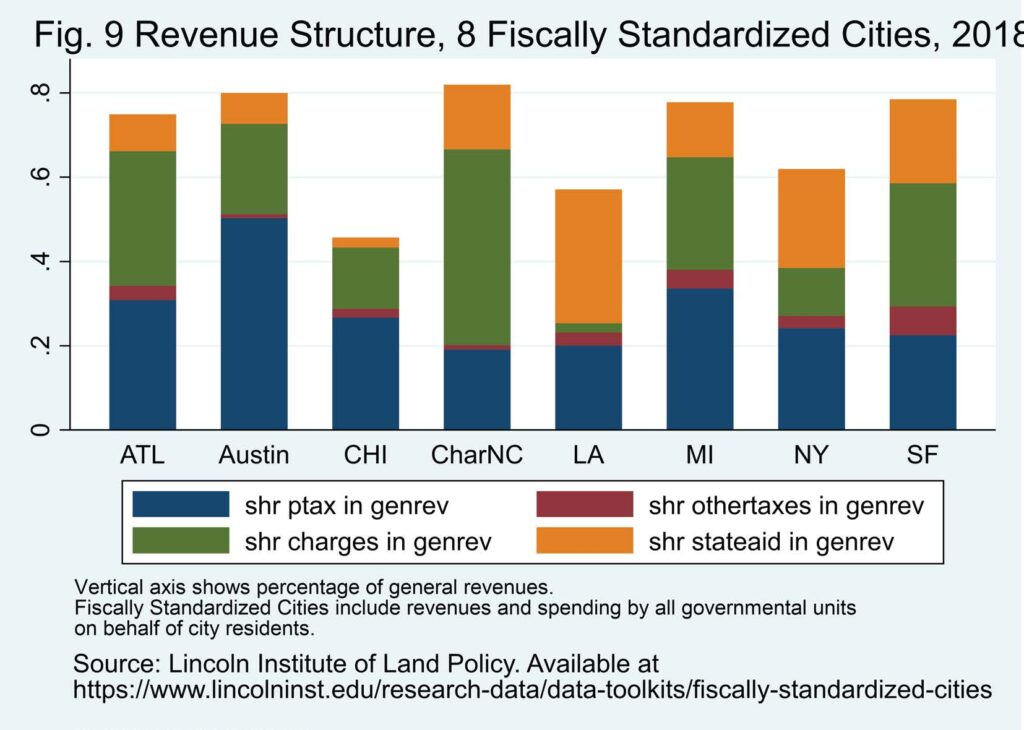
Figure 10 shows the simulated effect of WFH on property tax revenue. The property tax effect is decomposed into two parts; the effect of WFH on the market value of the commercial property tax base, and the share of property tax revenues derived from commercial property.
As discussed in Section III, the effect on the commercial property tax base is derived from our assumptions regarding the change in demand for space, with upper and lower bounds on the plausible effect. Under our lower bound assumptions, the average reduction in the value of CI property as a result of reduced demand for space is 12%, while the upper bound reduction is 25%. All cities face potentially significant declines in the value of existing commercial and industrial property due to the increase in WFH. Charlotte and Austin are well below the average, while Atlanta, Chicago, and Miami are closer to the average reduction. NYC and San Francisco have the highest projected reduction.
As shown in Figure 10, Atlanta stands out for its high share of commercial property in the overall property tax base, (close to 60%), with NYC next at 41%, and LA and Austin relatively low at around 23%. The high share for Atlanta reflects the extensive residential decentralization in the Atlanta metro area, while the high share for NYC reflects higher effective tax rates on commercial than residential property. The CI share of market value (for assessment purposes) in NYC was 20% in 2020, while the share of property tax revenues was 41%.[26] The relatively low CI shares for San Francisco and Los Angeles reflect the fact that commercial property turns over less frequently than residential property, and under Proposition 13, passed in 1978, properties are reassessed at market value only when they are sold.
FIGURE 10
Decline in Market Value of Commercial Real Estate
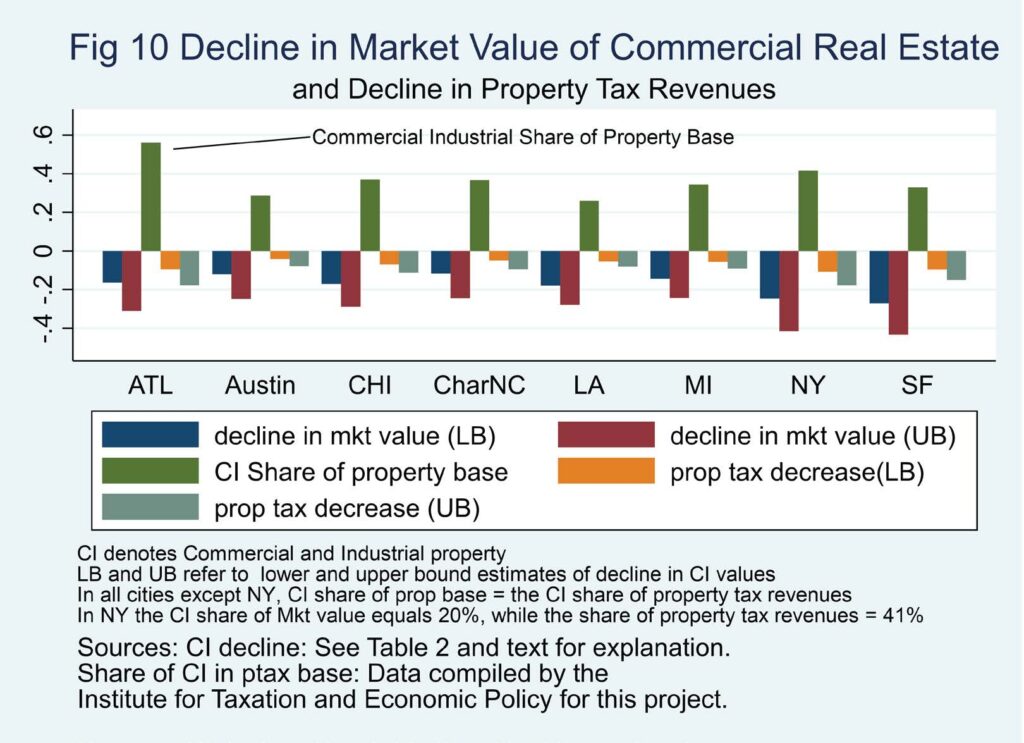
FIGURE 11
Predicted Decline in Property Tax and General Revenue
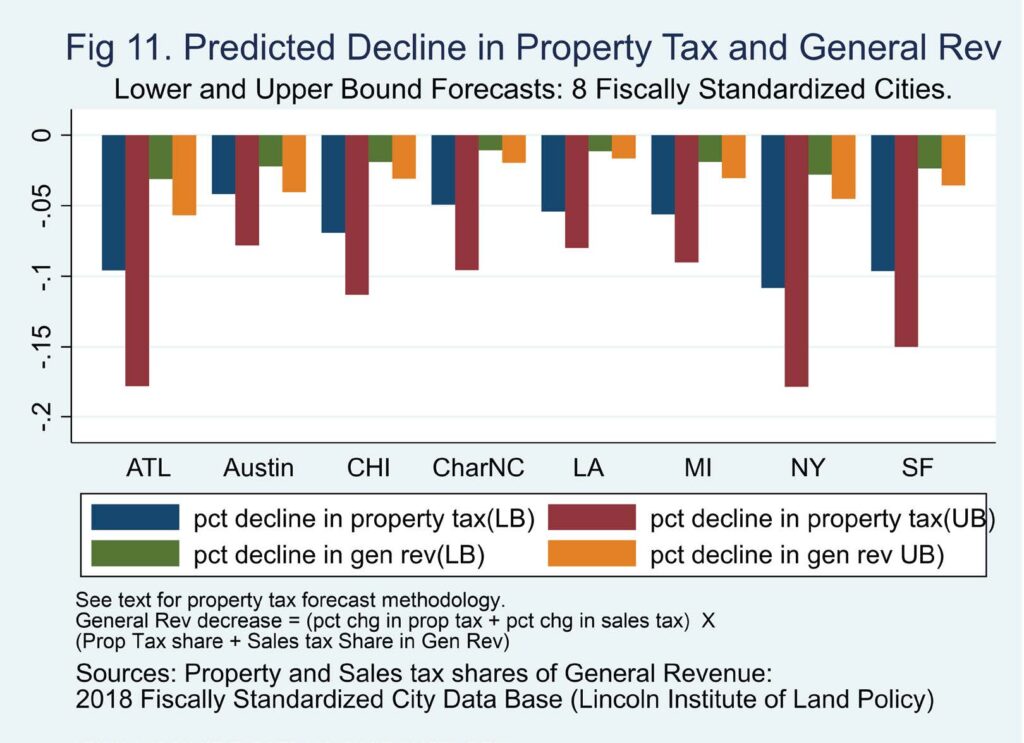
Figure 11 shows the estimated effects of WFH on the general revenue of cities, under the lower and upper bound assumptions for the decrease in demand for space. In addition to the direct commercial property tax effect, the results include rough estimates of the effect on sales tax revenue and residential housing prices and rents. Estimation procedures for these additional effects are described in appendix 3.
Notably, the largest projected decrease in general revenue is in Atlanta – from 3% to almost 6%. The big drop for Atlanta results from a large projected drop in the value of commercial property, a large drop in property tax revenue (because CI property comprises a relatively high share of the total property tax base), and relatively greater dependence on the property tax (greater than in all cities except Austin and Miami.
Figure 11 also highlights our forecast that Austin, though it withstood the economic contraction during the COVID-19 recession, would experience revenue losses similar to NYC and San Francisco. This result reflects the extreme dependence of Austin on the property tax, as opposed to a very low share of revenue from state aid. New York and San Francisco, despite being at risk for a substantial decline in the value of commercial property, are at least somewhat insulated from the WFH shock due to their diversified tax structures, and the important role played by state aid.[27] The lowest predicted declines in revenue are for LA and Charlotte– between 1% and 2%. This Charlotte result reflects its economic strength, the relatively small share of the commercial property tax base at risk from WFH, and the low share of the property tax in total revenue. For LA, the lower forecasted impact is principally a reflection of the low share of commercial property in the property tax base.
FIGURE 12
Effect on General Revenue; 8 Cities (LB)
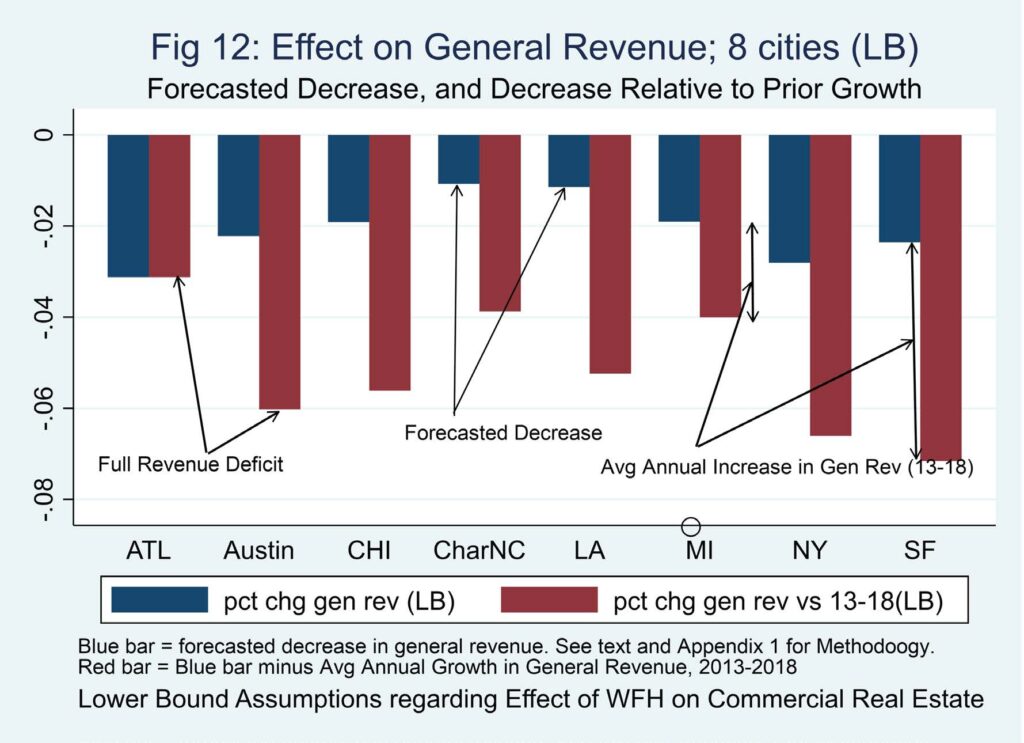
Given that costs of city services typically rise by several percentage points per year, when revenues are flat, city services must be cut. If revenues actually decrease, as we forecast in this research, the imbalance between the cost of delivering services and the revenue available to finance those services can worsen dramatically. Figure 12 addresses this point, by showing the predicted by combining the predicted change in general revenue under our lower bound assumptions (the blue column), and the full revenue deficit (the red column), the latter defined as the difference between the average annual change from 2013-2018 and the forecasted lower bound decrease. The mean change for the 8 cities now grows to (negative) 5.3 percent. The biggest shocks to revenue are in San Francisco (7 percent), NY (6.2 percent) and Austin (6 percent) Though Atlanta has the largest direct shock from the WFH phenomena, because per capita revenue did not grow in the 2013-18 period, the overall shock is just equal to our forecasted 3 percent decrease. Under the upper bound assumptions (not shown in Figure 12), the mean change goes from 5.3 % to 6.7%, and almost 9% in NY and San Francisco. The large effects in these two cities reflect their strong revenue performance pre- pandemic.
Conclusions
Dense central cities and their surrounding metro areas are key drivers of economic activity. The following picture, based on 2013 data from the Bureau of Economic Analysis (U.S. Dept. Of Commerce) shows that fully one half of all output in the economy is generated in a small number of major metropolitan areas. The fiscal health of central cities, defined as the ability to provide adequate public services at competitive tax rates, plays a crucial role in enabling cities to continue to fulfill their vital economic function. The argument in this paper is that covid-19 pandemic poses a long-term risk to the fiscal health of cities.
The dramatic increase in WFH catapulted by the COVID-19 pandemic poses significant economic and fiscal challenges for central cities. Several studies find that in key industry groups located in central cities – information, finance, professional, scientific and technical, and management – 80% or more of jobs, (weighted by pay levels) could potentially be performed away from the office. In the 8 cities included in this study, these 4 industries made up more than a third of all wages paid, from 27 percent in Miami to 61 percent in NYC and San Francisco. Under the assumption that an increase in WFH will translate directly into reduced demand for commercial space, and that the reduced demand will be reflected in lower prices per square foot, we present a low and a high scenario for the decline in demand for CI real estate. Our estimates are based on a hybrid work model of two to three days WFH. The greater the share of wages in these four industries, the greater the potential decrease in demand for commercial space.
The direct employment effects of the COVID-19 recession in 2020 on commercial real estate values are estimated at 6% on average, ranging from 1% in Austin to 13% in San Francisco. Our estimates of the effect of potential decreases in demand for space per worker show average price reductions of 12% under our lower bound assumptions regarding the increase in WFH, and 25% under our upper bound assumptions. Combining employment-related effects with decreases resulting from reduced space per worker, New York and San Francisco are the most vulnerable of the 8 cities, with predicted commercial price drops ranging from 25% to 43%. Declines are somewhat smaller, but still significant in the other cities in our sample.
Combining data on the 2021-22 change in assessed values of commercial property in NYC – a 17.4% decline – with our estimates of the recession effect on NYC property values, indicates that about half of the decrease in assessed values is a direct result of the severe recession which hit NYC, while half reflect the initial effects of the emptying out of the Manhattan office districts under increased WFH. Our estimates of the stand-alone WFH effect on NY commercial property values range from 16% to 31%. Though neither approach – DOF or our simulations – is based on actual rent data for 2022, 16% estimate combined with an employment effect of -9%, is exactly equal to the DOF estimates of a 25% decline in the value of office building from 2021 to 2022. As more commercial expire, our results suggest that to commercial property values will continue to fall in the next few years. This suggests that unless there is a huge employment surge, commercial property values will continue to fall in NYC for at least the next few years.
We translate the decline in property values in the commercial sector into effects on property tax and overall city revenues. Magnitudes depend on the extent of decrease in commercial property values, the share of CI property in the property tax base, and the share of revenues derived from the property tax. Because the larger cities tend to have more diversified revenue structures, as opposed to heavily property tax-dependent cities like Austin and Miami, the revenue effects are more evenly spread across the cities in our sample than the commercial property tax effects by themselves. Due to its high share of CI property in the property tax base and its relative dependence on the property tax, Atlanta would have the largest revenue effect, a decrease of 5.7% under our high impact assumption, while Austin, despite robust economic growth, would experience revenue losses in the 2% to 4% range. The Austin decline is close to the losses forecast for New York and San Francisco. NY and San Francisco are at least partially insulated from the fiscal shock due to the pandemic, due to their diversified revenue structures, including an important role for state aid.
To gauge the overall fiscal impact of the pandemic, we compare our projected fiscal losses to prior year revenue performance. The higher the prior growth rate, the greater the overall impact of the potential fiscal decline on the ability of cities to provide the services that are essential to a well-functioning urban area. The average change under this comparison is 5.3% (LB) and 6.7% (UB). Austin, NY, and San Francisco face gross fiscal deficits ranging from 6% to more than 8%. Given that the costs of city services typically rise by several percentage points each year, losses of this magnitude pose significant fiscal challenges, challenges which will become more and more painful as federal fiscal relief funds under the CARES Act and the American Rescue Plan phase out in 2022 and 2024.
Caveats
Several caveats are in order. Our results are based on assumptions regarding the permanence of the increase in WFH. These assumptions are based on the burgeoning academic literature on remote work, the opinions of a number of real estate professionals, and the information contained in the stock market performance of real estate. However, it should be stressed that the extent and duration of WFH is inherently uncertain. On the one hand, as long-term leases, typical in the commercial rent market, expire over time, and prices more accurately reflect current demand conditions, one would expect further reductions in commercial real estate prices. On the other hand, if the large increases in WFH prove to be a relatively transient phenomena, and the macro recovery of the U.S. economy is strong, the potential effects on central city commercial property tax markets could diminish considerably over time.
Our results also ignore the role of assessment lags and offsetting rate adjustments in promoting the short-run stability in property tax performance that has been observed in many studies.[28] If cities are able to at least partially offset the forecasted reductions in the commercial property base by increasing commercial or overall property tax rates, the immediate revenue decline will be mitigated. However, the fiscal necessity to do this is reduced in the short-run by the infusion of federal fiscal relief. Moreover, the political feasibility of such tax rate offsets is open to question, given that commercial real estate interests are relatively powerful in cities, and likely to lobby hard to limit any such tax offsets.
The pandemic has exacerbated the fiscal pressure on cities not only by reducing the revenue base, but also by imposing new costs on cities, particularly in the areas of education, housing, homelessness, and the economic distress generated by the pandemic. While the temporary fiscal relief to cities and states under the American Rescue Plan will reduce the fiscal pressure on cities in the near term, as those funds phase out in 2022 (2024 for some states) the fiscal effects of WFH and the COVID-19 disruption on the finances of cities will be more and more important.
Policy Implications
The forecasted decline in the price of commercial real estate in cities implies a shift in the relative capacity of cities and suburbs. This shift should lead to a reallocation of state aid, to cities and away from more affluent suburban jurisdictions, particularly those where housing prices have grown the most rapidly since the pandemic. Most states distribute education aid, by far the largest category of state assistance to municipalities, inversely to local property wealth. Hence, some of the reallocation will happen automatically. However, the General Accounting Office found that equalization was increased more by increasing the state share of total financing then by greater targeting of state aid to poorer districts (GAO, 1998). They also found that the degree of equalization differed substantially across states. States such as Florida and Texas, that provide relatively small amounts of aid to their cities, will be especially challenged by the pandemic-induced shock to city finances.[29]
To compensate cities whose relative fiscal condition has been weakened by the pandemic and the increase in WFH, some states will need to increase the overall share of state aid in city finance, and revise their allocation formulae. To increase the absolute volume of state aid would require these states to adopt more elastic revenue structures, specifically through more reliance on individual and corporate income taxation.
The paradox shown by our estimates is that the consequences of the low-tax-no-income-tax fiscal stance in states such as Florida and Texas, though widely touted by political leaders in those states as crucial to the creation of new jobs, are likely to redound to the fiscal and economic detriment of their major cities, as they face the shock from the increase in WFH. If past experience is a guide, any changes to state tax policy and equalization criteria are likely to meet with furious resistance both from taxpayers and from jurisdictions that would be potential losers in any reallocation of state aid. Hence the predicted increase in fiscal inequality between city and suburb is likely to persist, with negative consequences both for fiscal equity and for economic growth in large metropolitan areas.
Appendices
Appendix 1: Methodology for Estimating the Change in the Price of Commercial Real Estate
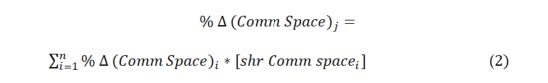
The change in demand for commercial space, as depicted in Table 1 and Figure 6, depends on the change in employment and the change in space per worker. To standardize across industries and cities, we express the change as a percentage of pre-COVID demand. For any given industry i the change can be expressed as
![]()
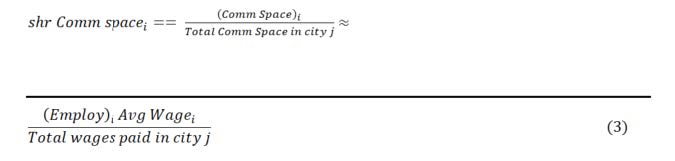
Equation (1) says that the percentage change in demand for commercial space is equal to the sum of (one plus) the percent change in employment times (one plus) the change in SPW, all minus one. As shown in equation (2), the change in demand for space for a city j is equal to the sum of (1) over all industry groupings (n), (at the two-digit level in this study), with each group weighted by its share of commercial space prior to COVID-19.
The challenge in using the expressions in (1) and (2) to simulate the change in demand for commercial space is the uncertainty as to the potential change in SPW, and the lack of data on the share of commercial space by industry. Despite enormous interest in the WFH phenomena, the real estate implications of the shift remain at best speculative and anecdotal.[30]
The change in SPW is likely to be negligible in industries where an increase in WFH is not possible, because positions demand high customer contact, extensive teamwork, outdoor work or other features. For example, restaurants require a certain number of servers, chefs, and other personnel. If customer demand increases, the restaurant may initially expand hours worked per worker, but eventually must hire more workers, to maintain a roughly constant output (meals) per worker. In some of these industries, space needs might actually increase, given the continuous need for social distancing.
By contrast, some industries or subsectors (for example legal and accounting services), subsectors of the (two-digit) category Professional, Scientific, and Technical Services, are likely to be able to sustain a substantial increase in remote work. However, net demand for space may still grow in a sector with reduced SPW if total employment is rising. Within the broad 2-digit sectors, there may be shifts from one subsector to another, with the growth in one or more of the subsectors offsetting the decline in space demands in the other subsectors.[31]
As a baseline for equation (1), our first simulation relies on two simplifying assumptions: (a) each industry uses an amount of commercial space per worker that is proportional to the average wage prior to COVID-19. Thus, a highly compensated attorney is assumed to consume more space than a call-center assistant.[32] (b) there is no change in space per worker from pre to post COVID-19. The assumption of no change in SPW abstracts from the shift from in-person to WFH under the COVID-induced recession. The two assumptions together imply that the overall change in demand for space by city is a function of the wage-weighted change in employment by industry, with each industry in turn weighted by its share of total wages paid in the county.
Given the lack of data on actual space usage, we use total wages paid – the wage bill – as the weighting factor for an industry. This approach implies that total space is a function of both the number of employees and the average wage paid, and that pre-COVID SPW was proportional to wages.[33]
From the base case of no change in SPW, we then forecast the potential change in SPW, with lower and upper bounds on the magnitude of the change. To generate our projections, we draw on a burgeoning literature on the spatial implications of increased WFH, as discussed in Section 2 above, and conversations with a number of real estate professionals.[34] We also look at the financial performance of real estate investments, and the actual change in assessment rolls from 2021 to 2022 for commercial property in NYC.
Barrero et al (2021) (see Section II above) argue that the increase in WFH will persist after the pandemic, with the proportion of work days from home showing a long-run increase from 5% pre-COVID to 20%, from 16% at lower income levels, and rising to 42% for annual incomes over $150K. Dingel and Neiman (2020) classify the percent of jobs by industry that can feasibly be performed from home. We use their estimates as the basis for our space change assumptions.
A. Our Estimates
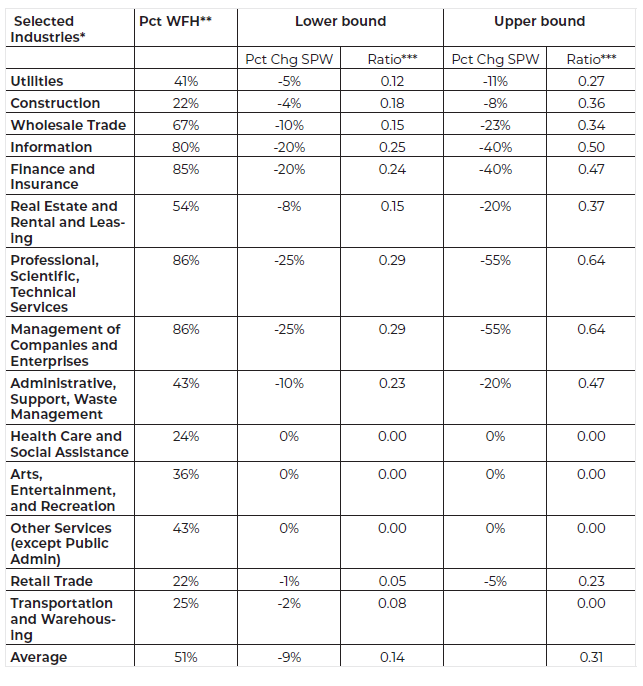
Table 1 shows the Dingel and Neiman estimates of the percentages that ‘can WFH’ for selected industries (column 2), and our lower and upper bound assumptions regarding the decrease in space per worker that would result. Employment in each industry is, is weighted by wages paid. The percentages range from zero for agriculture (not shown in Table 2) to 86 percent for professional services and management. Columns 3 and 5 show our lower and upper bound estimates of the percentage change in demand for space per worker, while columns 4 and 6 show the change in demand as a fraction of the ‘can WFH’ estimates in column 2. Our estimates are a variable fraction the proportion of jobs in a given industry classified as ‘can WFH’. For example, in the row titled Professional, Scientific, and Technical, Dingel and Neiman find that 86 percent of workers could plausibly work from home. We translate this estimate of WFH to less than 2 days per week at the lower bound, and more than 3 days per week WFH at the upper bound.[35]
Table A1. Pct ‘can WFH’, Chg Demand for Space
Excludes low WFH industries
** Pct ‘can WFH, weighted by Wages Paid. Source: Dingel and Neiman (2020)
***Pct chg Space Per Worker/Pct Can WFH
The crucial choices in this exercise are the translation from ‘can WFH to ‘will WFH’, and the reduction in SPW that results. For the four biggest employers (industries) of high wage workers in cities (information, finance, professional, and management), the lower and upper bounds are based on a hybrid model under which the post-COVID equilibrium ranges from WFH less than two days per week to more than three days. Assuming a 5-day work week, this would imply WFH from 40%-60% of workdays. For professional workers, we assume that WFH will have a somewhat larger effect on demand for space than in information, based on the high prior space usage of, for example, legal services and architecture (Gensler, 2012). This assumption regarding the professional grouping is in contrast to technology firms such as Google, that are experimenting with alternative workplace arrangements, but that do not necessarily imply an overall reduction in SPW.[36] For education (not shown in Table 2), we assume no change in SPW, given that schools are likely to require teachers to return to the classroom once a sufficient proportion of students and teachers are vaccinated, and a continuous need for social distancing in schools. We argue that these forecasts of space change, though inherently imprecise, provide at least an approximate reasonable range of potential effects.
Appendix 2: Methodology for Estimating Fiscal Effects on Cities
The direct effect of WFH on property tax revenues depends on the change in the market value of commercial property, and the share of commercial property in the overall property tax base. The direct property tax effect (as a share of general revenue) equals
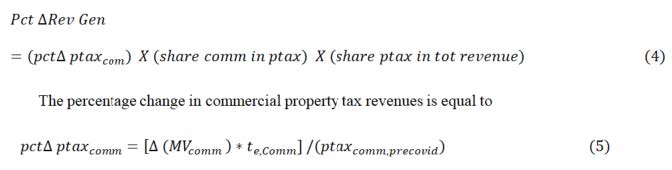
Under the assumption that the effective tax rate te on commercial property remains unchanged from pre to post-COVID, we can rewrite (5) as
![]()
Canceling out the effective tax rate from the numerator and denominator of (6), (7) shows that the percentage change in the property tax on commercial property depends only on the percentage change in the value of commercial property.
![]()
WFH may also have affect city sales tax revenues and residential property taxes, if the increase in remote work leads to a reduction in spending on taxable sales in the city and a reduction in demand for housing in the city. As described in appendix 3, we make very rough estimates for both effects.
Appendix 3: The Effect of WFH on Sales Taxes and Residential Property Taxes
Parallel to equation (7) in Appendix 1, the sales tax effect depends on the percentage change in taxable sales within the city. Barrero et al (2021) project that the increase in WFH would reduce spending on taxable sales in Manhattan by 13%, and by 4.6% in San Francisco.[37] However, a portion of any reduction in taxable sales in the central business district may be offset by an increase in sales made by city residents who switch to WFH. Hence, the sales tax effect may be expressed as

In (8), α(αϹϹ – αsub) is the difference in the shares of taxable consumption of those working in the office (denoted by center city) and those working from home (denoted by suburb), counting only the proportion of office workers who commute to the city from outside of the municipal boundaries.
Residential rents and housing prices may also be affected by increase in WFH. Based on a zip-code level sample from 30 large metro areas, Gupta et al (2021) find that a10 percentage point increase in the fraction of remote work in a ZIP code is associated with a 1.8–2.9 percentage point decrease in rent growth, and a lower but still significant decrease in local house price growth, of between 0.7–1.4 percentage points.[38]
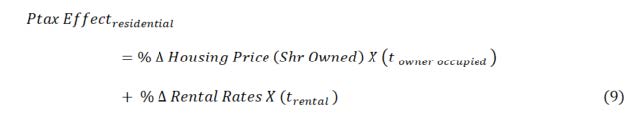
Our assumptions regarding change in demand for commercial space by industry, as summarized in Appendix A, Table A.1, indicate a lower bound effect of roughly 25% for the key industries in central business districts. In our sample, these key industries represent an average of 31% of all wages paid. Assuming that five percent of work prior to the pandemic was remote, the WFH figure represents a 20% increase in WFH. If all zip codes in a city were subject to this increase, the net effect on rents would be a 3.6-5.8 percent decrease in rents, and a 1.4-2.8 percent decrease in the rate of growth of housing prices. Multiplying by the share of the key WFH industries in total wages, implies an average reduction in rents of 1.1 to 1.8 percent, and a .43-.87 reduction in housing prices. While one might expect that the increase in remote work would increase demand for housing in any given zip code, the results suggest that to the extent that the percentage change in WFH is a proxy for increased demand for suburban and exurban locations.
References
Althoff, Lucas, Fabian Eckert, Sharat Ganapati, and Conor Walsh. (Dec. 2020) “The City Paradox: Skilled Services and Remote Work.” CESIFO Working Paper 8734. Available at https:// ssrn.com/abstract=3744597
Barrero, Jose Maria, Nicholas Bloom, and Steven J. Davis. (April, 2021) “Why Working From Home will Stick.” Working Paper 28731, http://www.nber.org/papers/wp28731,
National Bureau of Economic Research, 1050 Massachusetts Avenue, Cambridge, MA 02138
Chernick, Howard, Adam H. Langley, and Andrew Reschovsky. 2015. “Comparing Central City Finances Using Fiscally Standardized Cities,” Journal of Comparative Policy Analysis: Research and Practice 17, No. 4 (August): 430-440. http://dx.doi.org/10.1080/13876988.2015.104
.082
Chernick, Howard and Andrew Reschovsky. 2019. “Measuring the Fiscal Health of Cities.” Lincoln Institute of Land Policy, Working Paper. June.
Chernick, Howard, Andrew Reschovsky and Sandra Newman. 2021. “The Effect of the Housing Crisis on the Finances of Central Cities.” Journal of Housing Economics.
Dougherty, Sean, Michelle Harding, and Andrew Reschovsky, 2019. “Twenty Years of Tax Autonomy across Levels of Government: Measurement and Applications.” OECD Working Paper on Fiscal Federalism No. 29. Organization of Economic Cooperation and Development, Paris, France.
Di Napoli, 2021. “Sales Taxes Jump 49.2 percent in Second Quarter https://www.osc.state.ny.us/ files/local-government/publications/pdf/local-sales-taxes-surge-in-april-june-2021.pdf
Dingel, Jonathan and Brent Neiman (April, 2020). “How many Jobs Can be Done at Home?” National Bureau of Economic Research, Working Paper 26948. http:/www.nber.org/papers/ w26948
Dougherty, Sean, Michelle Harding, and Andrew Reschovsky. 2019. “Twenty Years of Tax Autonomy Across Levels of Government: Measurement and Applications,” OECD Working Papers on Fiscal Federalism, No. 29. Paris: Organization of Economic Cooperation and Development.
General Services Administration – Gensler, 2012. “Workplace Standards Benchmarking.” U.S. General Services Administration, Public Building Service. Available at www.gsa.gov.
Gupta, Arpit, Vrinda Mittal, Jonas Peeters and Stijn Van Nieuwerburrgh, 2021. “Flattening the Curve: Pandemic-Induced Revaluation of Urban Real Estate.” National Bureau of Economic Research Working Paper 28675. Available at http://www.nber.org/papers/w28675. April. enants
Lachance, Cedrik. 2021. U.S. REITs Have Moved Past COVID “Very Distinctly”: Green Street | Nareit, Podcast, June 28. Available at https://www.reit.com/news/podcasts/us-reits-have- moved-past-covid-very-distinctly-green-street
New York City Independent Budget Office, 2021. “Assessments and Revenue: Understanding Next Year’s Projected Billion Dollar Fall in Property Tax Revenue.” April. Available at https://ibo. nyc.ny.us/iboreports/assessments-and-revenue-understanding-next-years-projected-billion- dollar-fall-in-property-tax-revenue-april-2021.pdf
Parrott, James. 2021. “Covid-19 Economic Update.” Center for New York City Affairs, August 26. Available at http://www.centernyc.org/reports-briefs/2021/3/25/its-a-longer-road-to-recovery-for-the-labor-market?mc_cid=fcdaf7be2f&mc_eid=1eba69c118
Patino, Marie, Aaron Kessler and Sarah Holder. 2021. “More Americans are Leaving Cities, but don’t call it an urban Exodus.” Bloomberg City Lab. April 26. Available at https://www. bloomberg.com/graphics/2021-citylab-how-americans-moved/
Rosenthal, Stuart, William Strange, and Joaquin Urrego (2021). “Are City Centers Losing Their Appeal? Commercial Real Estate, Urban Spatial Structure, and COVID-19New York Times, 2021. “Lower Rents?”, June 29.
New York Times, 2021. “Turning Dead Office Space into Vibrant Labs.” July 28.
Schnure, Calvin. 2021. “Most REIT Sectors Moved Lower Last Week.” October 5. Available at https://www.reit.com/news/blog/market-commentary/most-reit-sectors-moved-lower-last- week
Wang, C. and T. Zhou (2020), “Face to Face Interactions, Tenant Resilience, and Commercial Real Estate Performance,” Working paper.
Worth, John. 2021 “2021 Midyear Outlook for REITs and Commercial Real Estate: A Robust Recovery Ahead.” Available at https://www.reit.com/data-research/research/nareit- research/2021-reit-midyear-outlook-economy-commercial-real-estate
Endnotes
[1] In the next report under this project, we expand the sample of cities from 8 to 100.
[2] Evidence to date suggests that the overall pattern of moves within metro areas has not changed ap- preciably since the pandemic. In the fifty biggest cities, 84% of the moves were within the perimeter of the central metro area, down just slightly from before the pandemic (Patino et al, 2021). However, compared to pre-pandemic, there has been an increase in the ratio of outmigrants to immigrants in the center cities of SF and NY.
[3] “Before the pandemic Americans spent 5% of their working time at home. By spring 2020 the figure was 60%.” https://www.economistd.com/special-report/2021/04/08/the-rise-of-working-from-home. A third quarter 2020 survey by UPWork estimated that 27% of jobs would be fully remote in 2021. Avail- able at https://www.businesswire.com/news/home/20201215005287/en/Upwork-Study-Finds-22-of- American-Workforce-Will-Be-Remote-by-2025
[4] The Chernick et al forecasts were prepared in the spring of 2020, at which time the duration of the pandemic was expected to be much shorter than has actually occurred.
[5] “Over a quarter (27%) of workers surveyed by Citrix said they would accept a pay cut of between 15-20% for a fully remote role, with a similar number (26%) prepared to accept a pay cut of over 20% for the benefit.” https://www.techrepublic.com/article/take-a-pay-cut-to-work-from-home-forever-many-of- fice-workers-think-its-a-good-idea/
[6] Whether any increase in productivity from increased WFH will accrue to employees versus owners of firms depends on industry structure and employment markets. Another possible outcome is that the increase in demand for larger homes in suburban and exurban locations benefits the owners of land in those areas. In dense cities that rely heavily on mass-transit, time saved in commuting, by reducing demand for mass transit, has a potential negative effect on the finances of transit systems, with in- creased pressure on revenues in a high fixed-cost industry.
[7] An article in the NYT (June 6, 2021) cites Jacqueline Reses, a former Yahoo executive: “Some of the best decisions and insights come from hallway and cafeteria discussions, meeting new people, and impromptu team meetings.” This point is reiterated by Tim Cook, chief executive of Apple, and Jamie Dimon, chief executive of JPMorgan Chase. Dimon says that working from home “doesn’t work for spontaneous idea generation, it doesn’t work for culture.” https://www.nytimes.com/2021/06/23/upshot/ remote-work-innovation-office.html
[8] A similar point was made to us in discussions with Philip Pitruzzello, a real estate professional based in NY.
[9] Also see Gupta et al (2021) for an evaluation of potential effects on urban real estate.
[10] Rosenthal et al find that the rent gradient falls by 1.2 points from its pre-COVID level of 6.3% per mile, while the local density rent premium falls by 2.7 points from a pre-COVID base of 12.9%.
[11] An article in the NYT (July 7, 2021) reports on the vastly reduced daily earnings of food-truck workers in Manhattan, most of whom are immigrants. “For thousands of food truck operators and cart vendors in New York, the ability to make meaningful profits depends on large numbers of workers returning to the office.” https://www.nytimes.com/2021/07/20/business/new-york-food-trucks-office-workers.html
[12] More general examples of low-wage occupations (2020 median pay in parentheses) that are promi- nent in dense urban areas, and likely to be hurt by the increase in WFH include Food and Beverage Serving ($24,190), Retail Sales ($27,320), and Janitors and Building cleaners ($29,080). Source: https:// www.bls.gov/ooh
[13] See Dougherty et al (2019).
[14] There will undoubtedly be both subtractions and additions to the stock of office buildings. For older buildings, and for specific industries, particularly the hotel industry, the decline in price may be great enough to induce a change in usage, from commercial to residential. On the other hand, given the long lead time in bringing new commercial space to market, office buildings that were under con- struction prior to COVID are coming on line in 2021-2023. Paradoxically, the cities with the most robust commercial property markets pre-pandemic are the ones that are most likely to have new supply coming on line over the next few years. This is the case in the NYC office market, where a number of large projects are now in the leasing stage. (New York Times, June 29, 2021) The greater the increase in supply relative to the reductions from conversion to alternative uses, the greater the overall drop in prices necessary to clear the market.
[15] The typical pattern of price adjustment to a decrease in demand for commercial real estate is that the asking rent stays relatively stable, while net effective rent falls due to increased concessions.
[16] This point is also based on a slide presentation provided to us by Ms. Holtzman showing recent pat- terns of leasing and prices in the NYC commercial real estate market.
[17] By size, JLL is the second largest publicly traded commercial real estate brokerage firm in the U.S., with 88,000 employees and total revenue $16.3B in 2018.
[18] We are grateful to Carmela Quintos of the NYC Dept of Finance for providing us with the assessment data.
[19] The 2019 shares of total wages paid for Information, Finance, Professional, Scientific and Technical, and Management were as follows: Miami (24%), LA (29%), Chicago (35%), Austin (35%), Charlotte (42%), Atlanta (47%), San Francisco (57%), and NYC (62%).
[20] Evidence for this sputter in NYC comes from the most recent report on payroll employment data, re- leased August 19th, which shows that the city’s rebound stalled in July, even before the latest COVID-19 case surge. (Parrott, 2021)
[21] As one real estate professional in New York put it, ‘the first time the firm loses a client or fails to close on a deal due to reluctance to travel or come into the office, the pressure to be physically present will reassert itself very strongly.’
[22] It should be noted that while this was plan for the Fall of 2021, for many firms the rise of the Delta vari- ant has pushed back the date of full return to work on-site.
[23] The determination of assessed value of CI property in any given year in NYC follows a some- what complicated process. Market value for assessment purposes is equal to net income divided by a capitalization rate (cap rate). The higher the cap rate, the lower the assessed value. Cap rates are estimated by DOF based on historical precedent and market reports. Net income, equal to income mi- nus allowable expenses, is forecasted based on landlords’ prior year filings, under the assumption that economic conditions are relatively stable. However, the stability assumption could not be applied for the modeling of 2020/21 income and expenses, to apply to the 2022 assessment roll. The year 2020 was a structural change in which the economy was essentially shut down due to the pandemic. Because DOF could not use its usual forecasting rules, it estimated income for calendar year 2020, based on 10 years of data relating changes in unemployment rates and changes in landlord income. Expense ratios were assumed constant from 2019. Rates of delinquency and effective rents (top-line rents minus discounts) are not fully known as of this writing.
To determine property tax liabilities, NY calculates a transitional assessed value which is equal to (45 percent of) the actual AV, plus the phase-in of 5 years of previous increases in the actual AV.
The assessment value for property tax liabilities, called the billable assessment, is equal to the mini- mum of Actual Market Value and the transitional value. When property values are rising, the billable assessment is typically equal to the transitional value. However, when commercial property values fall substantially, as they did in 2022, many properties take the Actual AV. The minimum rule implies a built-in asymmetry – property tax increases based on increases in market value are phased in over five years, while decreases are immediately translated into reduced tax liabilities.
In 2022 the smoothing process from past increases resulted in a ‘billable’ assessed value which is about 2/3 of the estimated decline for 2022. However, because the pipeline of past increases is now exhausted, the decrease in actual AV in 2022 will continue to exert downward pressure on billable as- sessed value and property tax revenues for at least the next 2-3 years. (Based on explanations from the NYC Dept of Finance, and the NYC Independent Budget Office (April 2021).
[24] A recent NYT article (Sept 15, 2021) on the future of the Empire State Building reports that all of the ten- ants who left or plan to leave the building were in leases that expired during the pandemic (about five percent of total leases). One tenant who chose to stay was able to negotiate significant reductions in price per square foot. Retail businesses at the base of the Empire State Building also suffered signifi- cant losses. https://www.nytimes.com/interactive/2021/09/15/nyregion/empire-state-building-reopen- ing-new-york.html
[25] As an indication of how developers try to influence market perceptions, the comments of Steven Roth, CEO of Vornado Real Estate, are illustrative. See https://www.barrons.com/amp/articles/vornado-stock- is-stupid-cheap-its-ceo-says-what-to-know-51618225200
[26] The legal basis for the large differential in NYC result from the class shares set under NY’s property tax classification system. From an economic perspective the large differential between commercial real estate’s market value and it share of total property taxes reflects the economic strength of NYC and its major firms. While the classification rules would call for an adjustment in nominal tax rates on commercial property in order to maintain the legal class shares, a major question for NYC finances is whether the city will be able to maintain the high commercial to residential differential under the pan- demic shock. This is one of the big unknowns facing NYC’s finances going forward.
[27] NYC’s tax revenues in FY 2021 were buttressed by an 11% increase in revenue from the personal income tax, reflecting strong increases in compensation in finance and other key sectors (including a 20% in- crease in average wages in the professional sector, as shown in Figure 4).
[28] In a study of property tax performance during and after the Great Recession, Chernick, Newman and Reschovsky (2021) found that central city property tax revenues respond to changes in residential home values with a lag of several years. Property tax revenues actually increased in the first two years following the collapse in housing prices, but then declined by 12 percent over the next 5 years.
[29] For 149 big US cities, Chernick and Reschovsky (2019) found that education aid was by far the most equalizing of all categories of state aid, but the range across states was substantial. As one example, Florida had very little de facto equalization between cities.
[30] For example, the following is a quote from a recent article in the New York Times (NYT, 6/30/2021). “Last April, real estate markets across the United States virtually ground to a halt as most viewings and closings were put on hold. A year later, we’re looking forward to what could be one of the most active seasons on record in recent years. Available at https://www.forbes.com/sites/forbesrealestatecoun- cil/2021/04/23/the-effects-of-remote-work-on-real-estate-across-the-us/?sh=1dd5a4f362a3
[31] Fueled by the pandemic, The NYT (7/8/21) reports a big increase in demand for space by life-science firms, some of which is being achieved by conversion of existing office space. “Across the 6 largest U.S. life sciences markets, more than 20% of the laboratory spaces being built are conversions from offices.” Hubs for the life-sciences are in Boston, San Francisco, and San Diego, but there is also substantial con- version activity in Seattle, Philadelphia, New York and Chicago.
[32] A study of space usage (General Services Administration -Gensler, 2012). shows benchmark amounts of SPW for a selected set of occupations and industries, including architecture and legal services. Mean estimates range from 103 square feet per worker (SFW) for call centers, to 335 SFW for legal services. The Gensler data were not available for enough industries to allow to use their estimates, but they appear to be consistent with the notion that higher paid occupations typically use more space per worker.
[33] This assumption is equivalent to a constant elasticity of demand for SPW with respect to the average wage, with a value equal to 1.0.
[34] Those consulted include Don Liebman, Attorney at Tuchman Korngold Weiss and Liebman, Philip Pitruzzello, Corporate Real Estate, Peter Riguardi, Chairman and President, New York Region, Licensed Real Estate Broker, Jones Lang LaSalle Brokerage, Inc., and Phoebe Holtzman, Senior Director of Re- search for the New York/Tri-State Region, Jones Lang LaSalle Brokerage, Inc.
[35] Our methodology assumes that the change in demand for space is proportional to the percent of days WFH. We recognize that the actual relationship may be non-linear, with the decrease in space propor- tionately greater for higher proportions of WFH. For example, while shared offices – one way of reduc- ing SPW – may not be efficacious if employees are at the office more than 3 days per week, sharing may be more feasible at less than 2 days per week in the office.
[36] “Google is adopting a series of changes to give its employees greater workplace flexibility as the tech giant prepares for an updated, post-pandemic return to normalcy.” https://www.forbes.com/sites/ forbesrealestatecouncil/2021/04/23/the-effects-of-remote-work-on-real-estate-across-the-us/?sh=1d- d5a4f362a3
[37] The latest report from the NYS Comptroller (Di Napoli, 2021) shows that while local sales tax receipts in NYS 20(January – June 2021) have fully rebounded from 2020, NYC has lagged the recovery, with its receipts still below 2020.
[38] However, these authors argue that the smaller effect on house prices (which are more forward looking than rents) suggests that the revaluation of urban real estate is likely to be a relatively transient phenomenon.