Kansas: Who Pays? 6th Edition
KANSAS
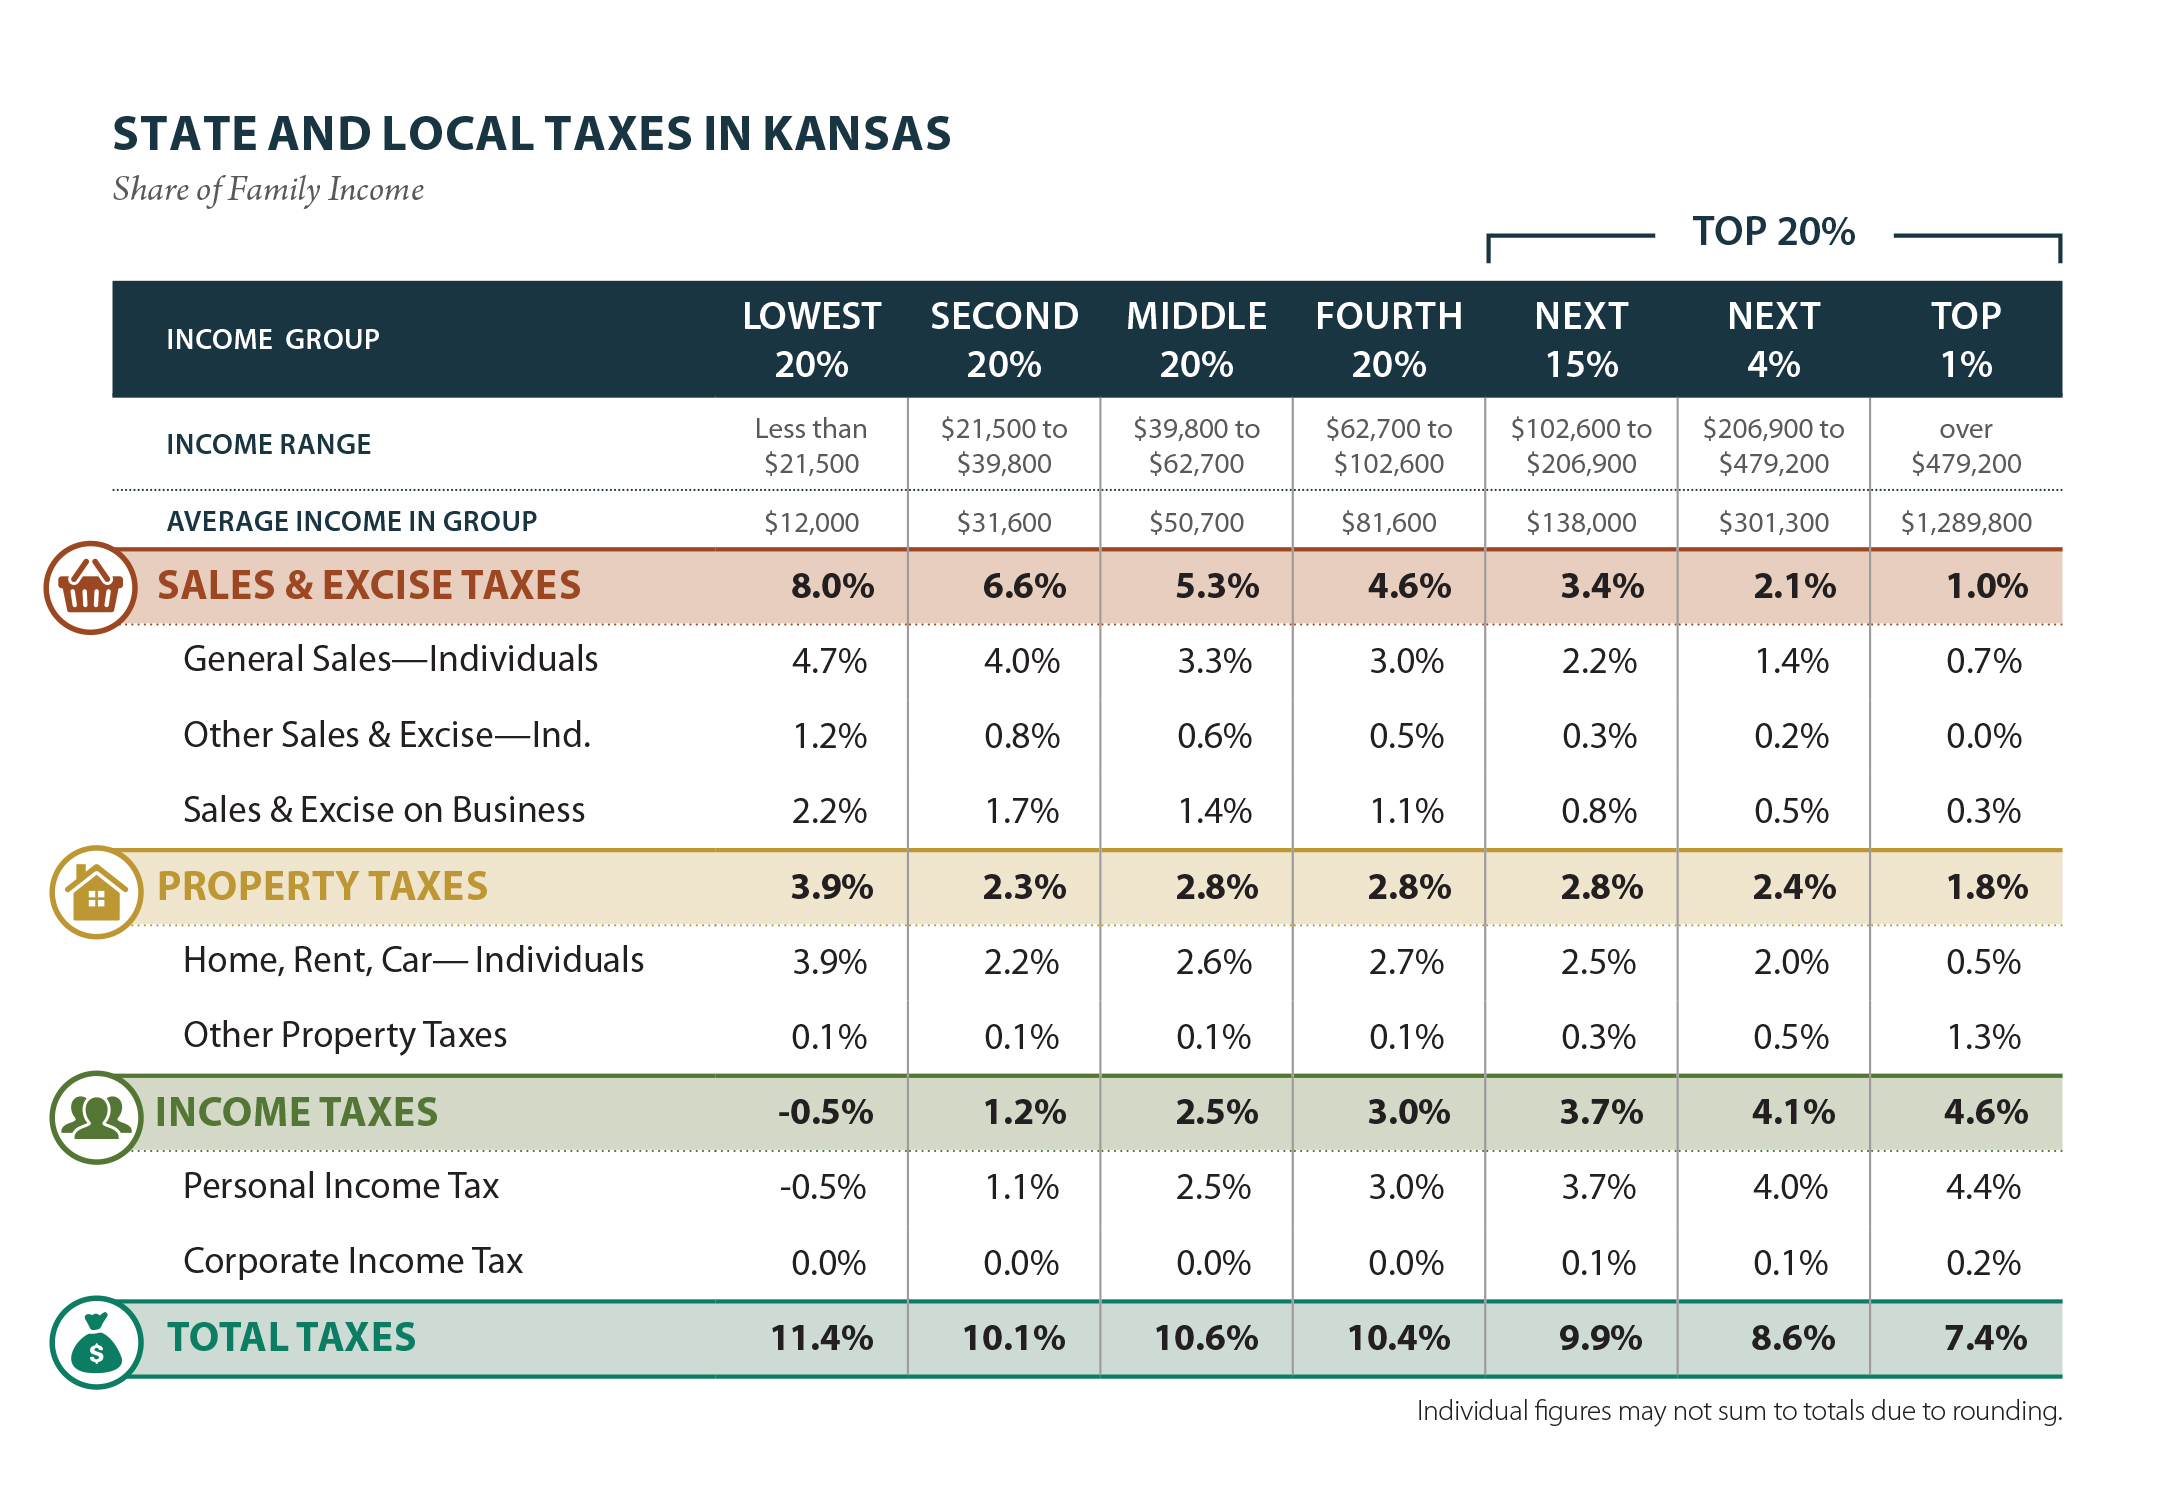
KANSAS STATE AND LOCAL TAXES
Taxes as Share of Family Income
| Top 20% | |||||||
|---|---|---|---|---|---|---|---|
| Income Group | Lowest 20% |
Second 20% |
Middle 20% |
Fourth 20% |
Next 15% |
Next 4% |
Top 1% |
| Income Range | Less than $21,500 |
$21,500 to $39,800 |
$39,800 to $62,700 |
$62,700 to $102,600 |
$102,600 to $206,900 |
$206,900 to $479,200 |
over $479,200 |
| Average Income | $12,000 | $31,600 | $50,700 | $81,600 | $138,000 | $301,300 | $1,289,800 |
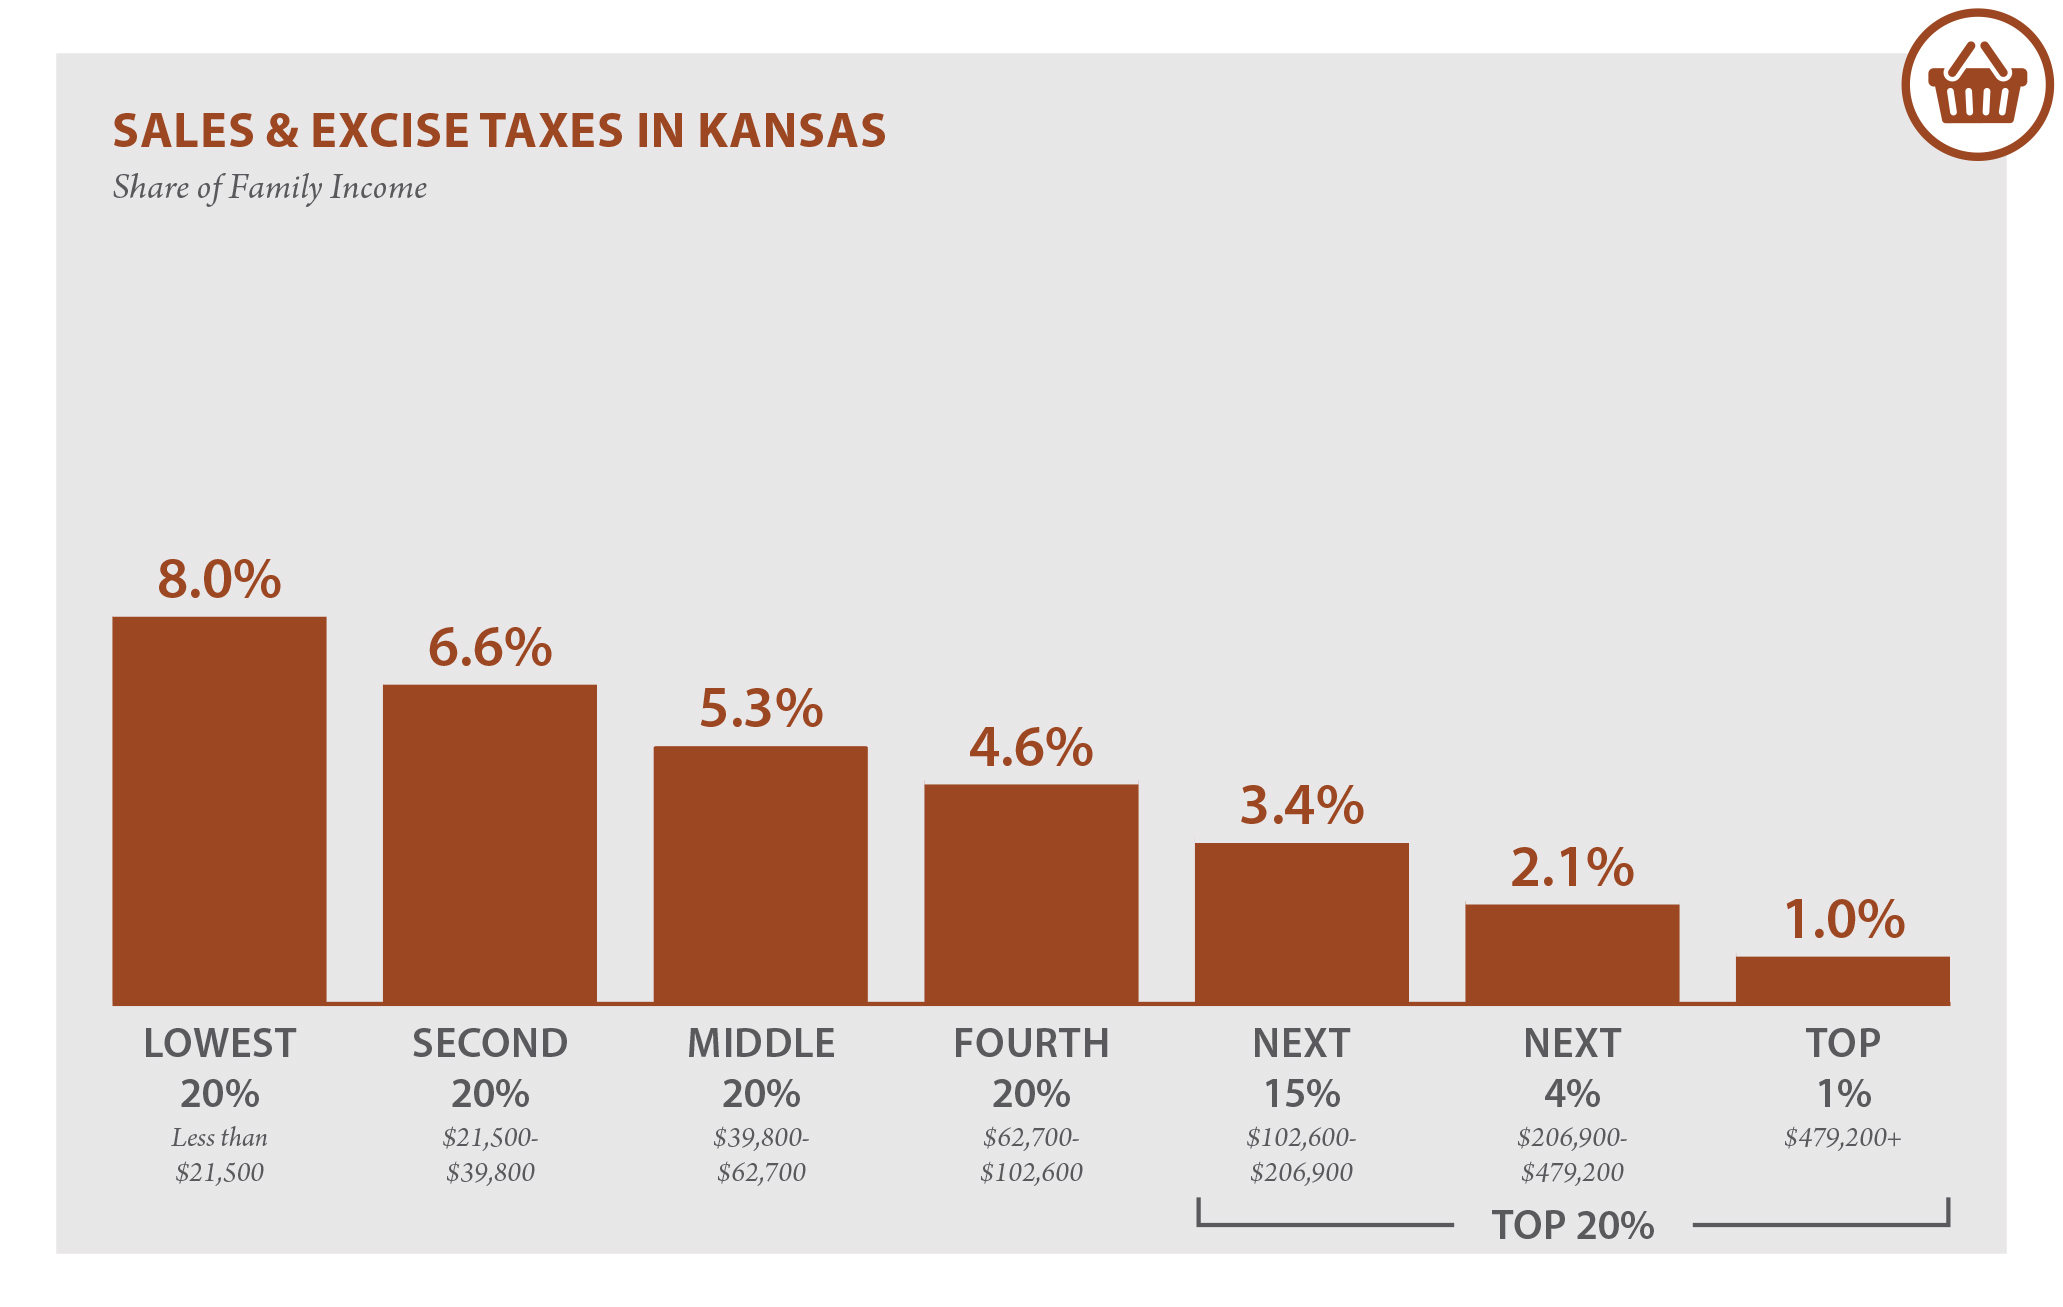
| Sales & Excise Taxes | 8.0% | 6.6% | 5.3% | 4.6% | 3.4% | 2.1% | 1.0% |
| General Sales – Individuals | 4.7% | 4.0% | 3.3% | 3.0% | 2.2% | 1.4% | 0.7% |
| Other Sales & Excise – Ind. | 1.2% | 0.8% | 0.6% | 0.5% | 0.3% | 0.2% | 0.0% |
| Sales & Excise on Business | 2.2% | 1.7% | 1.4% | 1.1% | 0.8% | 0.5% | 0.3% |
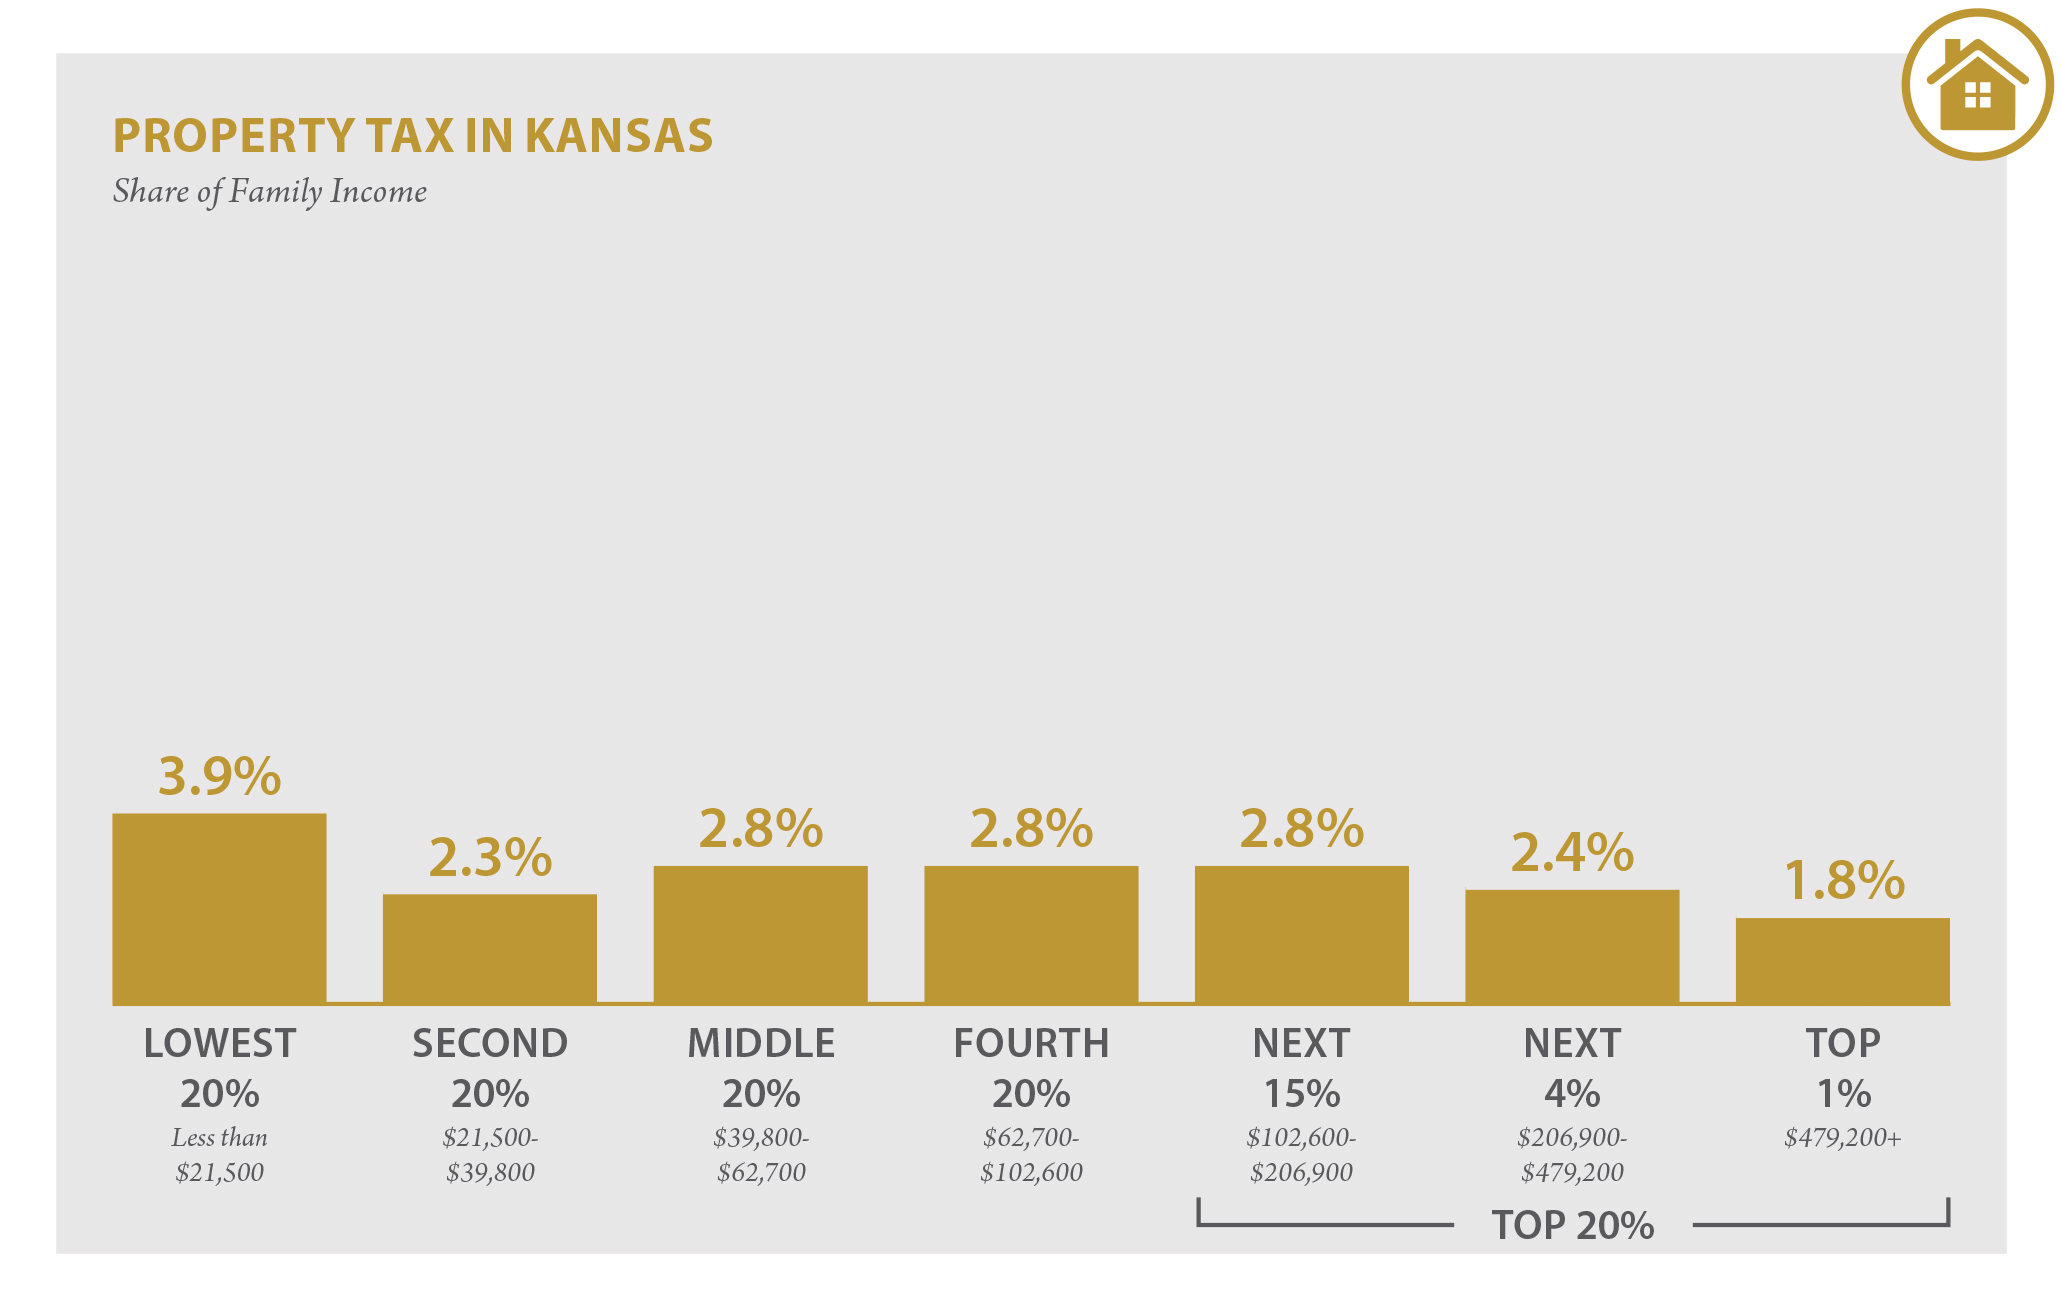
| Property Taxes | 3.9% | 2.3% | 2.8% | 2.8% | 2.8% | 2.4% | 1.8% |
| Home, Rent, Car – Ind. | 3.9% | 2.2% | 2.6% | 2.7% | 2.5% | 2.0% | 0.5% |
| Other Property Taxes | 0.1% | 0.1% | 0.1% | 0.1% | 0.3% | 0.5% | 1.3% |
| Income Taxes | -0.5% | 1.2% | 2.5% | 3.0% | 3.7% | 4.1% | 4.6% |
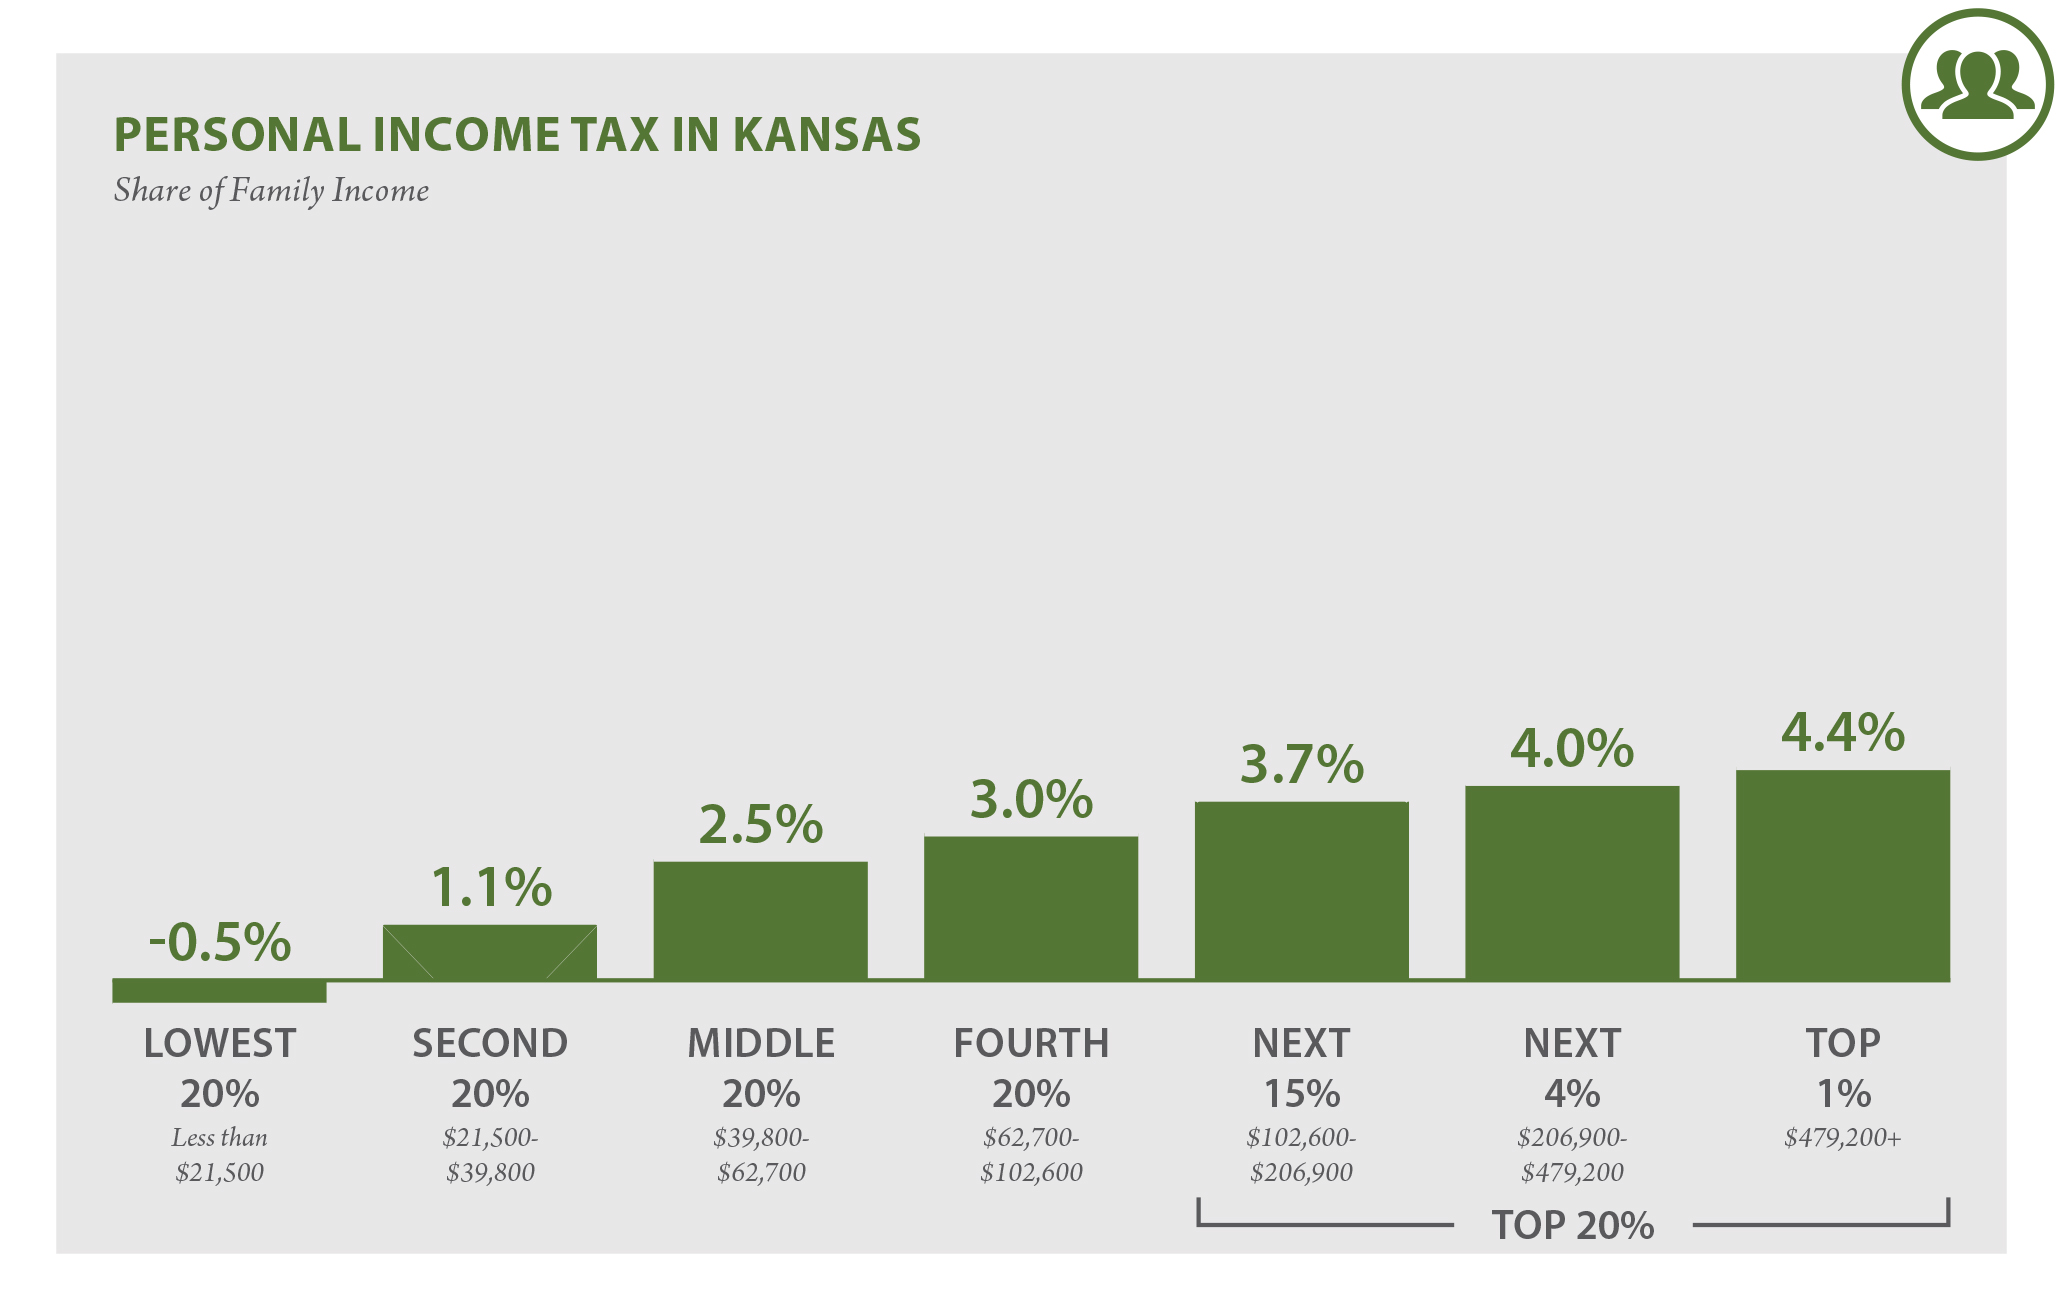
| Personal Income Tax | -0.5% | 1.1% | 2.5% | 3.0% | 3.7% | 4.0% | 4.4% |
| Corporate Income Tax | 0.0% | 0.0% | 0.0% | 0.0% | 0.1% | 0.1% | 0.2% |
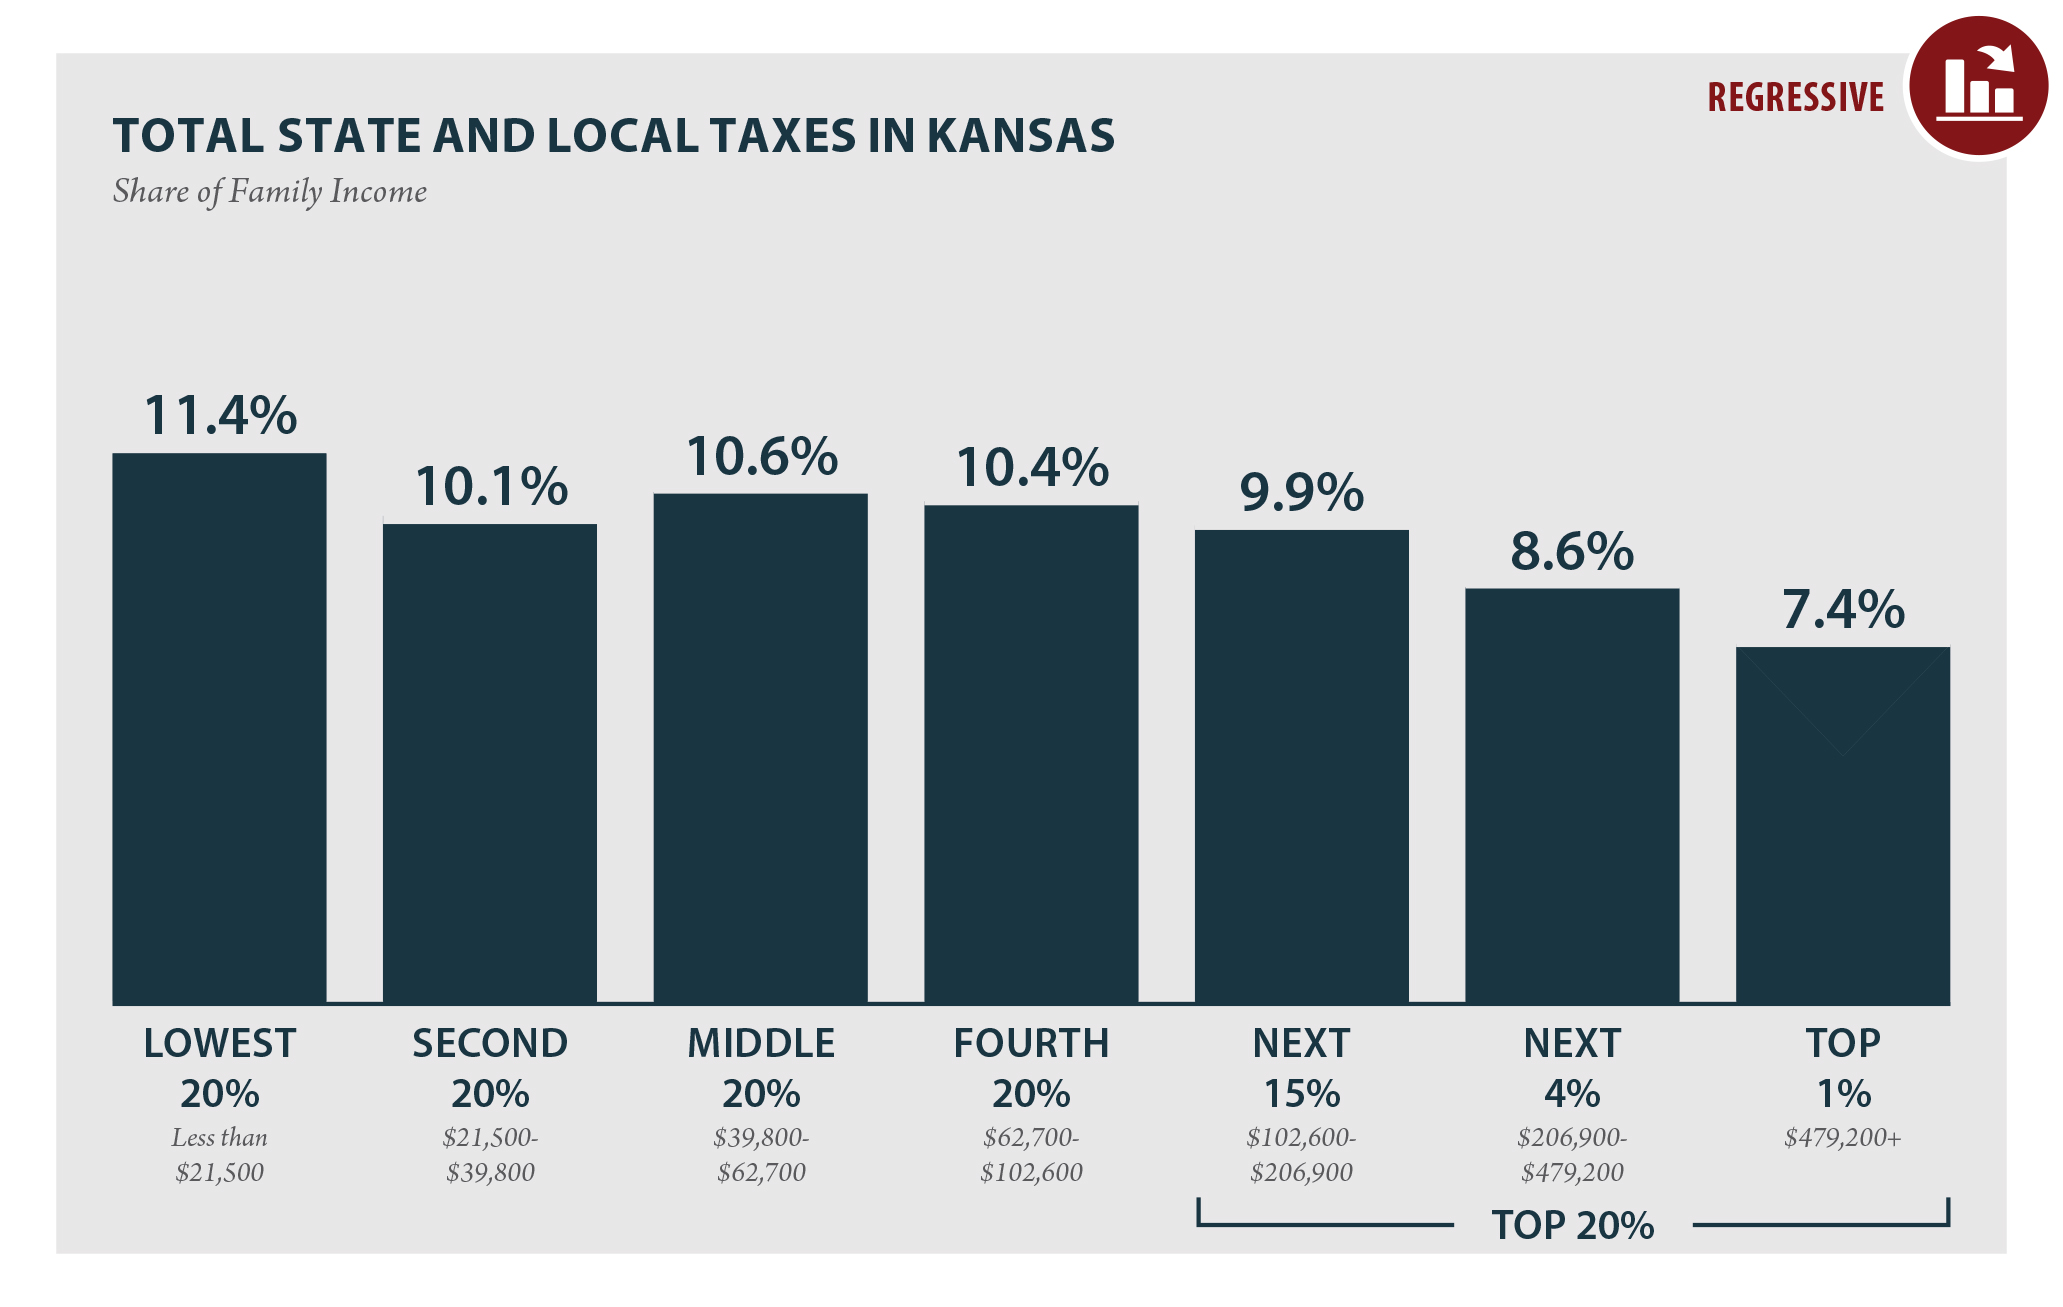
| TOTAL TAXES | 11.4% | 10.1% | 10.6% | 10.4% | 9.9% | 8.6% | 7.4% |
Individual figures may not sum to totals due to rounding. Download the table
TAX FEATURES DRIVING THE DATA in Kansas

Progressive Features |
Regressive Features |
|---|---|
|
|
ITEP Tax Inequality Index
According to ITEP’s Tax Inequality Index, which measures the impact of each state’s tax system on income inequality, Kansas has the 23rd most unfair state and local tax system in the country. Incomes are more unequal in Kansas after state and local taxes are collected than before. (See Appendix B for state-by-state rankings and the methodology section for additional detail on the index.)
Note: Figures show permanent law in Kansas enacted through September 10, 2018, at 2015 income levels. Allowable itemized deductions and the child care expense credit reflect fully phased-in levels (tax year 2020). Top figure represents total state and local taxes as a share of non-elderly income. The sixth edition of Who Pays does not include the impact of the federal deduction for state and local taxes (SALT) because policy changes in the 2017 federal Tax Cuts and Jobs Act temporarily limited the extent to which the SALT deduction functions as a generalized offset of state and local taxes.