Extensions of the New Tax Law’s Temporary Provisions Would Mainly Benefit the Wealthy
reportAuthors

Download the National and 50-State Tables for 2018 and 2026.
In December of 2017, President Donald Trump and Congress enacted a tax law that provided most of its benefits to high-income households and foreign investors while increasing taxes on some Americans. The new law, the Tax Cuts and Jobs Act (TCJA) is more harmful to low- and middle-income households in years after 2025 because the tax cuts benefiting them are scheduled to expire at the end of that year, while some provisions raising their taxes are permanent. Proponents of the law now propose to enact legislation that would make permanent the temporary tax provisions and often describe this as a proposal to make permanent the “middle-class tax cuts.” These proponents implicitly acknowledge that many of the provisions of the tax law that are permanent — like the cut in the corporate tax rate — mainly help high-income households. They argue that the temporary provisions are ones that benefit the middle-class and that even those who opposed TCJA should support making permanent or extending these provisions.
This analysis finds that extending the temporary tax provisions in 2026 would not be aimed at helping the middle-class any more than TCJA as enacted helps the middle-class in 2018. As illustrated in the graph below, the richest fifth of Americans will receive 71 percent of the benefits of the law in 2018. This same group would receive 65 percent of the benefits of an extension of the temporary provisions in 2026 and would receive 71 percent of the benefits of the proposed extension combined with TCJA as already enacted.
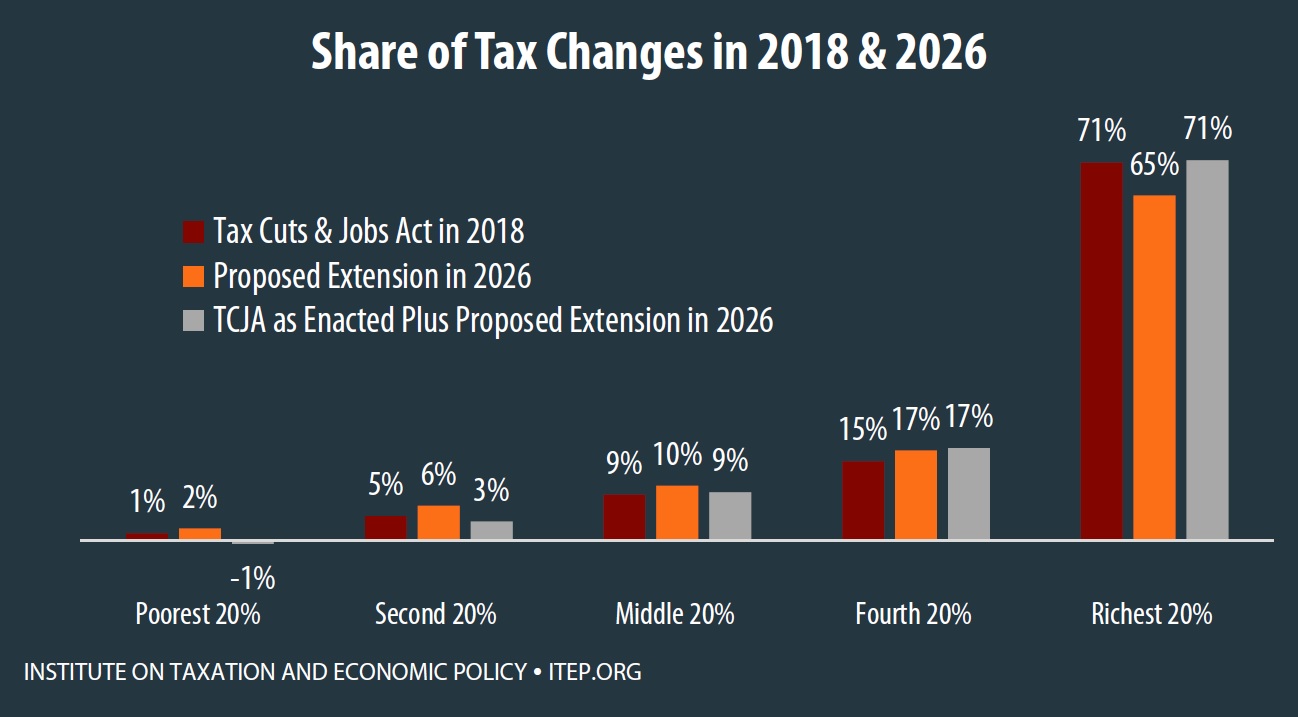
In other words, a proposal to extend the temporary tax provisions, whether considered on its own or in combination with the permanent provisions of the new tax law already enacted, would be mainly geared towards helping the richest fifth of households. The graph below breaks the richest fifth down into smaller groups.
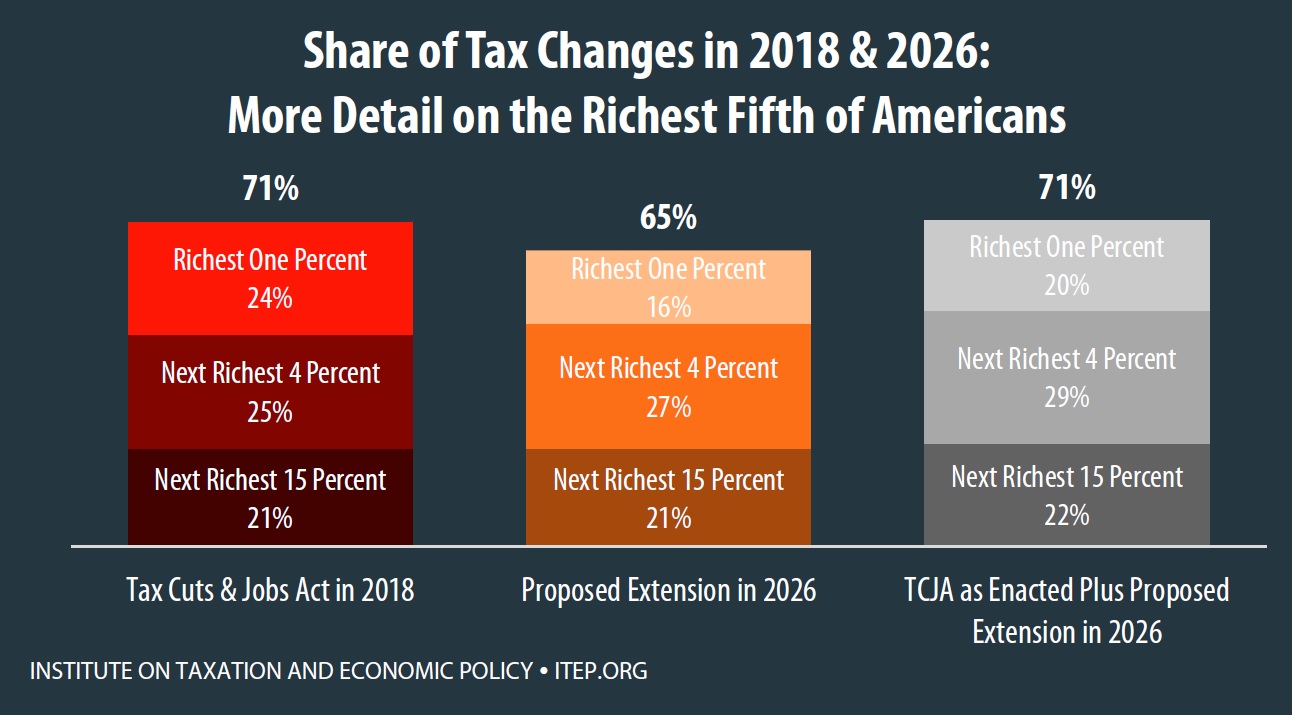
While it is true that certain provisions benefiting high-income individuals (like the cut in the corporate tax rate) were made permanent in TCJA, several other provisions benefiting this group (like the deduction for “pass-through” business income and the cut in the estate tax) are among the temporary provisions. This is why an extension of the temporary provisions would mainly help the well-off.
At the same time, the temporary provisions include some that can raise taxes on high-income households, like the cap on deductions for state and local taxes (SALT). In three states that are particularly affected by the SALT cap (California, New Jersey and New York), the average tax change for the richest one percent in 2026 is a tax hike rather than a tax cut. (State-by-state data are available for download.)
As already mentioned, the permanent provisions in TCJA (the provisions that would still be in effect in 2026 unless repealed) are ones that raise taxes on low- and middle-income people. These include the switch to a slower inflation adjustment (what economists call the chained consumer price index) and the law’s repeal of the health insurance mandate under the Affordable Care Act. (Repeal of the mandate results in fewer individuals receiving tax credits under the ACA to obtain health insurance, thereby raising taxes for some low- and middle-income people.)
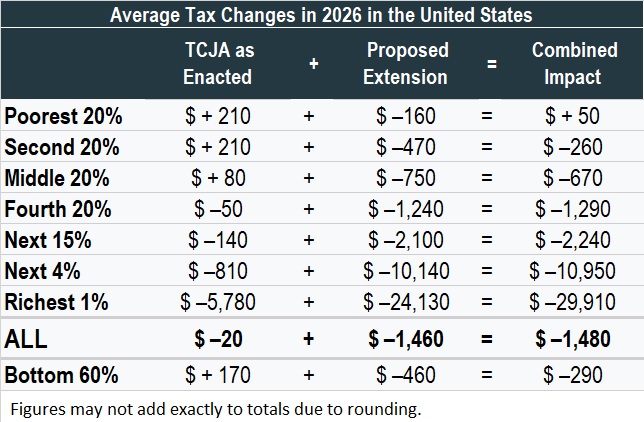
For some working-class Americans, the extension of the temporary provisions would provide tax cuts, but not enough to offset the tax increases from these permanent provisions that are already enacted. As illustrated in the graph on the first page, the share of benefits received by the poorest fifth of Americans from the combination of TCJA and the extension of temporary provisions in 2026 would be negative. That would happen because the average tax change for this group would be a tax hike rather than a tax cut even after the temporary provisions are extended. The table on the following page illustrates how this math would work for the average taxpayer in each income group.
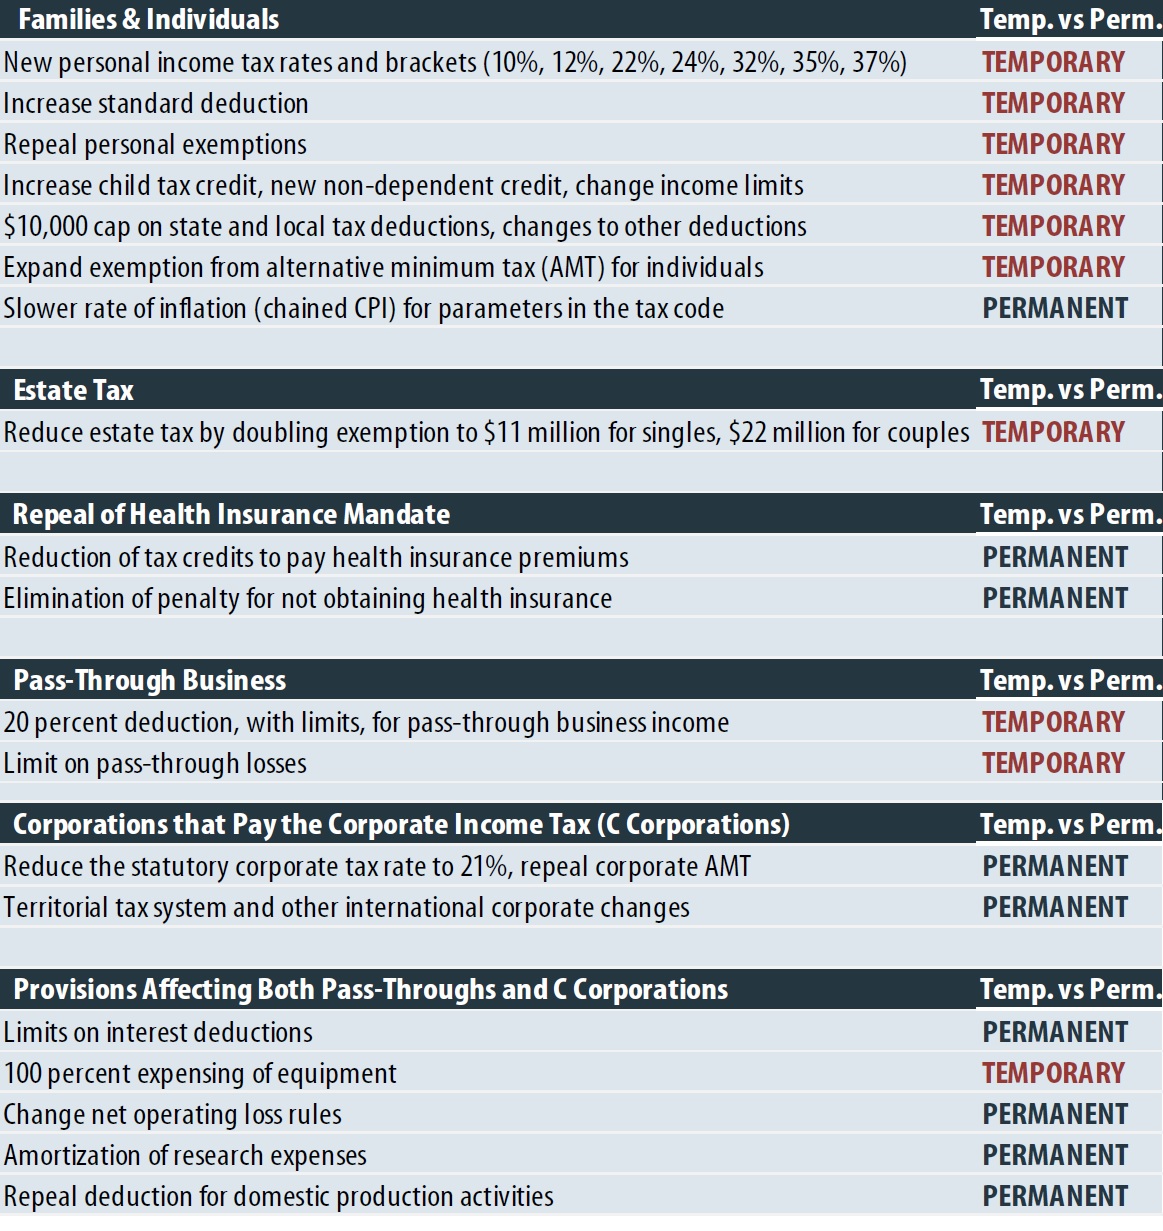
This analysis uses ITEP’s microsimulation model, which generates tax estimates for a sample of representative taxpayer records from each state. The analysis accounts for all the major provisions of the Tax Cuts and Jobs Act, which generally includes any provision that Congress’s official revenue-estimator (the Joint Committee on Taxation, or JCT) projected would raise or lose more than $50 billion over a decade. More detail on the methodology can be found in the appendix. The table below lists these provisions and indicates whether each is temporary or permanent.
The provisions can be thought of as being grouped in the following categories.
- Provisions for Families and Individuals
The tax changes that affect families and individuals most directly, the provisions that most families think of as affecting their bottom line, are a mixed bag for low- and middle-income people. Some of these provisions cut their taxes, like the increase in the standard deduction and child tax credit. Others raised their taxes, like the repeal of the personal exemption that taxpayers can claim for each member of their family and the new $10,000 limit on the deduction for state and local taxes (SALT). Some high-income taxpayers face tax hikes because of the limit on SALT deductions, but others benefit more from the reduction in the top personal income tax rate from 39.6 percent to 37 percent, as well as other breaks in the law.
- Estate Tax Breaks
One break that favors the wealthy is the law’s provision to double the amount of assets that can be left to heirs without triggering the estate tax from $11 million for a married couple to $22 million. Even prior to passage of the new law, only 0.2 percent of estates were taxed, which means reducing the estate tax could only benefit the very wealthiest families.
Note: This analysis assumes that all the temporary provisions listed here would be included in the proposal to extend provisions that expire, except for 100 percent expensing of equipment. This business tax break mainly benefits the owners of corporate stocks and other business assets, who are mostly (but not exclusively) high-income households. If Congress includes extension of this provision along with the others, the richest households would receive even larger tax breaks than estimated in this analysis.
- Repeal of Health Insurance Mandate
The law repealed the requirement for individuals to obtain health insurance. The figures in this report incorporate estimates of the Congressional Budget Office on how this change would affect taxes. The penalty tax that was imposed on those who do not obtain health insurance was eliminated, which reduced taxes for some. But a larger group of people pay higher taxes because when they go without health insurance, they no longer collect the tax credits that help them pay premiums under the Affordable Care Act.
- Corporate Tax Breaks
As explained in the methodology discussion in the appendix, economists generally agree that the benefits of corporate tax cuts initially go to those who own stocks in American corporations. Recent research has concluded that foreign investors own 35 percent of stocks in American corporations and would therefore receive a significant share of the benefits from corporate tax cuts.
Many economists believe that by the end of the decade some of the benefits of a corporate tax cut go to workers in the form of higher wages. It is very unclear when or if this would ever happen. But ITEP follows the approach of Congress’s official revenue estimator, JCT, in assuming that a share of the benefits from a corporate tax cut will eventually go to workers, and that share will gradually grow to one-fourth of the total benefits in the tenth year after enactment. But even this assumption does not change the fact that the corporate tax cuts provide the richest taxpayers with the greatest benefits.
- Tax Breaks for Other Businesses (Pass-Through Businesses)
The law also includes a 20 percent deduction, with certain limits, for income from pass-through businesses, which are businesses with profits subject to the personal income tax instead of the corporate income tax. While some equate these enterprises with “small businesses,” they include law firms, hedge funds and many enormous companies. Most pass-through income flows to the richest one percent of Americans.
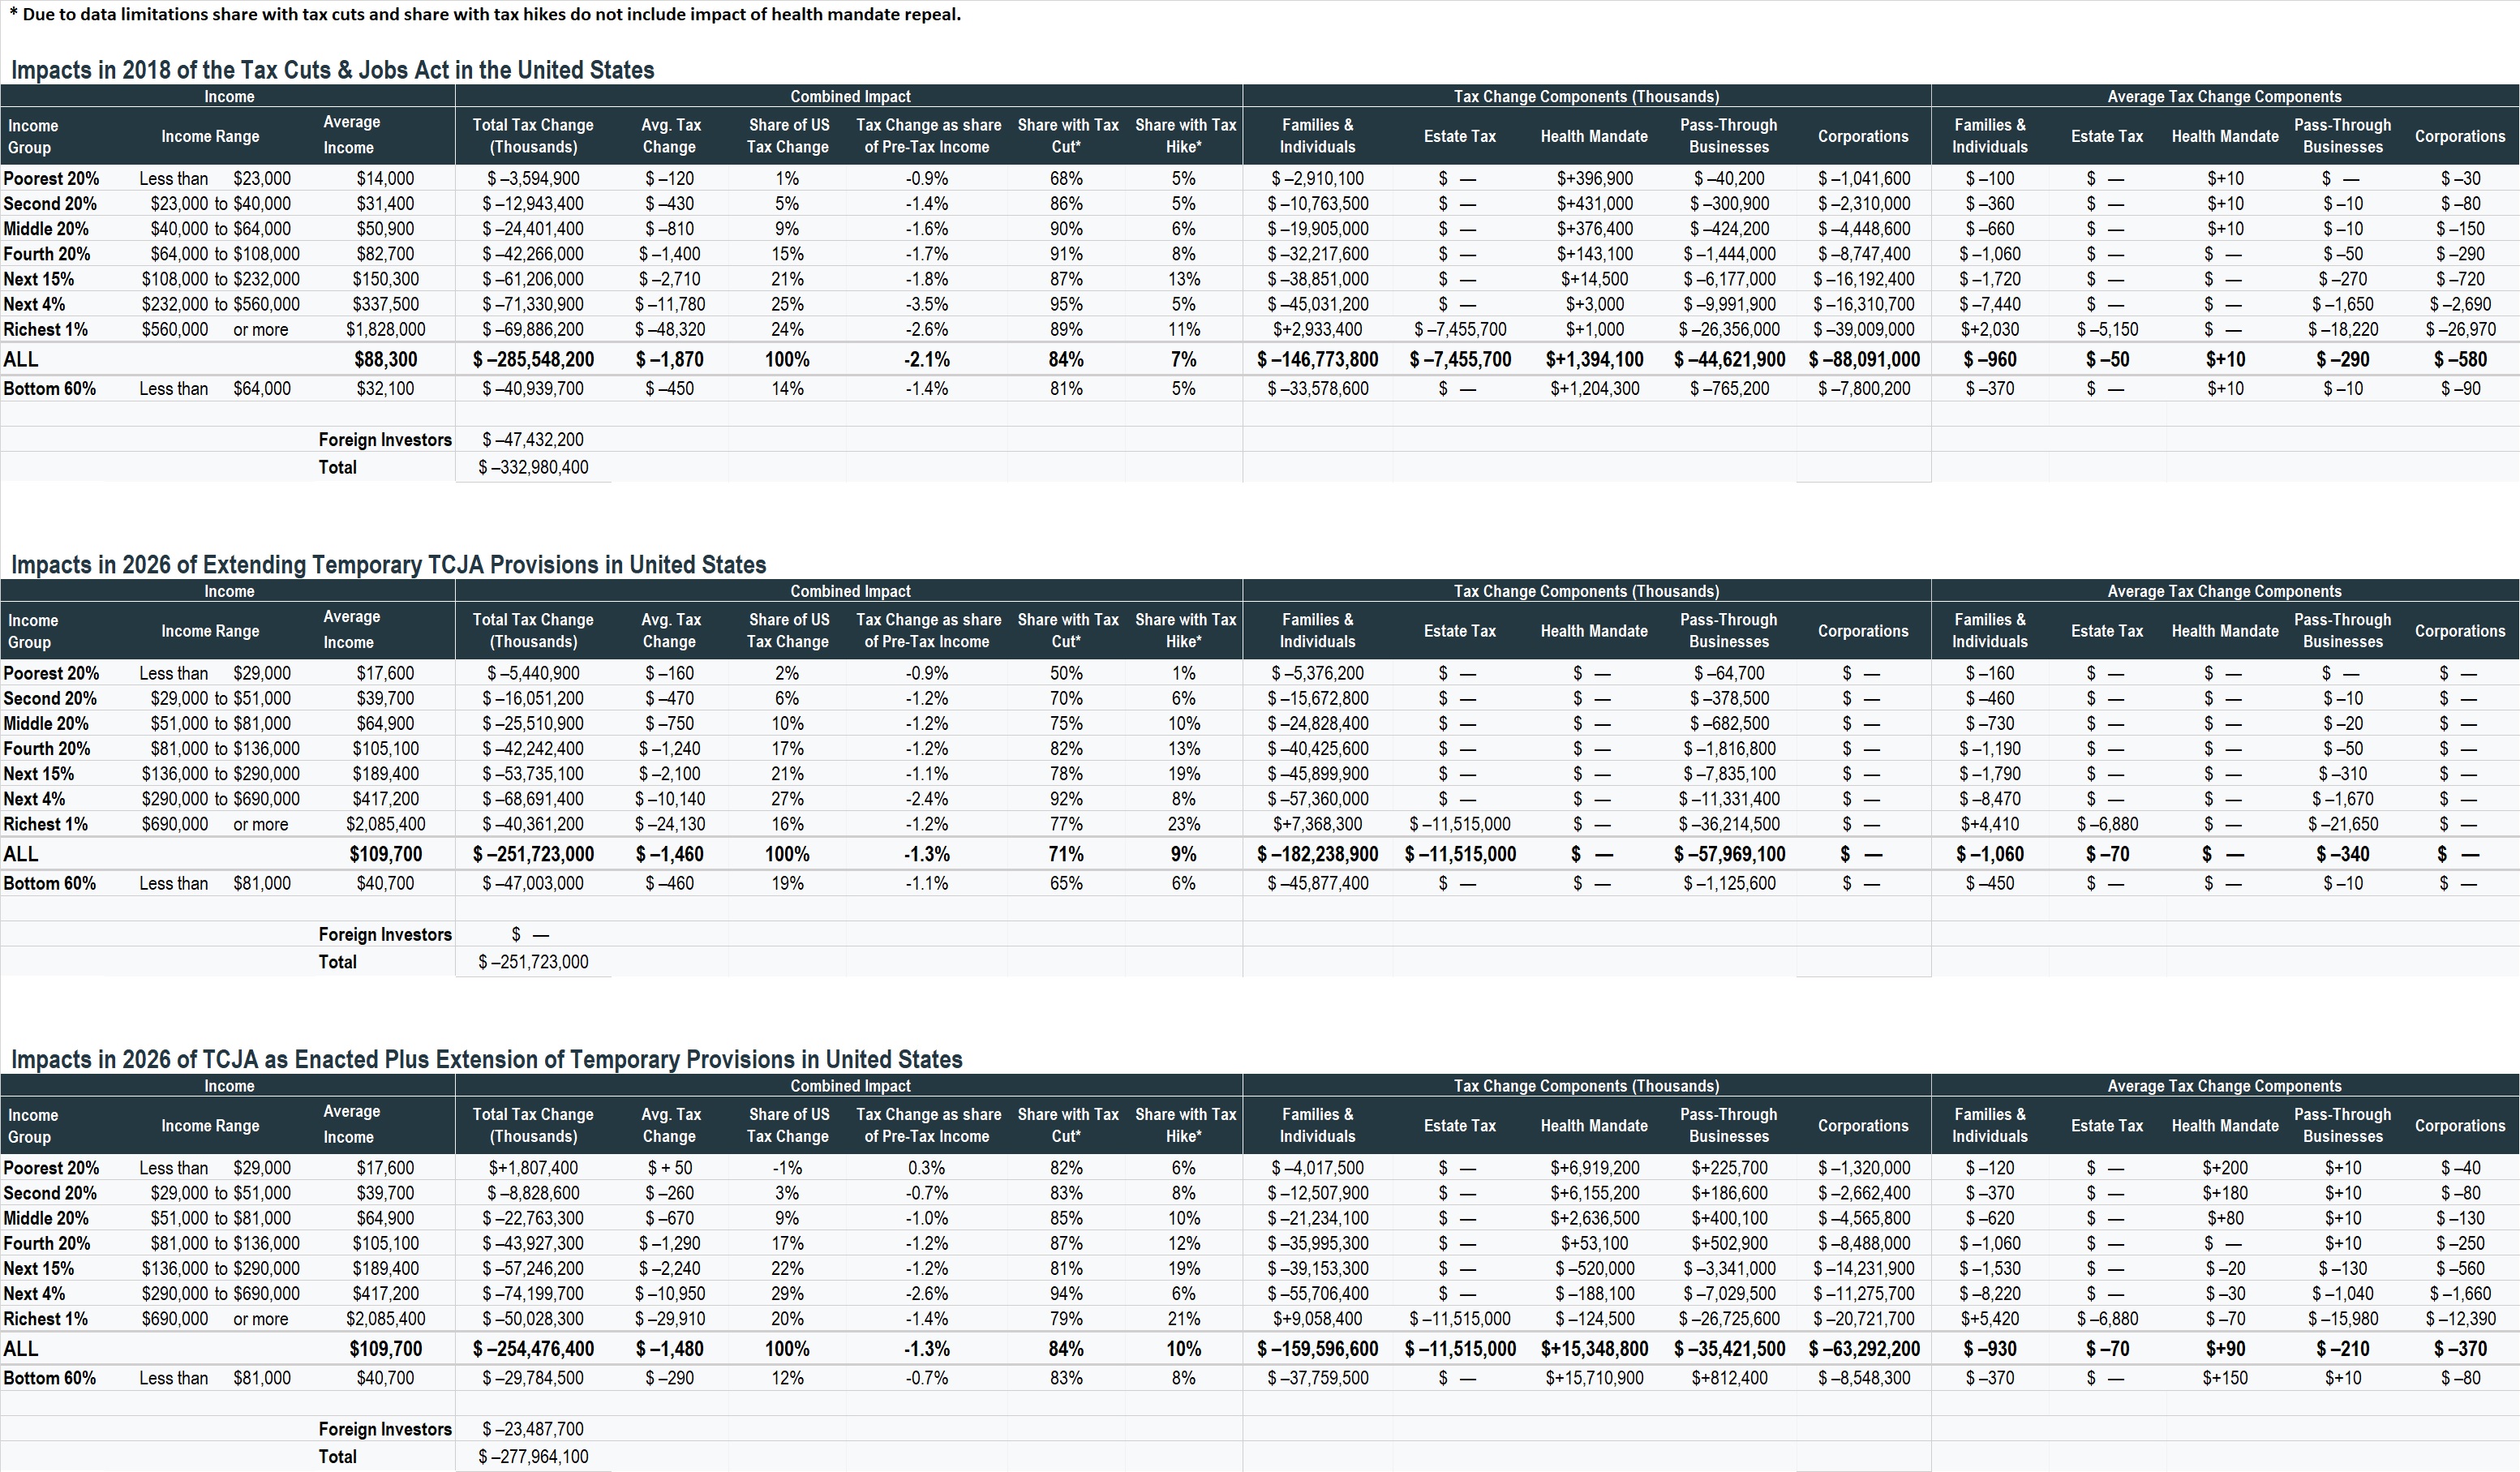
The tables below include figures used in this analysis and more detail to illustrate how the effects of these different provisions add up in 2018 and 2026. (This data is also available for download.)
(Click to enlarge.)
Some proponents of tax cuts argue that the types of figures provided in this analysis so far are not relevant because income is so unequal. Rich households, they argue, naturally receive a larger share of tax cuts and larger average tax cuts than others because rich households have so much more income than others. However, even when the tax cuts are measured as a share of income, they are larger for the rich than for everyone else. As illustrated in the graph below, the richest one percent and the next richest four percent both receive larger tax cuts, measured as a share of their income, than other groups in both 2018 and 2026.
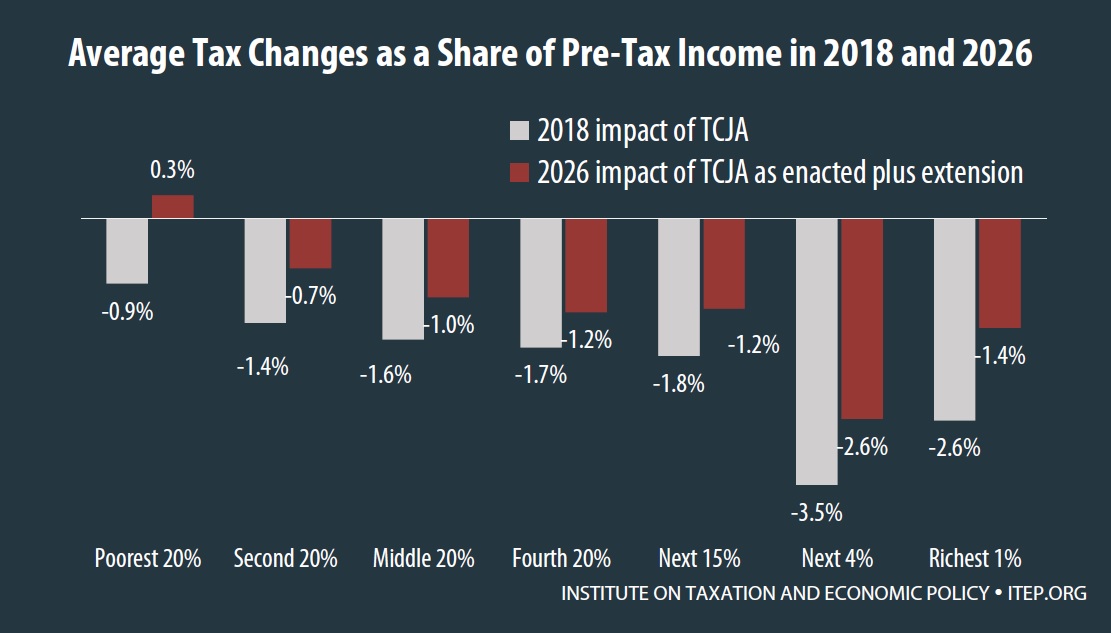
As illustrated in the graph above and in the more detailed figures, the tax law in 2026 (even assuming extension of the temporary provisions) is less generous to all income groups than in 2018, for several reasons.
For low-income households, the reduction in the number of individuals receiving tax credits to obtain health insurance under the Affordable Care Act has a greater impact in 2026, as does chained CPI.
The law is less generous to some high-income households in 2026 mainly because the business tax provisions (affecting corporations and pass-through businesses) are less generous in later years. Some provisions that raise taxes on businesses by eliminating special breaks or loopholes have a greater impact in later years. One significant business tax break (100 percent expensing of equipment) provides large breaks to corporate shareholders and business owners in the early years and is scheduled to phase down so that it has little effect in 2026 and expires at the end of that year. The provision allows businesses to claim deductions for investing in equipment earlier than they otherwise would, which results in a large revenue loss in 2018 but some revenue increase in later years like 2026. This analysis assumes that this provision would be unchanged. But if this break is also extended, then the total tax breaks going to the richest households in 2026 would be even larger than estimated here.
Appendix
Methodology
This analysis takes into account the major provisions of the Tax Cuts and Jobs Act, generally defined as any provision that raises or loses more than $50 billion over a decade according to the Joint Committee on Taxation (JCT).
The one exception to this approach is that this analysis does not incorporate the provision to impose a one-time tax, at reduced rates, on the profits that American corporations are officially holding offshore. This proposal, which is sometimes called a “deemed repatriation,” raises revenue during the official 10-year budget window and is technically a tax increase. But this provision is a significant break to many, if not most, American multinational corporations and the revenue raised would be temporary. As another ITEP report explains, this provision would, in the long-run, reduce taxes for American multinational corporations by hundreds of billions of dollars.[1]
The provisions included in our analysis account for 98 percent of the revenue raised and 92 percent of the revenue lost (excluding the deemed repatriation) according to JCT.
Provisions affecting individuals are modeled using ITEP’s microsimulation model, which generates tax estimates for a sample of representative taxpayer records from each state.[2] When estimating the impact of corporate tax changes, ITEP uses JCT’s revenue estimates for guidance on a provision’s overall impact and then calculates the distribution of benefits or costs among taxpayers.[3] ITEP follows JCT’s approach in assuming that in the short run, a corporate tax cut will benefit the owners of corporate stocks alone, but in the long run (usually assumed to be ten years after enactment) a quarter of the benefits will flow to workers.[4]
ITEP differs from JCT in that we have updated our approach to account for new research that finds 35 percent of American corporate stocks are owned by foreign investors, a larger fraction than we previously assumed. [5] This means that whatever portion of benefits flows to owners of corporate stocks (100 percent in the short-run, three-fourths in the long-run), one can assume that 35 percent of that amount flows to foreign investors.
This approach to corporate tax changes is applied to provisions that entirely affect C corporations (companies that pay the corporate tax), such as the reduction in the corporate income tax rate. For provisions that affect both C corporations and pass-through businesses, this approach is applied to the portion of the provision’s tax cut or tax hike that would fall on C corporations.
To estimate the effects of repealing the ACA’s individual mandate to obtain health insurance, we begin with CBO’s estimates of the change in tax revenue that would result from this provision. For example, CBO has estimated that by 2027 repealing the mandate would result in $6 billion less collected from the penalty for not obtaining health insurance (because the penalty would be eliminated) and $28 billion in savings from what CBO calls “changes in subsidies for coverage through marketplace and related spending and revenues.”[6] In another document, CBO breaks down baseline revenue and spending impacts under current law of what it calls “Nongroup Coverage and the Basic Health Program,” which appears to be the same thing and shows that premium tax credits make up 79 percent of that category.[7]
This analysis therefore assumes that of the $28 billion in savings that CBO projects for 2027 from changes in subsidies for coverage that would result from repealing the mandate, 79 percent of that amount, or about $22 billion, is a reduction in premium credits paid out that year. To estimate the distribution of these amounts across income groups in each state, this analysis begins with the distribution of penalty payments paid and premium tax credits received in each state in 2015 according to the most recent IRS data.[8] The distribution of the reduction in these amounts under this bill is assumed to be similar, with adjustments for the shift to later years.
[1] Institute on Taxation and Economic Policy, “Multinational Corporations Would Receive At Least $458 Billion in Tax Breaks from Congressional Repatriation Proposals,” November 5, 2017. https://itep.org/multinational-corporations-would-receive-over-half-a-trillion-in-tax-breaks-from-the-house-repatriation-proposal/
[2] ITEP Microsimulation Tax Model Overview. https://itep.org/itep-tax-model
[3] Joint Committee on Taxation, “Estimated Budget Effects Of The Conference Agreement For H.R.1, The ‘Tax Cuts And Jobs Act’” JCX-67-17. https://www.jct.gov/publications.html?func=startdown&id=5053
[4] Joint Committee on Taxation, “Modeling the Distribution of Taxes on Business Income,” JCX-14-13, October 16, 2013. https://www.jct.gov/publications.html?func=startdown&id=4528
[5] Steven M. Rosenthal, “Slashing Corporate Taxes: Foreign Investors Are Surprise Winners,” Tax Notes, October 23, 2017. https://www.taxnotes.com/tax-notes/corporate-taxation/slashing-corporate-taxes-foreign-investors-are-surprise-winners/2017/10/23/1x78l
[6] Congressional Budget Office, “Repealing the Individual Health Insurance Mandate: An Updated Estimate,” Table 1, November 8, 2017. https://www.cbo.gov/publication/53300
[7] Congressional Budget Office, “Federal Subsidies for Health Insurance Coverage for People Under Age 65: 2017 to 2027,” September 14, 2017, Table 2. https://www.cbo.gov/publication/53091
[8] Internal Revenue Service, SOI Tax Statistics Historic Table 2. https://www.irs.gov/statistics/soi-tax-stats-historic-table-2