
While it can be hard to look away from the important federal policy debates occurring right now in Washington D.C., state lawmakers across the country will also be debating consequential fiscal policy changes in 2017 that will deserve close scrutiny. The context of those debates will vary by state: from coping with major revenue shortfalls, to modernizing decades-old sales and gas tax policies, to flattening or even eliminating revenue sources as vital as the personal income tax. Despite the varying details, key questions about the fairness and adequacy of state tax systems will be raised in all those discussions.
To help inform 2017 statehouse debates, ITEP released a new chart book today that examines how families at different income levels are affected by state and local tax codes. The book, based on ITEP’s Who Pays? study, concludes that:
When states shy away from personal income taxes in favor of higher sales and excise taxes, high-income taxpayers benefit at the expense of low- and moderate-income families who often face above-average tax rates to pick up the slack. Given the detrimental impact that regressive tax policies have on economic opportunity, income inequality, revenue adequacy, and long-run revenue sustainability, tax reform proponents should look to the least regressive, rather than most regressive, states in crafting their proposals.
The book contains 19 charts and focuses largely on how state tax systems differ between states that chose to rely heavily on sales and excise taxes, or on income taxes, to fund public services. Some of the book’s highlights include:
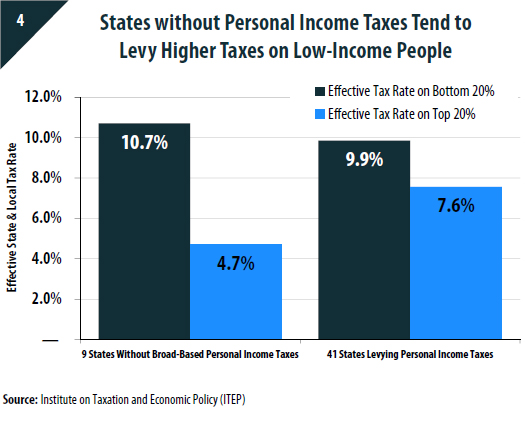
Chart 4 and Chart 5: The notion that states without income taxes are automatically “low tax” is a myth. Low- and moderate-income families often face above-average tax rates in these states.
Chart 6: Wealthy people fare extraordinarily well when states refuse to levy personal income taxes. The nine lowest-tax states for the wealthy are the nine states without income taxes.
Chart 8 and Chart 9: Flat taxes are beneficial for the wealthy, but at the expense of everyone else. Both low-income and middle-income families tend to pay more in flat tax states than in states with more progressive, graduated-rate income taxes.
Chart 10 and Chart 11: When lawmakers choose to rely heavily on sales and excise taxes to fund government, the typical result is higher taxes for low- and moderate-income families.
Chart 15: The design of a state’s income tax matters hugely in determining the overall fairness of each state’s tax system. Of the 15 most regressive state and local tax systems in the nation, 10 exist in states levying either a flat income tax or no personal income tax at all. By contrast, the 15 least regressive states all utilize a graduated-rate personal income tax.
Chart 19: The large degree of income inequality in our nation is made measurably worse by state and local tax policies. Low-income families’ already meager share of total income actually shrinks after state and local taxes are taken into account.