Read this Policy Brief in PDF Form
Everyone agrees that tax “fairness” is important—even though there is often disagreement on what fairness means. A well-informed debate on who should pay the most taxes must start by assessing who actually does pay the most—and the least. Too often taxes are studied only with an eye towards tax rates instead of an understanding of how taxes impact people depending on their income. Tax incidence analyses answer basic questions by measuring how taxpayers at different income levels are affected by the current tax system and various tax reform alternatives. This policy brief provides a basic introduction to using ITEP’s tax incidence analyses.
Understanding ITEP’s Income Groups
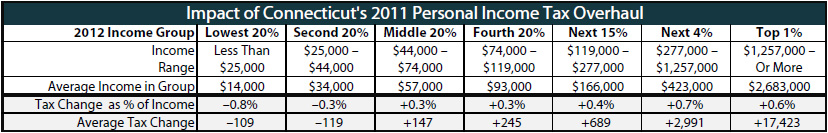
Before conducting an incidence analysis decisions must be made about which subset of the population is going to be studied. An analysis can include all families in a specific state or select groups of taxpayers. The population chosen for the analysis may depend on the tax change under discussion. For example, the table below shows the impact of Connecticut’s 2011 personal income tax overhaul on all Connecticut families. (married couples, single people, and both non-elderly and elderly residents).
The next step is to divide the population into income groups. Most ITEP analyses define income as all sources of income including salaries, wages, investment income, and retirement income. ITEP’s analyses divide the population into five groups—ranging from the poorest 20 percent to the richest 20 percent. Each of these groups is called an “income quintile.” ITEP’s analyses also split the richest 20 percent into three subgroups: the richest 1 percent of all taxpayers, the next 4 percent just below them, and then the next 15 percent after that. This is done because families in the top 20 percent have more than half of all personal income nationally and, within this quintile, there are substantial differences in income levels and tax burdens between the “poorest” members and the richest members. Incomes in this group range from what might be called upper-middle class to the richest families in the country. From a tax policy standpoint, relatively lower-income families in this group should not be treated the same as the richest families because they have very different abilities to pay. This is why ITEP’s incidence tables show them separately.
The example at the bottom of this page shows the projected income quintiles for Connecticut in 2012. The analysis shows that the poorest 20 percent of Connecticut residents are those earning less than $25,000 with an average income of $14,000. The wealthiest 1 percent of taxpayers, with incomes over $1,257,000, have an average income of $2,683,000.
Measuring Fairness: Effective Tax Rates
The next step in tax incidence analysis is to measure the impact of a tax change on different income groups. There are various ways to measure tax incidence. The most common approach is to analyze the effective tax change experienced by an income group as a percentage of that group’s income. This approach measures each group’s ability to pay most accurately. Two other helpful statistics are the average tax change for an income group and the share of the total tax change for that group.
For example, the table shows the impact of Connecticut’s 2011 personal income tax overhaul by income group. The comprehensive changes to the personal income tax (including the introduction of a new refundable Earned Income Tax Credit(EITC)) reduced the taxes of the bottom 20 percent of state residents by an average of $109, or about 0.8 percent of their income.
It is important to note that because these statistics describe the overall averages for taxpayers in each income group, the actual impact on any individual in each quintile may differ from the overall average for that income group. For example, a low-income taxpayer in the bottom income group who does not qualify for the new state EITC may see a smaller income tax cut than the average for that income group.
Important Concepts: Initial and Final Incidence, “Exported” Taxes
The concept of tax incidence is used in two ways: initial incidence and final incidence. Initial incidence tells us who is legally responsible for paying a tax to the government. Final incidence tells us who actually does.
Sometimes the initial incidence and the final incidence of a tax are very different. For example, the property tax on residential apartment buildings is paid initially by the landlords who own the buildings. From an initial incidence perspective, this tax does not affect renters who live in these buildings at all. However, landlords pass some of these taxes through to renters in the form of higher rents. So from a final incidence perspective, some of this business property tax is a tax on individuals. In fact, all business taxes ultimately end up coming out of people’s pockets (investors and ordinary workers).
For this reason, ITEP’s analyses look at final incidence. This means that ITEP’s analyses always include an estimate of taxes (if any) paid initially by businesses that are passed through to individual taxpayers. For example, an incidence analysis that studies an increase in the sales tax rate must assume that a portion of the hike at each income level is business sales taxes that have been passed through to individual consumers.
Incidence analyses must also address how taxes are exported. While all taxes are ultimately paid by individuals, some state taxes are paid (directly or indirectly) by residents of other states. ITEP’s incidence analyses generally estimate how much of a tax increase (or tax cut) is exported to residents of other states.
Tax Incidence Analysis: An Important Tool for Evaluating Tax Fairness
Tax incidence analysis is an important building block for an informed debate on issues of tax fairness. Reporting of tax incidence effects can help state lawmakers understand the impact of complicated tax changes. Few states require a comprehensive, regular analysis of the overall tax system and of proposed changes—but states such as Maine, Minnesota and Texas have created a permanent capacity for regular analyses, and most states could build a capacity at a relatively low cost.
In states lacking this capacity, ITEP offers valuable analyses so that lawmakers can make tax policy decisions knowing basic information about how their constituents are affected.