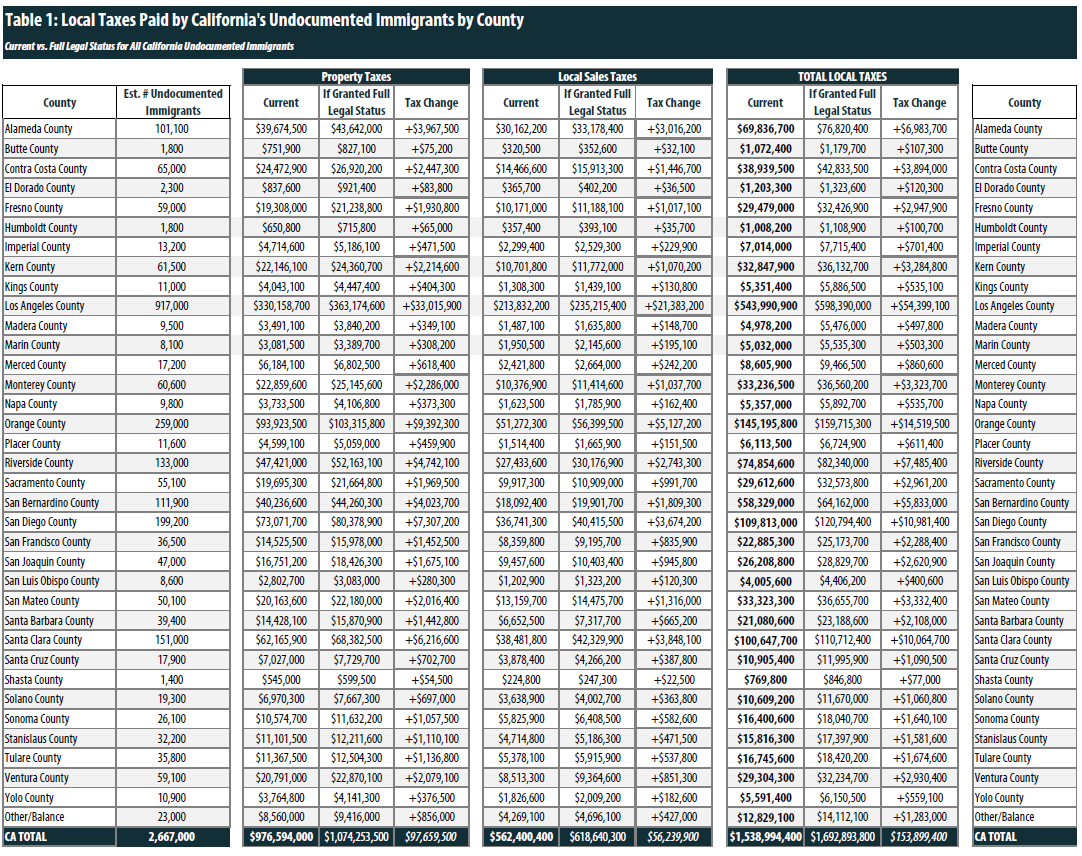
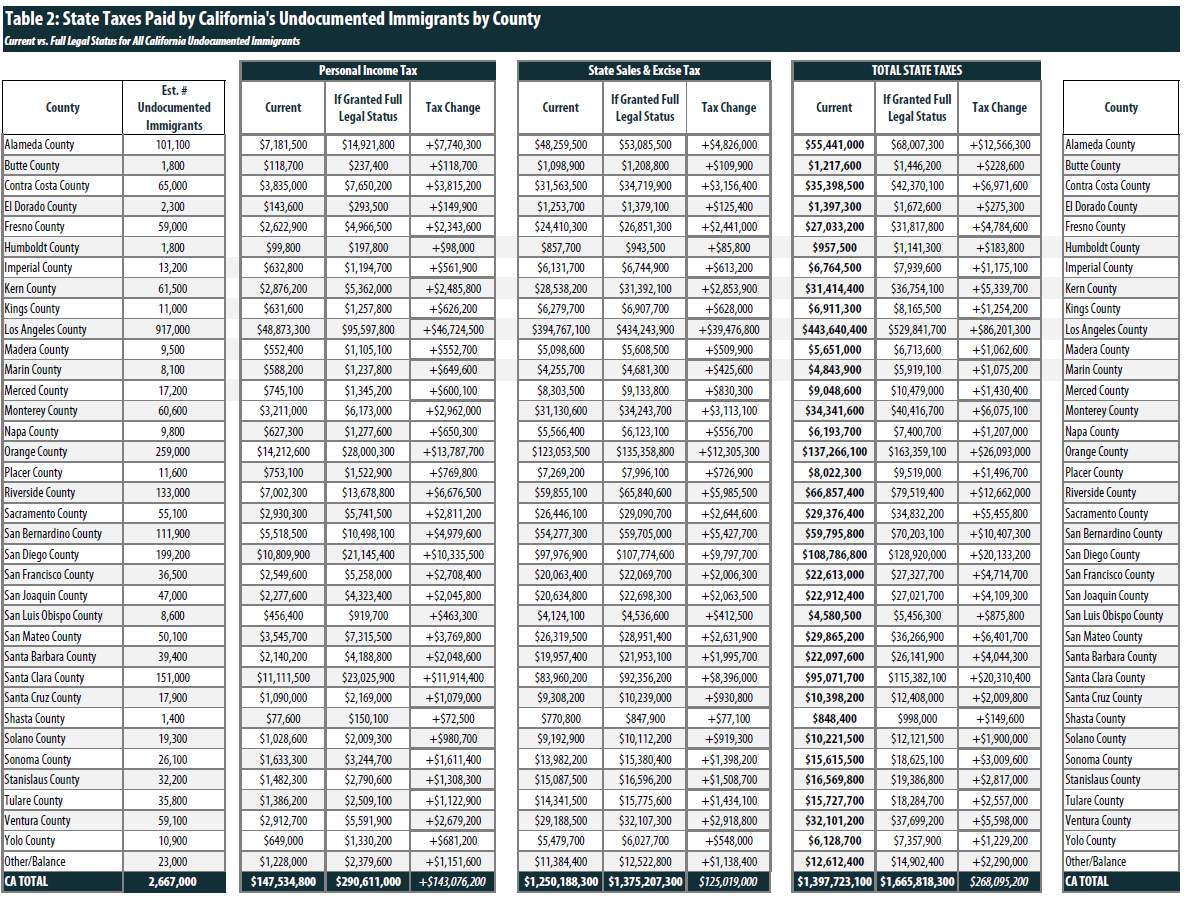
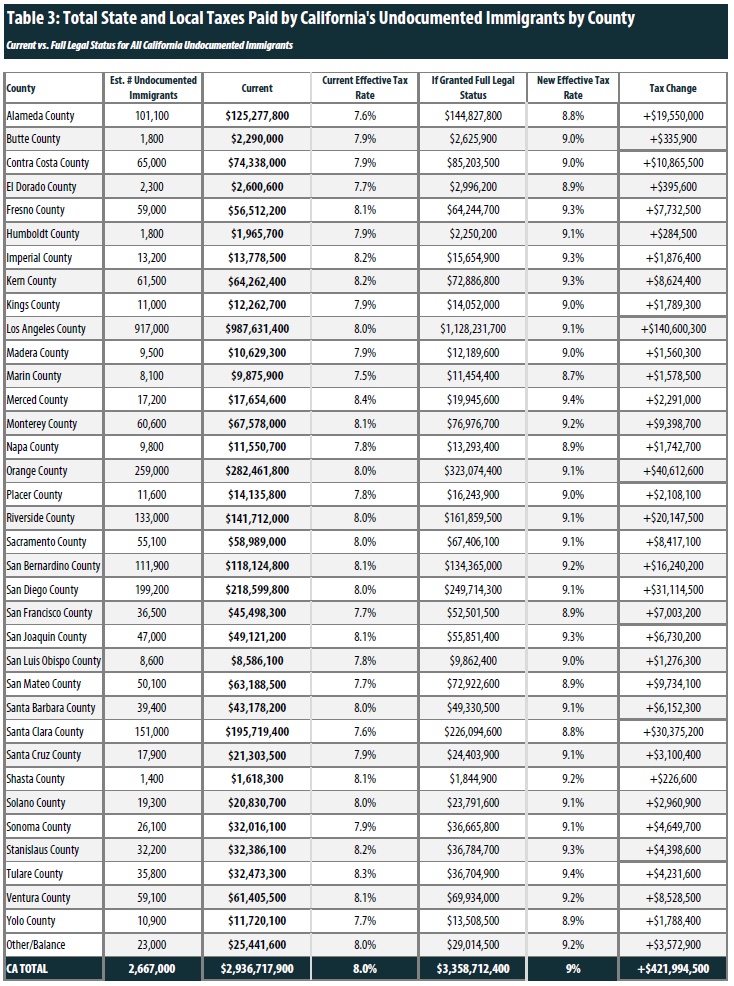
Public debates in California over immigrants, specifically around undocumented immigrants, often suffer from insufficient and inaccurate information about the contributions of undocumented immigrants, particularly their tax contributions at the local and state level. The fact of the matter is undocumented immigrants living in the California pay millions of dollars each year in local taxes to the counties where they live (estimated to be more than $1.5 billion) and collectively an estimated $3 billion combined in state and local taxes. A little more than half of the total state and local taxes undocumented immigrants in California pay flow to local governments.
The following tables provide county-by-county estimates on the current state and local level tax contributions of California’s 2.7 million undocumented immigrants and the increase in contributions if all these taxpayers were granted legal status as part of comprehensive reform. As California policymakers at the state and local level debate their approach to immigration policy, this data will provide much needed context on the tax contributions of undocumented immigrants living and working in California.
Methodology
Population and Income
The estimates of the undocumented population in California and their incomes were calculated by the Indiana University Kelley School of Business Research Center. The population data is comparable to that produced over the past decade by the Office of Immigration Statistics (OIS) of Department of Homeland Security (DHS). The strengths of these estimates are that: a) the estimation procedure yields estimates on a yearly basis, and thus can track the inflow of unauthorized immigration to the U.S. and to every geographic region; b) the data and methods used produce estimates with smaller ranges of sampling error, especially for states with small unauthorized populations, and are thus more nationally representative.
To derive these estimates for California, a series of statistical procedures were developed based on the micro-data, Integrated Public Use Microdata Sample (IPUMS-USA), collected by the U.S. Census Bureaus American Community Survey (ACS). The ACS is an annual statistical survey covering approximately one percent of the total U.S. population. The survey provides detailed social and economic data for all states, as well as all cities, counties, metropolitan areas, and population groups of 100,000 people or more.
The methodology – so-called “residual method” – for identifying unauthorized immigrants involves three main steps: 1) assuming everyone in the data is unauthorized and applying a series of “logical edits” to identify and separate out as many legal residents as possible from the ACS data for non-citizens who arrived after 1981; 2) deriving separate population controls, for 145 countries or areas, for the unauthorized residents surveyed in ACS; and 3) using those population controls to randomly select records from step one (the remaining unauthorized pool) to be classified as unauthorized residents. A final set of adjustments was made to account for an undercount in ACS. The term “logical edit” refers to “the process of determining probable legal status by examining survey data.” For example, respondents were assigned to the authorized resident category if they arrived before 1982, worked in occupations that generally require authorized status, received public benefits, were immediate relatives of US citizens and were veterans or currently in armed force etc.
The Center has provided data on the income of undocumented Californians in five discrete income groups based on the 2013 federal poverty level. ITEP used the midpoint of the income ranges in each group as an estimate of average income within each group and multiplied by the number of families/taxpaying units in each group to calculate aggregate income in these groups.
It is estimated that California close to 2.7 million unauthorized residents in 2013, of which 68% are Mexicans. The top five most popular destinations for unauthorized immigrants are Los Angeles, Orange, San Diego, Santa Clara and Fresno counties, and they account for over 60% of total unauthorized population in California.
Tax Contributions
ITEP first started with estimating total state and local taxes paid by the undocumented immigrants residing in each of the counties in the study. The methodology was identical the approach used in ITEP’s, Undocumented Immigrants’ State and Local Tax Contributions (see page 4 for methodology section), but rather than breaking down by state we broke the state of California down county by county.
ITEP then broke the revenue estimates down into state and local sources. The state figure includes all of the personal income tax revenue and the majority of the sales tax revenue. The statewide sales tax rate is 6%, however the state collects an additional 1.25% for localities and most local jurisdictions have additional local-level sales taxes. The local figure includes property taxes and a smaller share of sales tax revenue. To find the sales tax revenue estimate for each county, ITEP calculated the state share of the total average rate paid in each county. For example, if the average rate in a county was 8.25%, ITEP applied 73% (6/8.25) of the sales tax collected goes the state while 27% was applied to the county.
ITEP’s 2017 state- by- state report, Undocumented Immigrants’ State and Local Tax Contributions, estimated the total state and local tax contributions of undocumented immigrants in California to be just under $3.2 billion. The estimate in this study is lower, $2.9 billion, primarily because the estimated population size is lower than assumed in the broader ITEP report.
Acknowledgements
ITEP would like to extend a special thank you to Josue Chavarin, a program associate at the California Endowment for helping to plan the project and for coordinating the California-specific research.