Published: March 27, 2013
By CINDI ROSS SCOPPE — Associate Editor
Columbia, SC — WHEN THE liberal Institute on Taxation & Economic Policy released its latest “Distributional Analysis of the Tax Systems in All 50 States” earlier this year, Republican tax guru Burnie Maybank sent out a blast email proclaiming that “SC fares well on new Tax Equity Study.”
The Revenue director for Govs. Mark Sanford and David Beasley noted that our tax system “was largely proportionate but was generally more progressive than the national average.”
Meantime, Democratic tax policy analyst John Ruoff posted a report on his blog pointing out that “Low-income and middle class taxpayers in South Carolina pay a larger share of their income to support our public structures and systems than do our wealthiest taxpayers.”
Unfortunately, the report didn’t really tell us either, at least not for certain.
Both Mr. Maybank and Mr. Ruoff accurately reported different aspects of the study: Our taxes are slightly regressive — that is, the lower your income, the larger the percentage of that income you pay in taxes — but they’re far less regressive than in the other states.
But they both ignored the import of this disturbing fact buried deep in the numbers: They cover only half of the revenue that state and local governments collect. The other 48.4 percent comes from “non-tax revenues,” which are ignored in all the charts showing how each state distributes the tax burden among income groups.
Our non-tax revenue in 2010, the latest year analyzed, was the highest, by far, of any state. And it was up from 37.8 percent in 2000 — the largest increase, by far, of any state.
The report doesn’t fully define non-tax revenue, but it notes that it includes college tuition and lottery money; that category usually also includes such things as fees from driver’s licenses and hunting licenses, admission to state parks and other user fees and civil and criminal fines. Such revenues tend to be regressive, because you pay the same flat fee regardless of how much money you make — though how regressive depends on the specific source.
So our heavy reliance on non-tax revenue probably adds more regressivity to our tax system than it does to the systems in states that rely less on such revenue, although we have no idea by how much until someone crunches those numbers — and really, no one wants to do that, because it’s tedious and thankless work.
What the report does do, however, is provide a really neat way to illustrate how different types of taxes balance out each other. And in doing so, it reminds us of how very misleading people are being when they make generalizations about who pays for government based solely on income taxes. It also lays bare the fairness problem with trying to eliminate any one of the major taxes.
Economists frequently talk approvingly about the three-legged stool on which states rely for revenue: income, property and sales taxes. They like this arrangement for several reasons: Like a balanced portfolio, it provides diversification so revenue doesn’t fluctuate wildly through the business cycle. It taxes different parts of the economy, rather than overburdening any single sector or type of activity. It ensures that everyone pays taxes — from those with wealth and little income to those with income and little wealth. It also balances the tax burden across income classes.
Generally the poorer people are, the more of their income they spend on sales taxes, because they have to spend more of their income on taxable goods; and the wealthier they are, the more of their income they tend to spend on income taxes. So the two tend to balance each other out. That is, unless we design our exemptions to make the sales tax less regressive. Or unless we have a flat income tax, which could make sense if that were our only tax but defeats one of the important goals of diversification if we also have a sales tax.
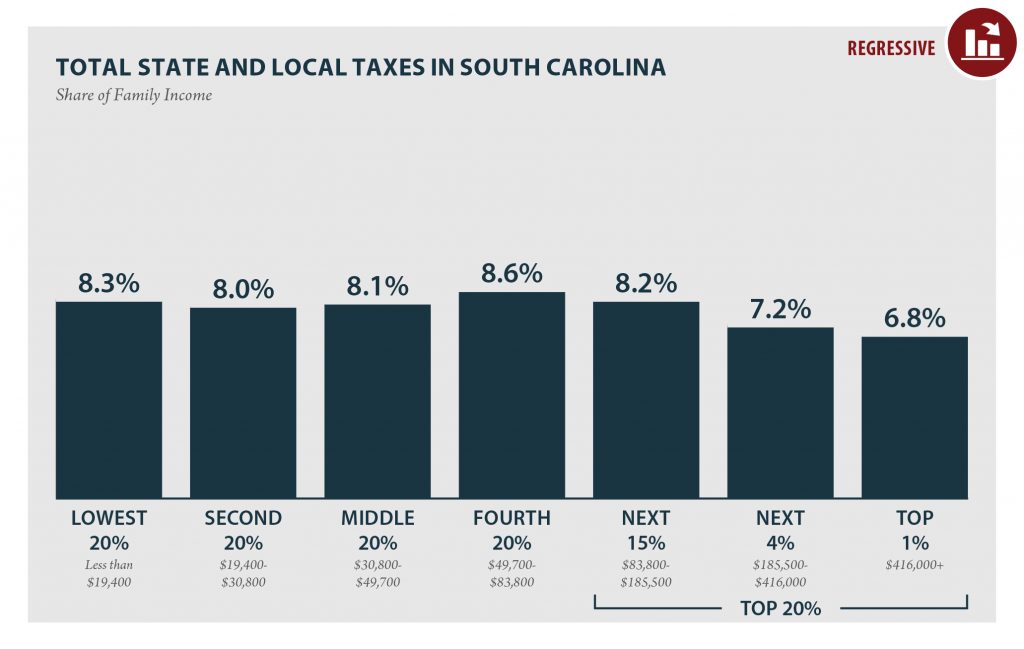
What the Institute’s latest study shows is that in South Carolina, the income and sales taxes balance each other fairly well. Not perfectly: Wealthier people still pay a lower percentage of their income in taxes than do poor people, as Mr. Ruoff pointed out. But they balance each other much better than they do in most states, as Mr. Maybank pointed out.
As the chart to the right shows, when you add all of our taxes together, the overall tax burden remains fairly constant through the bottom 95 percent of income, ranging from a low of 6.9 percent of income to a high of 7.4 percent. Taxpayers in the 96th through 99th percentile pay 6 percent of their income in state and local taxes, and those in the top 1 percent pay 5 percent.
If we wanted to bring everyone into the 6.9 percent to 7.4 percent range, there are plenty of ways to do it, without changing the overall amount of money we collect in taxes. For instance, we could create an additional income tax bracket for the very top earners and lower the bottom rates. A little more difficult, but smarter, would be to lift the blanket sales tax exemption on all those services that consume a larger and larger portion of the consumer dollar, which people at higher incomes tend to buy, and lower the overall tax rate.
But of course our legislators aren’t interested in any of that: Their main interest, besides carving out new specialized exemptions for most-favored donors, is to lower income tax rates, which would get us even further out of balance.
Well, that, along with averting their eyes while all those user fees, fines and other “non-tax revenues” keep skyrocketing, making our tax system even more regressive — and more opaque.


