EXECUTIVE SUMMARY
Alaska is facing a significant budget gap because of a sharp decline in the oil tax and royalty revenue that has traditionally been relied upon to fund government. This report examines five approaches for replacing some of the oil revenue that is no longer available: enacting a broad personal income tax, state sales tax, payroll tax, investment income tax, or cutting the Permanent Fund Dividend (PFD). Any of the options examined in this report could make a meaningful contribution toward closing Alaska’s budget gap. To allow for comparisons across options, this report examines policy changes designed to generate $500 million annually. This amount would be insufficient to close Alaska’s $3 billion budget gap, but any of these options could be modified to raise additional revenue, or could be incorporated into a larger package of changes designed to close the gap.
In studying each of these approaches, this report makes the following findings:
- Most Alaska households would pay less under a graduated rate personal income tax than they would under a payroll tax, sales tax, or a cut to the PFD payout designed to raise the same amount of revenue. This finding holds true across at least the bottom 60 percent of the income distribution, and for some families above this level.
- Low-income families in Alaska would fare far better under a progressive personal income tax than under a sales tax, payroll tax, or a cut to the PFD payout. Under the options examined in this report, the bottom 20 percent of Alaska families (those earning less than $25,000 per year) would pay roughly 0.1 percent of their income under a personal income tax versus 1.2 percent under a payroll tax, 2.2 percent under a sales tax, or 7.2 percent under a cut to the PFD.
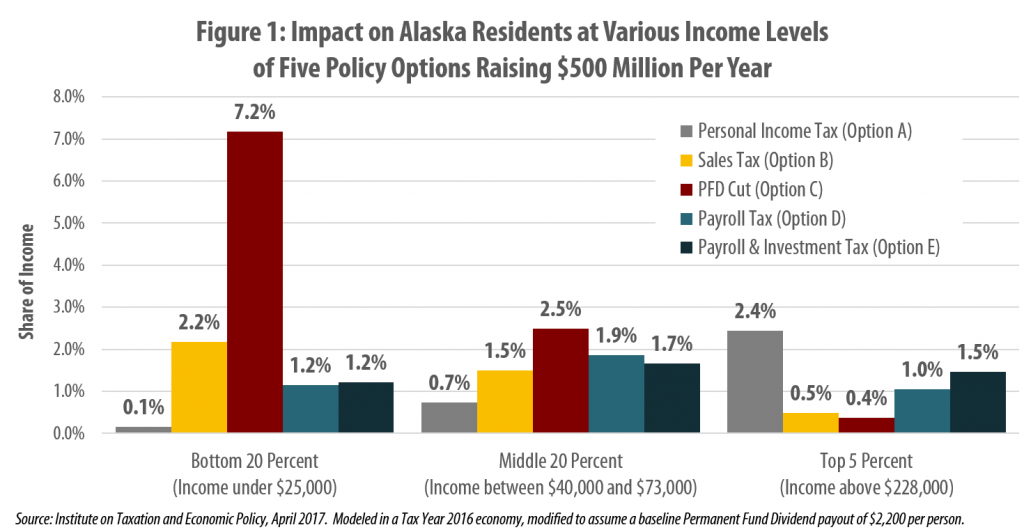
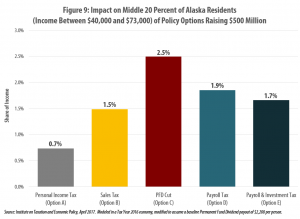
- Middle-income families would also fare better under a progressive personal income tax than under any other option examined in this report. The middle 20 percent of earners (those earning between $40,000 and $73,000 per year) would pay 0.7 percent of their income under a personal income tax designed to raise $500 million versus 1.5 percent under a sales tax, 1.9 percent under a payroll tax, or 2.5 percent under a cut to the PFD designed to raise the same amount.
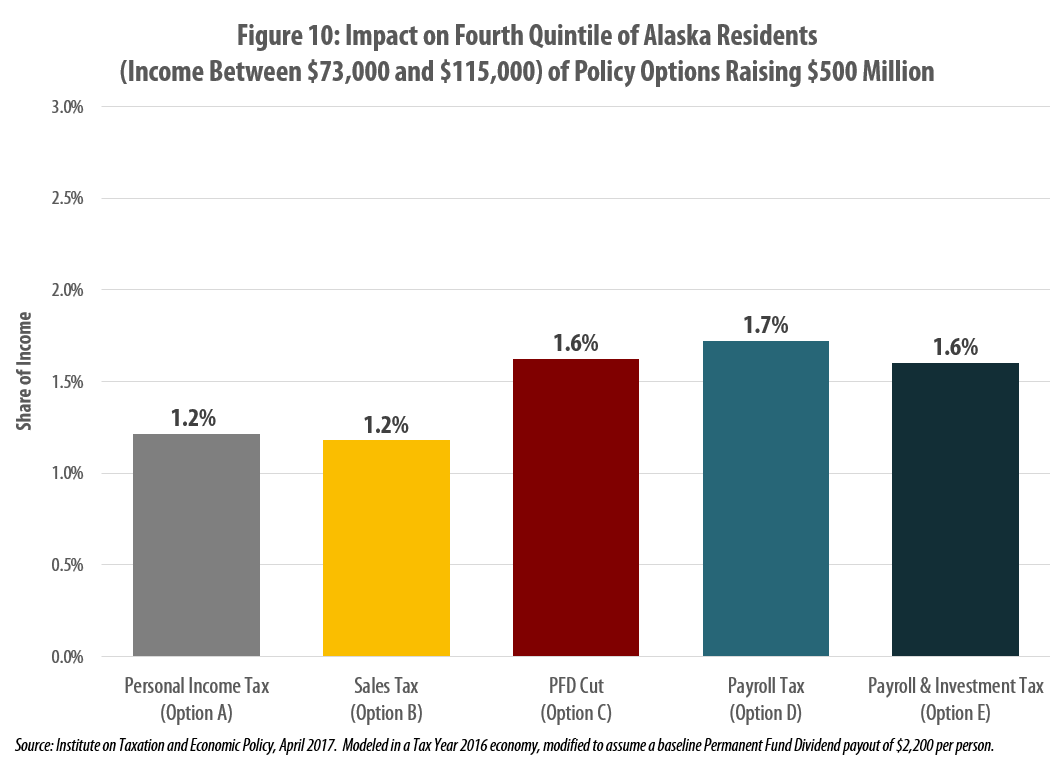
- The impact on upper-middle income families is similar under each of the fiscal policy options in this report. Families earning between $73,000 and $115,000 per year could expect to pay roughly 1.2 percent of their incomes under either a sales tax or income tax designed to raise $500 million, versus 1.6 percent under a cut to the PFD and 1.7 percent under a payroll tax.
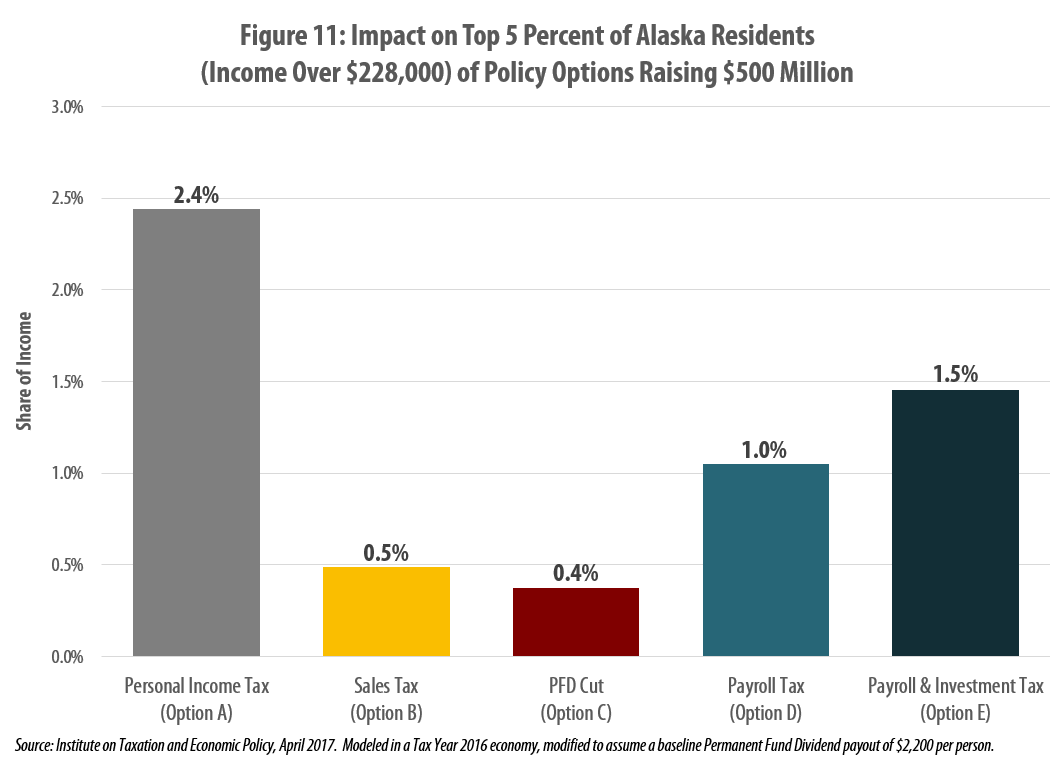
- High-income families are the only group that would be most impacted by an income tax. The top 5 percent of earners (those with incomes over $228,000 per year) would pay 2.4 percent of their income, on average, under a personal income tax designed to raise $500 million versus 1.0 percent under a payroll tax, 0.5 percent under a sales tax, or 0.4 percent under a cut to the PFD payout designed to raise the same amount.
- Cuts to the PFD payout are the most regressive option examined in this report, followed by a statewide general sales tax. A PFD cut would impact the bottom 20 percent of earners nearly 10 times as heavily as the top 20 percent, when measured relative to family income. A statewide general sales tax would also be regressive, costing low-income earners more than three times as much, relative to their incomes, as high-income earners.
- A personal income tax similar to the one passed by the Alaska House of Representatives would be progressive, with tax rates steadily rising for taxpayers with higher incomes. The progressive nature of personal income taxes is one reason that some Alaska lawmakers, including Gov. Bill Walker, have suggested implementing such a tax alongside regressive cuts to the PFD payout.
INTRODUCTION
After decades of funding state government primarily with oil tax and royalty revenues, lawmakers in Alaska are now debating supplementing those revenues with broad-based taxes similar to those levied in most other states. There is a growing acceptance that the state’s energy sector is unlikely to see a resurgence strong enough to remedy the state’s unsustainable fiscal standing.
For decades, most Alaskans have paid very little in state taxes because Alaska lacks a statewide personal income tax or sales tax. Given the state’s inexperience with broad-based taxes, it can be difficult for Alaskans to judge how different tax policy options might affect them. And it can be equally difficult for Alaskans to determine how those options would compare to another fiscal policy change under consideration: cutting the flat dollar Permanent Fund Dividend (PFD) payout that most Alaskans receive each year as a way of sharing in the state’s natural resource wealth.[1]
This report seeks to provide clarity regarding the impact that various fiscal policy options would have on Alaska families at various income levels. This is done by using the ITEP Microsimulation Tax Model to analyze five types of fiscal policy changes, with each designed to generate an equal amount of revenue for Alaska’s public services: approximately $500 million per year.[2]
The $500 million target used in this report was chosen as a benchmark for facilitating comparisons across options. The options are not intended as specific recommendations, but instead are designed to show how fiscal policy options with nearly identical budgetary impacts can have vastly different impacts on Alaskans at different income levels.
It is important to note that a $500 million fiscal plan would be insufficient to close Alaska’s $3 billion budget gap. Of course, any of the categories of options examined here could be modified to raise a higher level of revenue, or could be incorporated into a larger package of changes designed to close the gap in full.
OPTION A: INCOME TAX
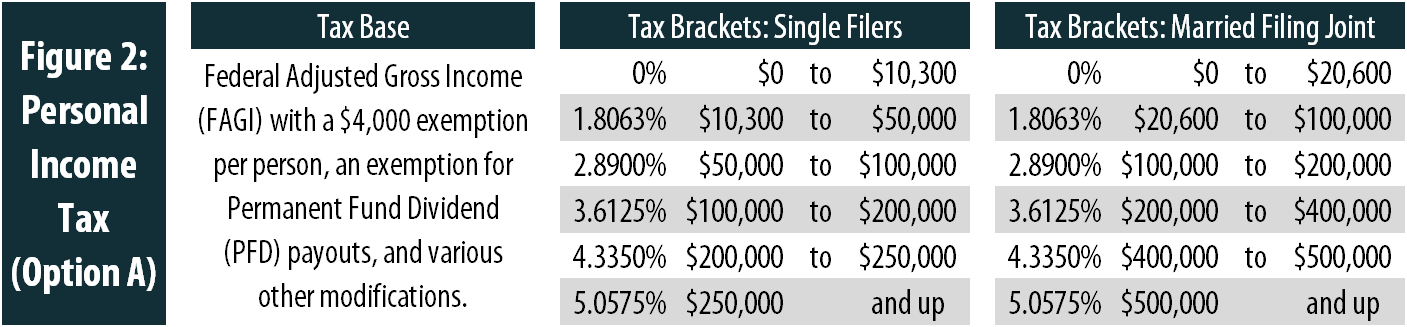
Alaska lawmakers are currently debating reinstating a personal income tax for the first time in more than 35 years. The main proposal under consideration is House Bill 115, which would implement a personal income tax with rates ranging from 0 to 7 percent.[3] The income tax analyzed in this report is very similar to this bill, though its rates have been reduced across the board to bring its revenue yield down to $500 million—the same amount raised by the other policy options explored in this report. Figure 2 describes the income tax structure in more detail.
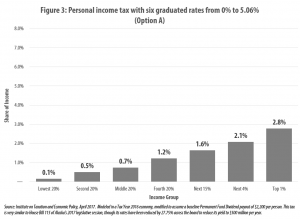
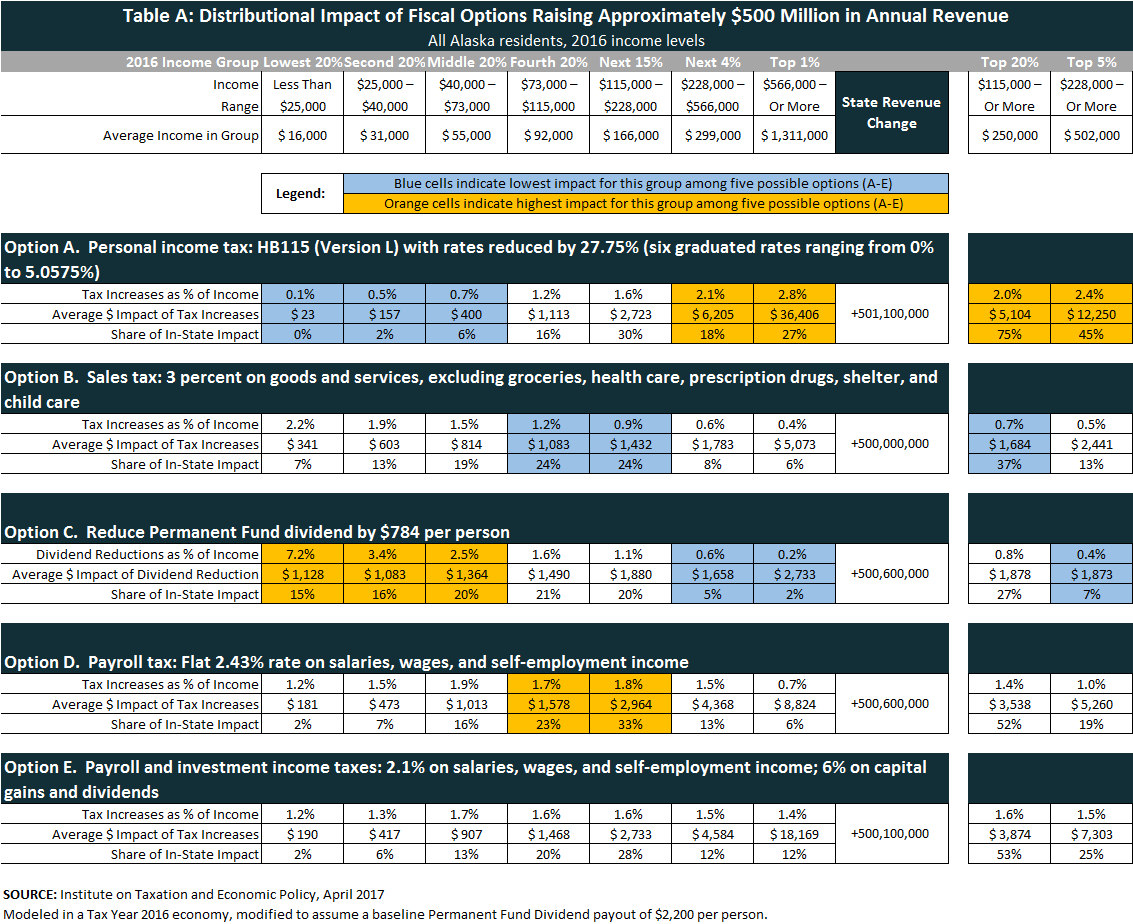
As shown in Figure 3, this tax would have a progressive impact across the income distribution. The bottom 20 percent of earners in Alaska (with incomes below $25,000 per year) would pay an average of just 0.1 percent of their income in tax, while middle-income families would pay 0.7 percent and the state’s top 1 percent of earners would pay 2.8 percent. More detailed results are available in Table A on page 15.
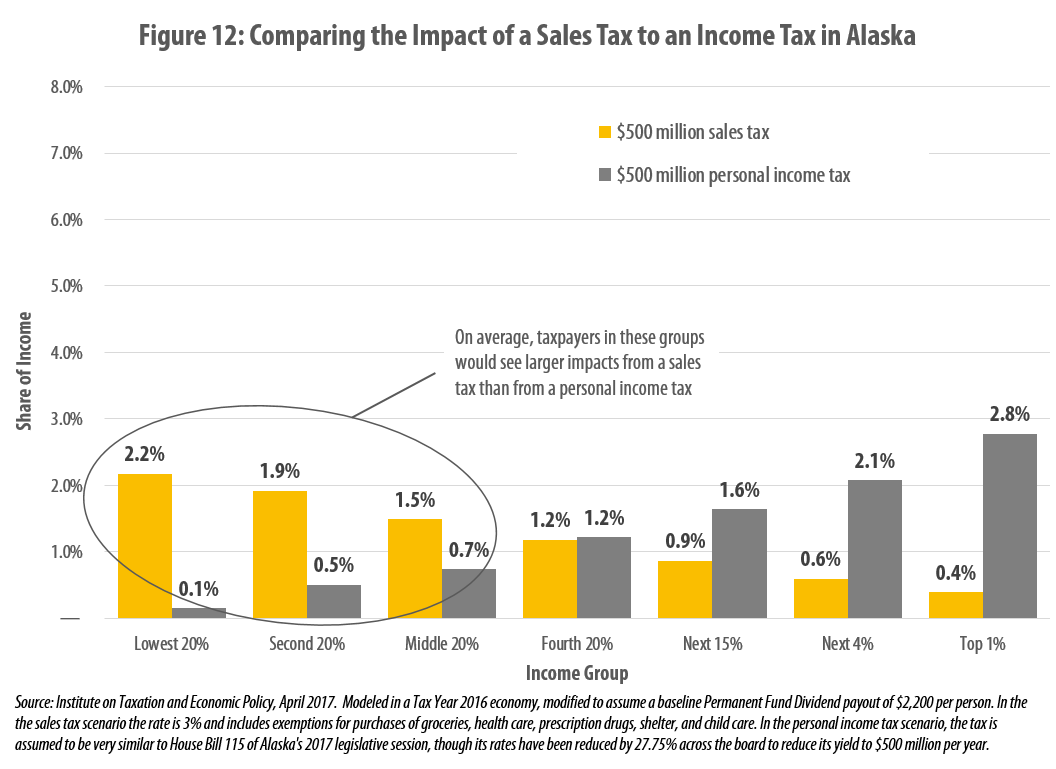
OPTION B: SALES TAX
Unlike personal income taxes, general sales taxes tend to be regressive, impacting low- and middle-income families more heavily than high-income families when measured as a percentage of household income.[4] This effect comes about largely because low- and middle-income families spend a larger fraction of their earnings on items subject to sales tax, while high-income families direct a large share of their income into savings and investments.
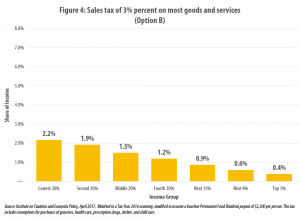
Researchers at the Alaska Department of Revenue have determined that a 3 percent sales tax would raise approximately $500 million in revenue per year.[5] This tax would include exemptions for various necessities such as groceries, health care, prescription drugs, shelter, and child care. Even with these exemptions, Figure 4 reveals that the tax would be regressive overall, requiring payments from low-income Alaskans equal to roughly 2.2 percent of their incomes compared to 1.5 percent for middle-income families and 0.4 percent from the state’s top 1 percent of earners.
More detailed results are available in Table A on page 15. Those results show that the impact on the bottom 20 percent of earners (at 2.2 percent of income) is more than three times as large as the impact faced by the top 20 percent (at 0.7 percent of income).
OPTION C: REDUCTIONS IN THE PERMANENT FUND DIVIDEND PAYOUT
Alaska’s Permanent Fund Dividend (PFD) is unique among the states, offering every full-time Alaska resident a chance to share in the state’s natural resource wealth. Annual payouts under the PFD typically range from $1,000 to $2,000 per person. But while every individual in Alaska receives the same size PFD, this payout is a much more significant source of income for families of modest means. While a $2,000 annual payment amounts to 2 percent, or less, of the income of an Alaskan earning a six-figure salary, its value is closer to 10 percent of income for a minimum wage worker bringing home roughly $20,000 in earnings per year.
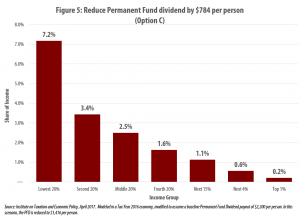
As a result, reductions in the PFD are steeply regressive, having a far larger impact on families with lower incomes. Figure 5 demonstrates that while a $784 cut to the PFD payout could free up approximately $500 million for Alaska’s budget, that gain would come at a high cost for Alaska’s most vulnerable residents. Low-income families could expect to see their incomes cut by 7.2 percent under this change while the impact on middle-income families would amount to 2.5 percent and high-income Alaskans would see impacts well below 1 percent of their incomes.
More detailed results are available in Table A on page 15. Those results show that the impact on the bottom 20 percent of earners (at 7.2 percent of income) is nearly ten times as large as the impact faced by the top 20 percent (at 0.8 percent of income).
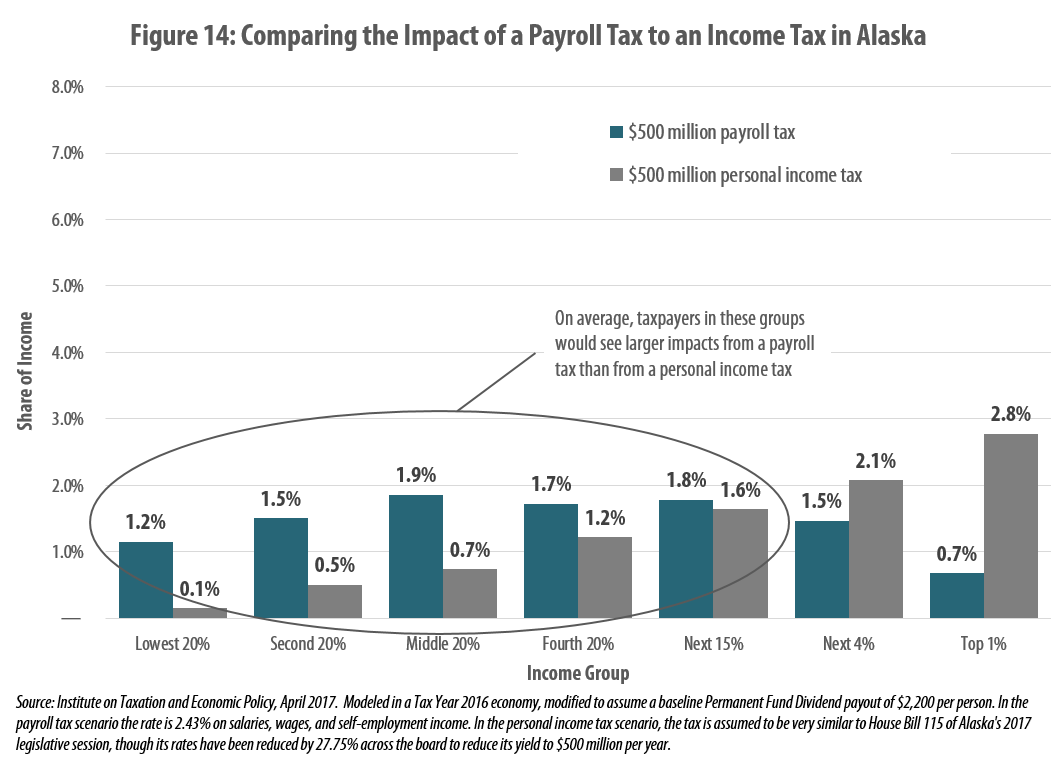
OPTION D: PAYROLL TAX
Payroll taxes are a narrower type of personal income tax that apply only to current earnings from work, such as salaries, wages, and self-employment income. These taxes do not apply to investment income (such as capital gains and dividends) or retirement income (such as pensions and Social Security). Unlike broad-based personal income taxes, payroll taxes typically lack personal exemptions, meaning that they apply even to the first dollar that taxpayers earn each year.
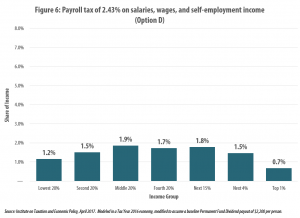
Figure 6 shows the impact of a payroll tax designed to raise $500 million per year at a tax rate equal to 2.43 percent of earned income. This tax is moderately progressive throughout the bottom 60 percent of the income distribution because lower-income taxpayers are more likely to receive significant shares of their income from retirement income, unemployment compensation, or other sources that would be exempted from this tax. At the top of the income distribution, the tax becomes regressive because high-income earners receive a large share of their income from investments that would also be exempted under this tax. A payroll tax would fall heaviest on middle- and upper-middle income families in their prime working years that do not receive significant income from their investments. More detailed results are available in Table A on page 15.
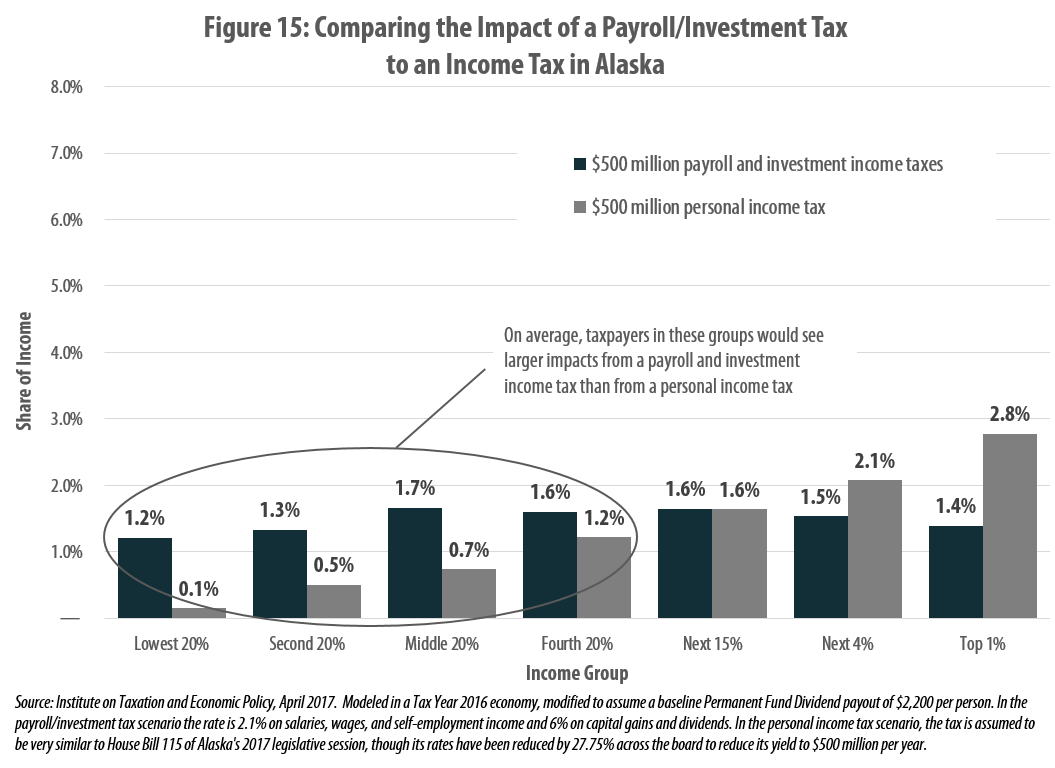
OPTION E: PAYROLL TAX PAIRED WITH INVESTMENT INCOME TAX
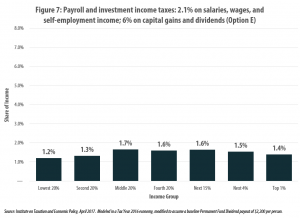
One of the most significant drawbacks of a payroll tax is that it asks less of high-income families with substantial investment income than it does of middle-income families living on their salaries or wages. To remedy this shortcoming, a payroll tax could be paired with a standalone tax on investment income such as capital gains and dividends. As seen in Figure 7, this type of hybrid approach would come close to achieving a proportional result overall—meaning that families at various income levels would pay roughly equal shares of their income in tax under such an arrangement. More detailed results are available in Table A on page 15.
Levying an investment income tax alongside a payroll tax also means that the rate on salaries, wages, and self-employment income could be reduced while generating the same level of revenue as the previous example (Option D). In this scenario, levying a 6 percent tax on investment income would allow for a reduction in the payroll tax rate from 2.43 to 2.1 percent, while still generating $500 million in revenue overall. As with Option D, retirement income would remain exempt from tax under this system.
COMPARING FIVE OPTIONS
The analyses described above make clear that families at different income levels would be impacted very differently by each of the five options explored in this report. Reducing the PFD payout or implementing a statewide sales tax would have a regressive impact, with low-income families being affected most relative to their incomes. At the other end of the spectrum, a graduated rate personal income tax would be progressive, requiring the largest payments from Alaska families with high incomes. Finally, the distribution of the payroll taxes explored in this report tends to be progressive at the bottom of the income distribution and regressive at the top. These stark differences in distributional impact mean that even when policy options are designed to raise the same level of revenue, the cost of those options to specific families can vary widely.
Low-Income Families
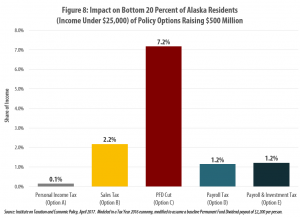
While each of the five options explored in this report would raise $500 million in revenue per year for public services, Figure 8 shows that the impact on the bottom 20 percent of Alaska earners (with incomes below $25,000) would range widely, from 0.1 percent of income under a personal income tax to 7.2 percent of income under a cut to the PFD. The heavy impact of PFD cuts comes about because the PFD is a highly significant source of income for this group. At the same time, the income tax modeled in this report includes exemptions that benefit all Alaskans, but that are particularly important to low-income families (the first $14,300 earned by single taxpayers and the first $28,600 earned by married couples is exempt from tax). Finally, it is also worth noting that the sales tax option would amount to 2.2 percent of income for low-income taxpayers while each of the payroll tax options would collect 1.2 percent of this group’s income.
Middle-Income Families
The impacts felt by middle-income families under each of these options are broadly similar to those faced by families with low incomes, though the degree of difference between the various options is somewhat less pronounced. Figure 9 shows that the middle 20 percent of Alaska earners (those with incomes between $40,000 and $73,000) would pay less under the personal income tax than under any of the other four options examined. In this scenario, the personal income tax would amount to 0.7 percent of their income, on average. The PFD cut, by contrast, would be the costliest policy course for this group. Reducing the PFD by $784 per person would reduce this group’s income by approximately 2.5 percent, on average.
For middle-income earners, the payroll taxes and sales taxes examined in this report would have similar impacts. A sales tax designed to raise $500 million would collect roughly 1.5 percent of this group’s income. A payroll tax designed to raise the same amount would vary between 1.7 to 1.9 percent of this group’s income, with the lower amount associated with the combination payroll and investment income tax (Option E).
Upper-Middle Income Families
The differences between the five options examined in this report are smallest for upper-middle income families. Those Alaskans between the 60th and 80thpercentiles of income (earning between $73,000 and $115,000 per year) would see similar impacts to their household budgets regardless of whether lawmakers opted to raise $500 million under an income tax, sales tax, payroll tax, or PFD reduction.
For this group, personal income taxes and sales taxes are roughly comparable in impact, at 1.2 percent of income. Since this group tends to include a disproportionate number of working age Alaskans, the payroll tax options levied on this group’s earnings tend to have a somewhat larger impact of between 1.6 and 1.7 percent of income. This is roughly equivalent to the 1.6 percent drop in income that this group could expect under a cut to the PFD payout.
High-Income Families
Alaska’s high-income earners are the only group that would face a larger impact under a personal income tax than under the other options explored in this report. Figure 11 reveals that the top 5 percent of Alaska families (those earning over $228,000 per year) would face a personal income tax bill equal to 2.4 percent of their income, on average, under the income tax examined in this report. A cut to the PFD payout, by contrast, would be the least consequential policy change for this group, amounting to just 0.4 percent of their income. Similarly, a statewide sales tax could be expected to amount to just 0.5 percent of income for the state’s highest income earners.
The payroll tax options fall between these amounts. A standalone payroll tax would collect 1.0 percent of this group’s income while pairing that tax with an investment income tax would boost that figure to 1.5 percent.
CONCLUSION
Alaska lawmakers have a variety of fiscal policy options available to close the state’s budget gap. Each of those options would impact families at different income levels in very different ways. A personal income tax, for instance, would be progressive, requiring higher payments relative to income from high-income families than from low-income families. Both sales taxes and cuts to the state’s PFD payout, by contrast, would have a regressive impact.
Most Alaska families would find that a graduated rate personal income tax would have less impact on their household budgets than a sales tax, payroll tax, or cut to the PFD designed to generate an equivalent amount of revenue for the state. This finding holds true across at least the bottom 60 percent of the income distribution, and for some families above this level. This is because income taxes can be fine-tuned to require lower payments from taxpayers earning modest incomes and higher payments from those wealthy taxpayers who have benefited most from the economic opportunities that Alaska has made available to them.
APPENDIX A: DETAILED RESULTS
APPENDIX B: COMPARING AN INCOME TAX TO OTHER REVENUE OPTIONS

APPENDIX C: THE ITEP MODEL
The Institute on Taxation & Economic Policy has engaged in research on tax issues since 1980, with a focus on the distributional consequences of both current law and proposed changes. ITEP’s research has often been used by other private groups in their work, and ITEP is frequently consulted by government estimators in performing their official analyses. Since 1994, ITEP has built a microsimulation model of the tax systems of the U.S. government and of all 50 states and the District of Columbia.
Microsimulation Model
The ITEP model is a tool for calculating revenue yield and incidence, by income group, of federal, state, and local taxes. It calculates revenue yield for current tax law and proposed amendments to current law. Separate incidence analyses can be done for categories of taxpayers specified by marital status, the presence of children and age.
In computing its estimates, the ITEP model relies on one of the largest databases of tax returns and supplementary data in existence, encompassing close to three quarters of a million records. To forecast revenues and incidence, the model relies on government or other widely respected economic projections.
The ITEP model’s federal tax calculations are very similar to those produced by the congressional Joint Committee on Taxation, the U.S. Treasury Department and the Congressional Budget Office (although each of these four models differs in varying degrees as to how the results are presented). The ITEP model, however, adds state-by-state estimating capabilities not found in those government models.
Below is an outline of each area of the ITEP model and what its capabilities are:
The Personal Income Tax Model analyzes the revenue and incidence of current federal and state personal income taxes and amendment options including changes in:
- Rates, including special rates on capital gains,
- Inclusion or exclusion of various types of income,
- Inclusion or exclusion of all federal and state adjustments,
- Exemption amounts and a broad variety of exemption types and, if relevant, phase-out methods,
- Standard deduction amounts and a broad variety of standard deduction types and phase-outs,
- Itemized deductions and deduction phase-outs, and
- Credits, such as earned-income and child-care credits.
The Consumption Tax Model analyzes the revenue yield and incidence of current sales and excise taxes. It also has the capacity to analyze the revenue and incidence implications of a broad range of base and rate changes in general sales taxes, special sales taxes, gasoline excise taxes, and tobacco excise taxes. There are more than 250 base items available to amend in the model, reflecting, for example, sales tax base differences among states and most possible changes that might occur.
The Property Tax Model analyzes revenue yield and incidence of current state and local property taxes. It can also analyze the revenue and incidence impacts of statewide policy changes in property tax, including the effect of circuit breakers, homestead exemptions, and rate and assessment caps.
The Corporate Income Tax Model analyzes revenue yield and incidence of current corporate income tax law, possible rate changes and certain base changes.
Local taxes: The model can analyze the statewide revenue and incidence of aggregate local taxes (not, however, broken down by individual localities).
Data Sources
The ITEP model is a “microsimulation model.” That is, it works on a very large stratified sample of tax returns and other data, aged to the year being analyzed. This is the same kind of tax model used by the U.S. Treasury Department, the congressional Joint Committee on Taxation and the Congressional Budget Office. The ITEP model uses the following micro-data sets and aggregate data:
Micro-Data Sets: IRS 1988 Individual Public Use Tax File, Level III Sample; IRS Individual Public Use Tax Files; Current Population Survey; Consumer Expenditure Survey; U.S. Census; American Community Survey.
Partial List of Aggregated Data Sources: Miscellaneous IRS data; Congressional Budget Office and Joint Committee on Taxation forecasts; other economic data (Moody’s Economy.com, Commerce Department, WEFA); state tax department data; data on overall levels of consumption for specific goods (Commerce Department, Census of Services); state specific consumption and consumption tax data (Census data, Government Finances, data from state revenue departments); state specific property tax data (Govt. Finances, data from state revenue departments.); American Housing Survey; Census of Population Housing; and other sources.
[1] Waldholz, Rachel, “Alaska’s annual dividend adds up for residents,” Marketplace, Mar. 16, 2016 at https://www.marketplace.org/2016/03/12/economy/alaskas-annual-dividend-residents-adds.
[2] An overview of the ITEP Microsimulation Tax Model is available in Appendix C of this report and at:
http://itep.org/about/itep_tax_model_simple.php.
[3] Davis, Carl, “Assessing the Distributional Consequences of Alaska’s House Bill 115 (Version L),” Institute on Taxation and Economic Policy, Mar. 28, 2017 at http://itep.org/itep_reports/2017/03/assessing-the-distributional-consequences-of-alaskas-house-bill-115-version-l.php.
[4] Researchers at the Institute of Social and Economic Research (ISER) at the University of Alaska Anchorage have also studied the impact of implementing a sales tax in Alaska and found it to be similarly regressive. Knapp, Gunnar et al., “Short-Run Economic Impacts of Alaska Fiscal Options,” Mar. 30, 2016 at http://www.iser.uaa.alaska.edu/Publications/2016_03_30-ShortrunEconomicImpactsOfAlaskaFiscalOptions.pdf.
[5] Alaska Department of Revenue, Fiscal Note for SB 5004 of the 2016 Legislative Session, 0516-DOR-TAX-07-08-16, Jul. 11, 2016 at http://www.legis.state.ak.us/PDF/29/F/SB5004-1-3-071116-REV-Y.PDF.