The House Tax Plan, By the Numbers
May 16, 2025

Carl Davis
Research Director
May 16, 2025
The House of Representatives unveiled a sprawling piece of tax legislation earlier this week that would extend temporary tax changes enacted in 2017 and layer various kinds of tax cuts and increases on top. ITEP is currently working to analyze the bill with its microsimulation tax model and expects to report substantial new findings in the days ahead. In the meantime, there are insights to be gained from the wealth of information on revenue cost and distribution by income level published by Congress’ Joint Committee on Taxation (JCT).
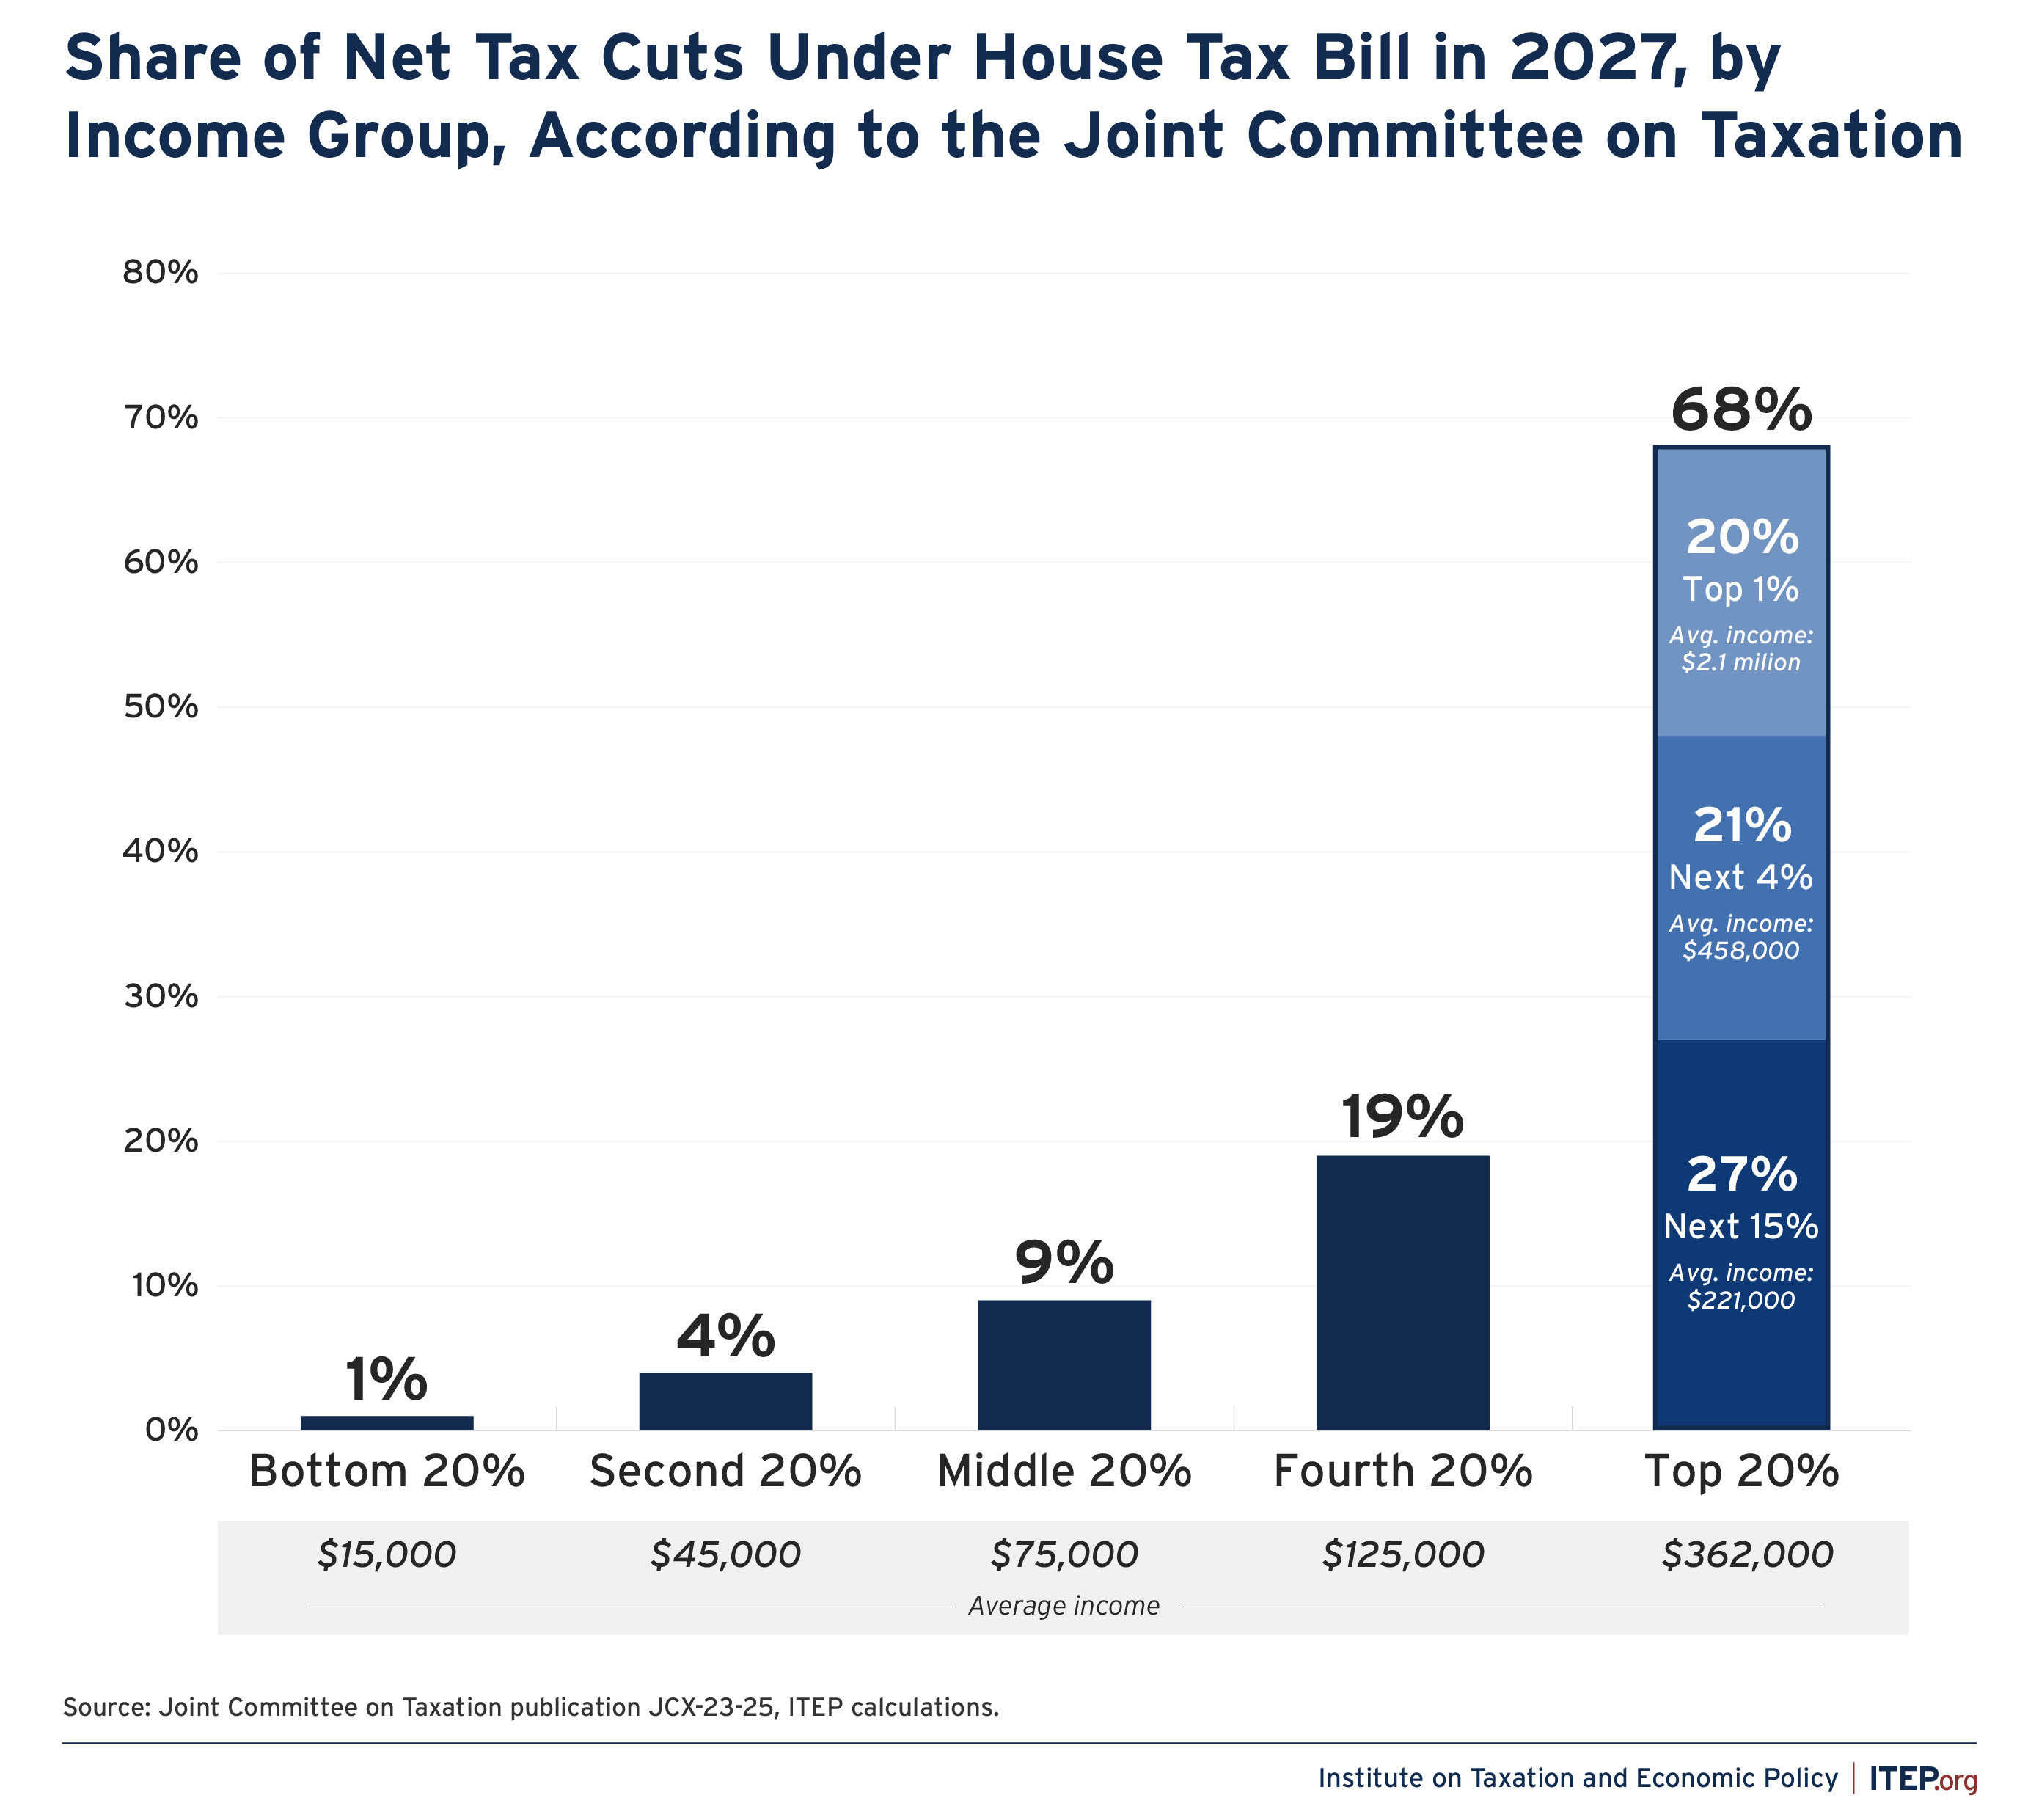
The JCT analysis makes clear that the House tax plan would be regressive, meaning it would offer larger tax cuts as a share of income to high-income taxpayers than to either middle-class or working-class families. It also makes clear that most of the tax cuts would go to families with above-average incomes. Specifically, Figure 1 shows JCT’s finding that two-thirds of the tax cuts offered in 2027 would go to the top 20 percent of families, and 41 percent would flow to just the top 5 percent of families. Given that a large majority of Americans agree that high-income people pay too little in tax, paring back or eliminating the tax cuts flowing to the top offers a logical starting point for beginning to bring down the high cost of the bill.
FIGURE 1
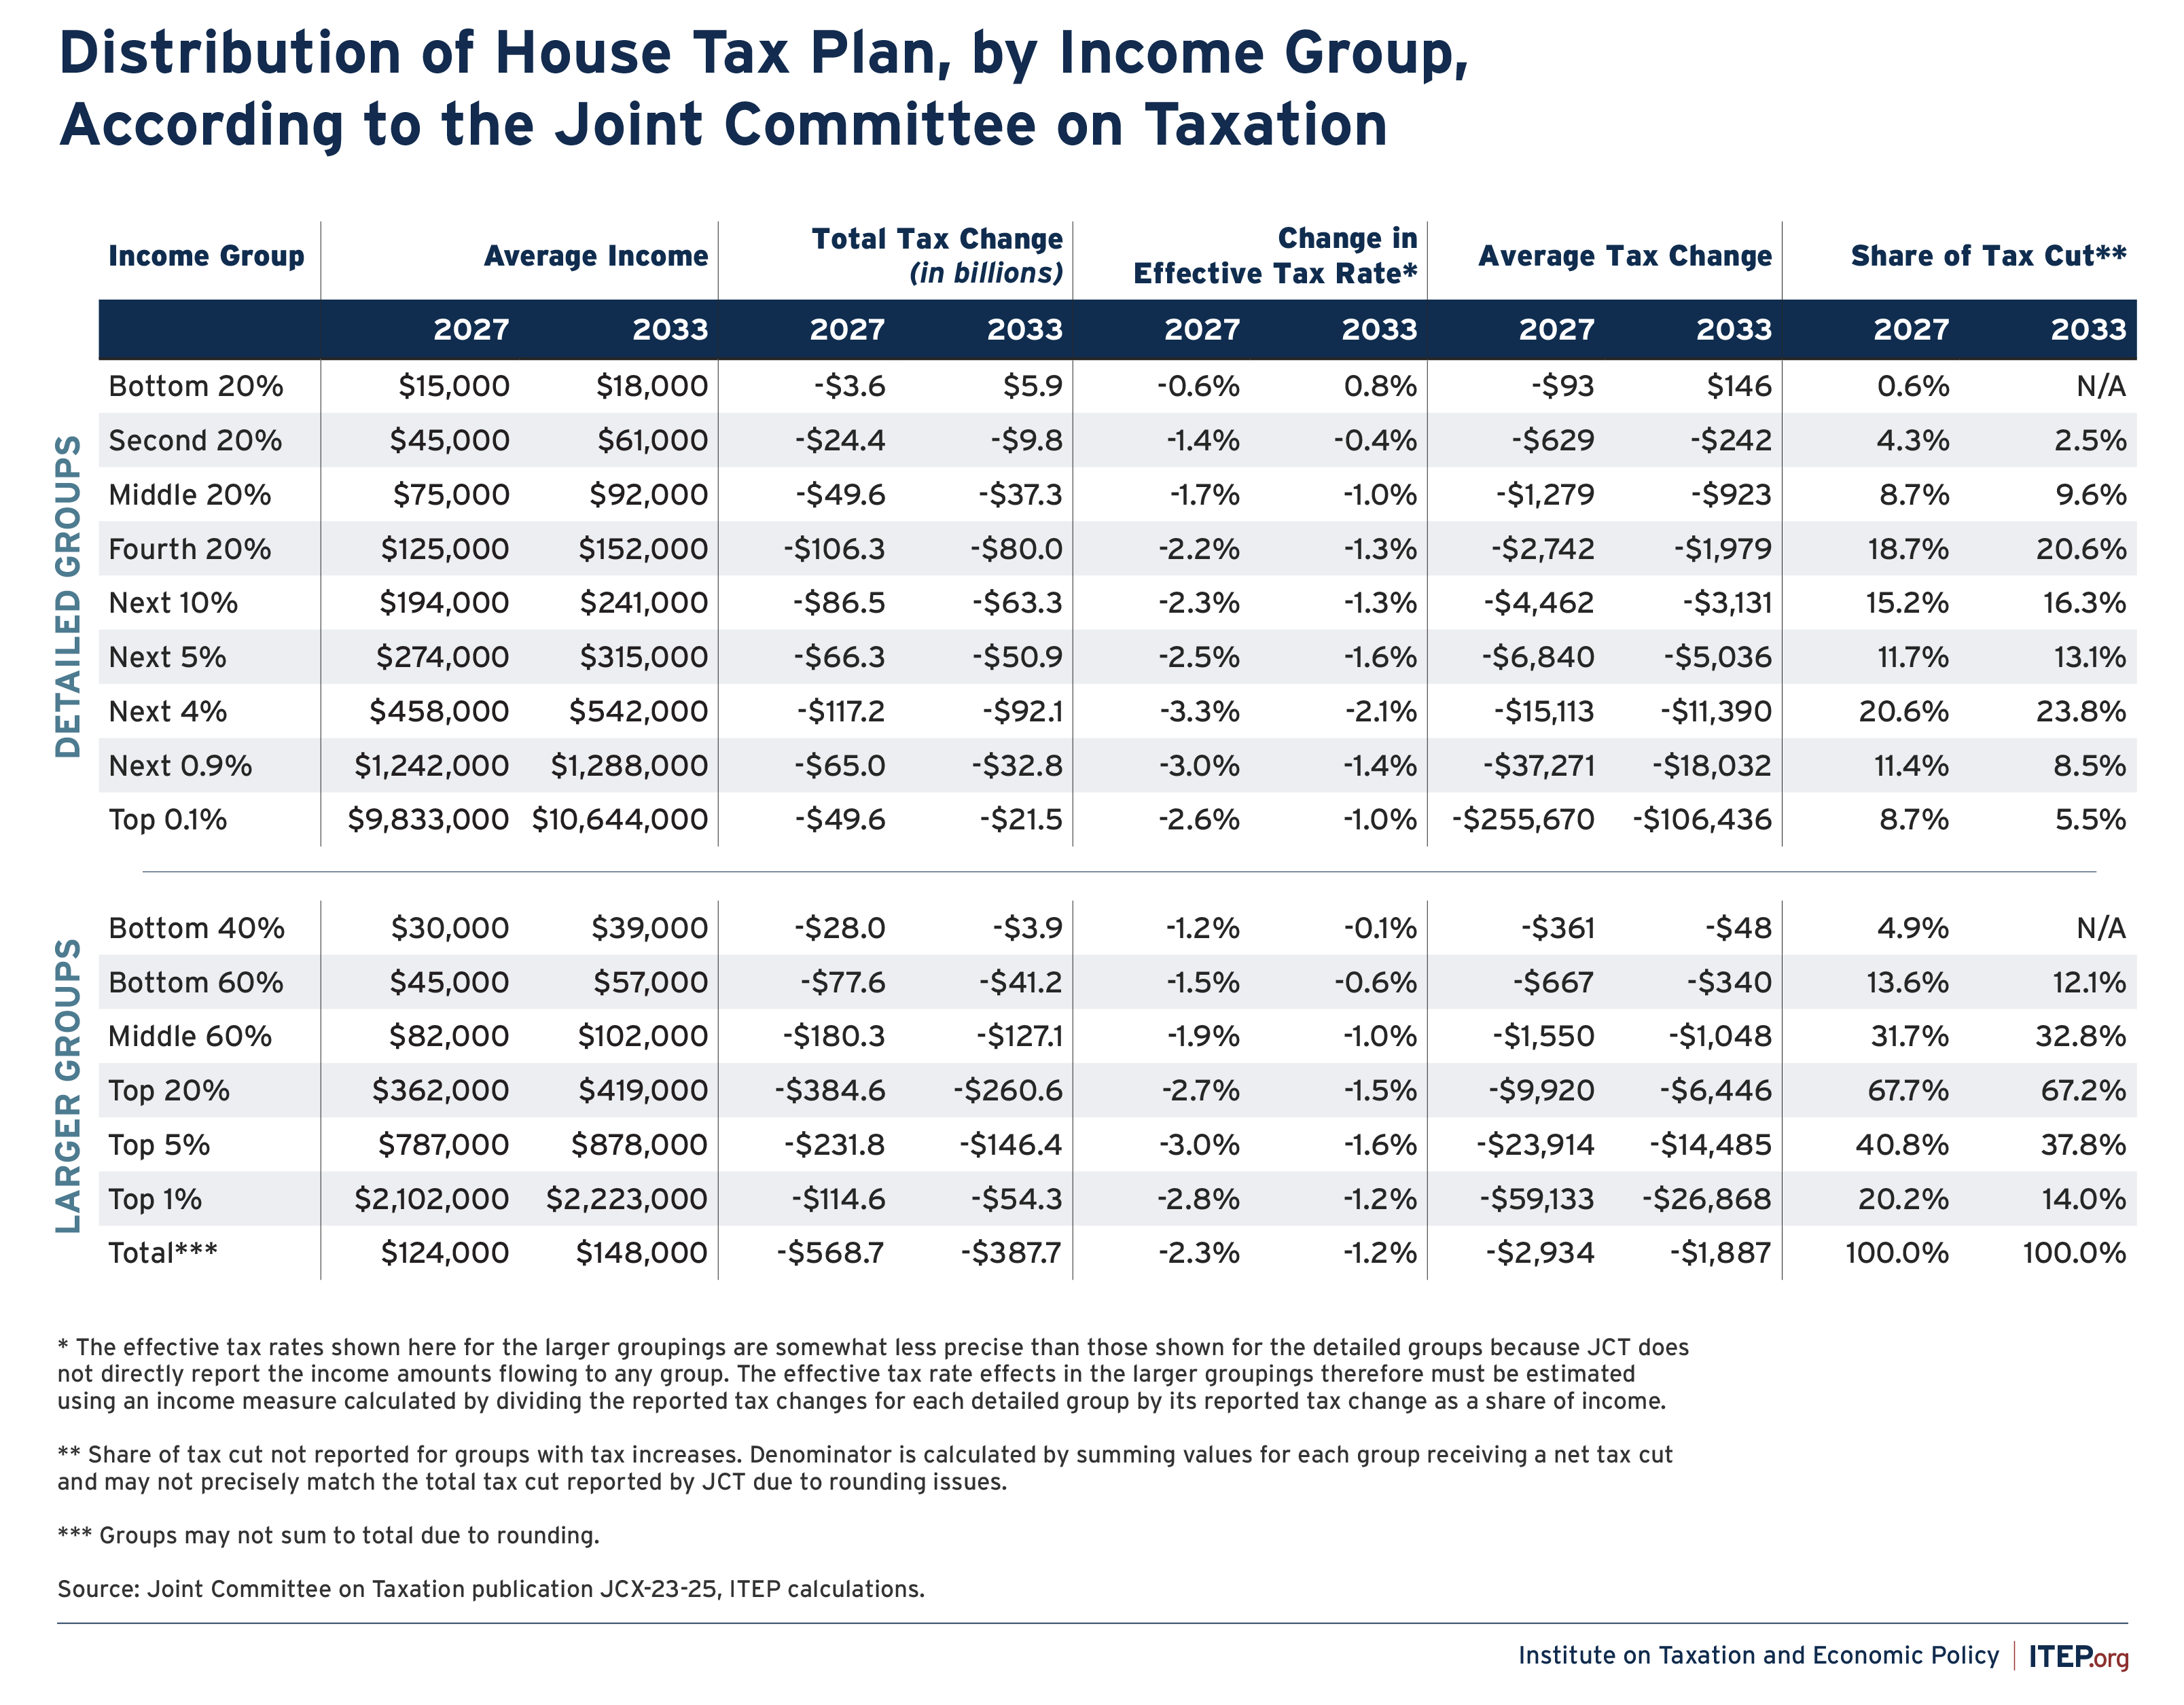
Differences in the average tax cut provided to each group would be dramatic, with the cuts rising significantly alongside income, as seen in Figure 2. While working-class families (defined here loosely as the bottom 40 percent of earners) could expect an average tax cut of $361 in 2027, the nation’s highest-income families (defined as the top 0.1 percent) would receive an average tax cut of at least $255,670 in that year. In reality, the average tax cut for affluent families is likely to be somewhat larger than this, as the JCT’s distributional figures do not include the bill’s estate tax cuts benefiting people with multimillion-dollar estates.
These figures also do not include other potential costs to families likely to be included in the bill, such as deep cuts to Medicaid and food assistance. The Congressional Budget Office recently predicted that the bill would put the nation on a path toward a future where 13.7 million fewer people would have health coverage. Of that amount, 8.6 million would lose coverage as a direct result of provisions contained in the bill, especially those slashing Medicaid. Another 5.1 million would lose coverage because of the expiration of temporary enhancements to the Affordable Care Act premium tax credits which, contrary to what we have seen in past Congresses, this current Congress appears to have no interest in making room for in its legislation.
FIGURE 2
The JCT has also published extremely detailed estimates of the revenue impact of most provisions in the bill. Exploring those estimates yields additional insights into the bill’s most significant changes.
The JCT estimates are reported in a way that mirrors the sorting of the bill itself, which is understandable given the JCT’s role in this debate. Unfortunately, however, the bill’s organizational structure is far from intuitive, and that makes it difficult for observers to understand the overall effects of this legislation.
The section of the bill titled “Make Rural America and Main Street Grow Again,” for example, includes everything from cutting taxes on multinational corporations’ offshore profits to repealing an excise tax on indoor tanning services. Similarly, the section titled “Make America Win Again” includes provisions as varied as scrapping tax credits that help homeowners purchase more energy efficient furnaces, significantly raising taxes on nonprofit foundations and colleges, and eliminating taxes on firearm silencers.
By sorting the JCT’s revenue estimates into more intuitive categories, we can gain a better understanding of how the bill would reshape our tax code. As seen in Figure 3, the bill includes $7.7 trillion in gross tax cuts over the next decade, before considering various offsetting tax increases discussed below. It bears noting that this $7.7 trillion tax cut would be significantly higher if the many temporary provisions in the bill were to be extended, as many lawmakers certainly hope.
FIGURE 3
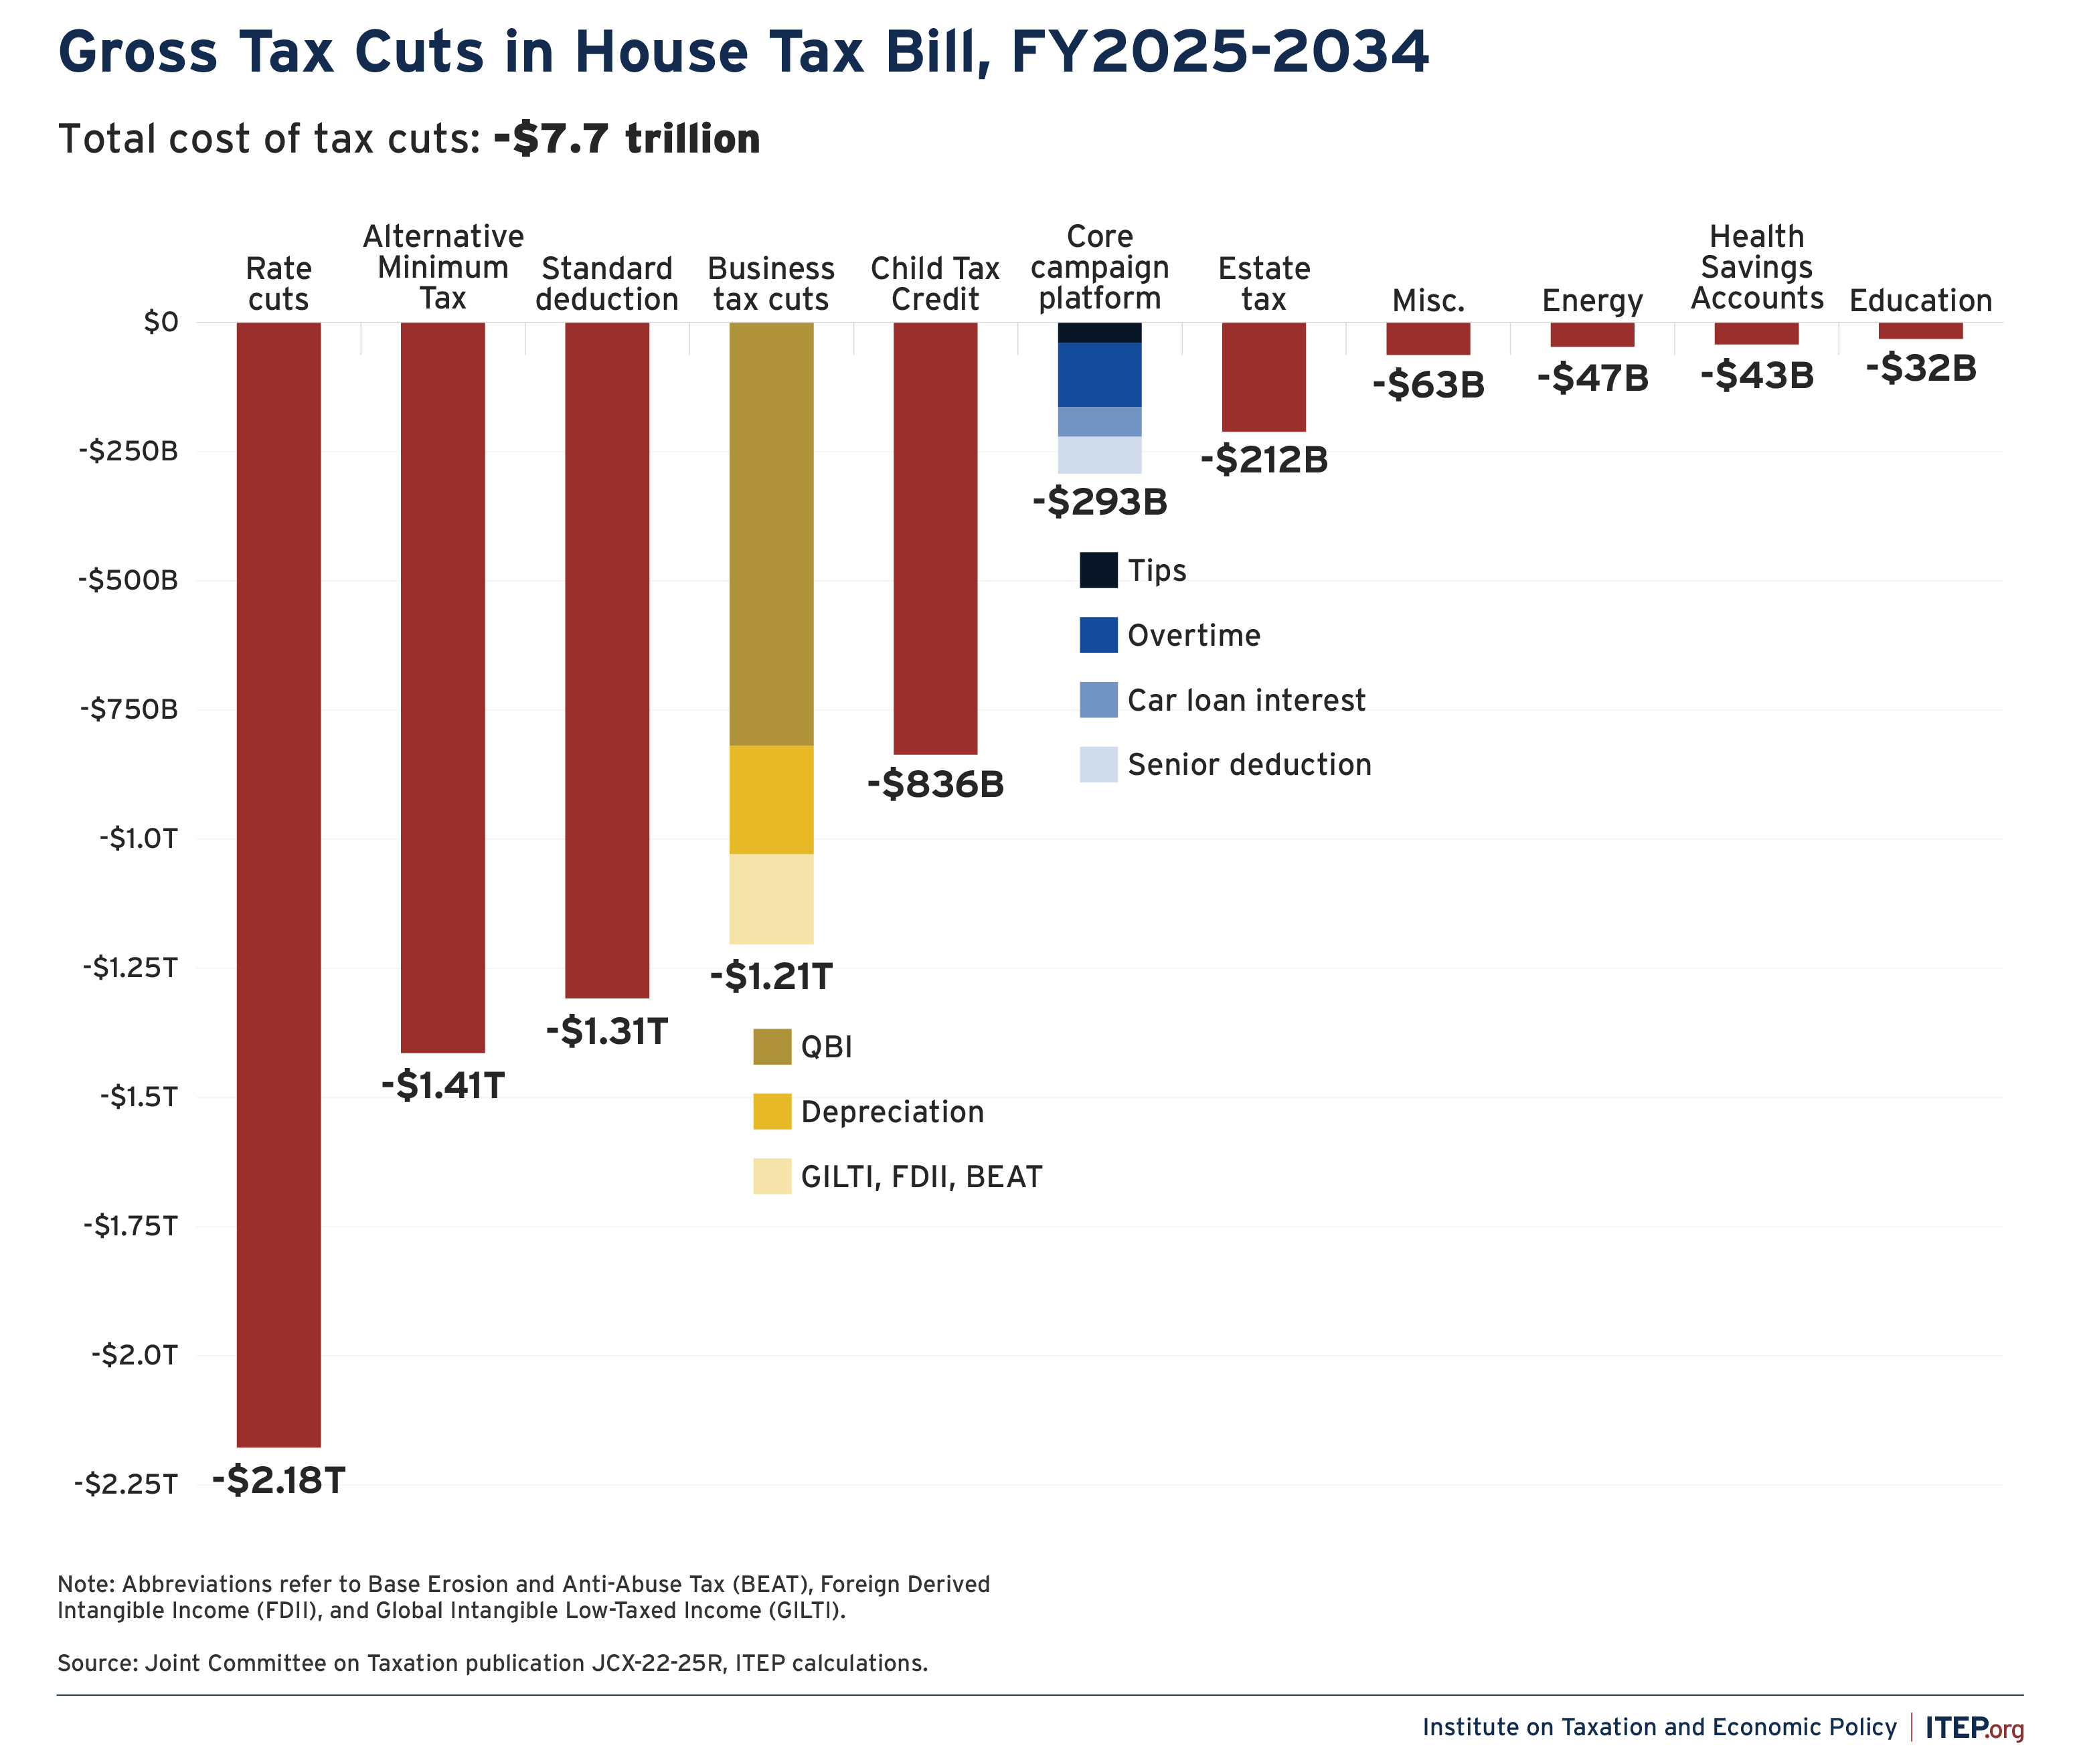
The largest single item in the JCT’s revenue estimates is a reduction in tax rates, which disproportionately benefits high-income earners and plays an important role in the overall regressive tilt of the bill. Other significant regressive tax cuts include a watering down of the Alternative Minimum Tax (AMT), which was designed to ensure that high-income earners pay some minimum amount of tax, as well as a variety of business tax cuts and a substantial estate tax cut on the transfer of extraordinary amounts of wealth from one generation to the next.
Other notable tax cuts include an increased standard deduction and Child Tax Credit (CTC), though it is important to recognize that these cuts are largely offset by certain tax increases affecting broadly similar policies. As seen below in Figure 4, the single largest revenue-raiser in the bill is repeal of personal and dependent exemptions that, prior to 2018, served a purpose very similar to the higher CTC and standard deduction amounts available today. This fact is important to understanding why the bulk of the more progressive tax cuts in the bill are illusory, and why the overall bill tilts regressive despite the presence of these isolated progressive features. According to the JCT score, almost 90 percent of the tax cuts associated with increasing the standard deduction and the Child Tax Credit are offset by tax increases associated with repealing personal and dependent exemptions.
In total, the bill contains $3.9 trillion in gross tax increases over the next 10 years, which are sorted into broad categories in Figure 4. When combined with the $7.7 trillion in gross tax cuts shown above, the net tax cut amounts to $3.8 trillion over the coming decade.
FIGURE 4
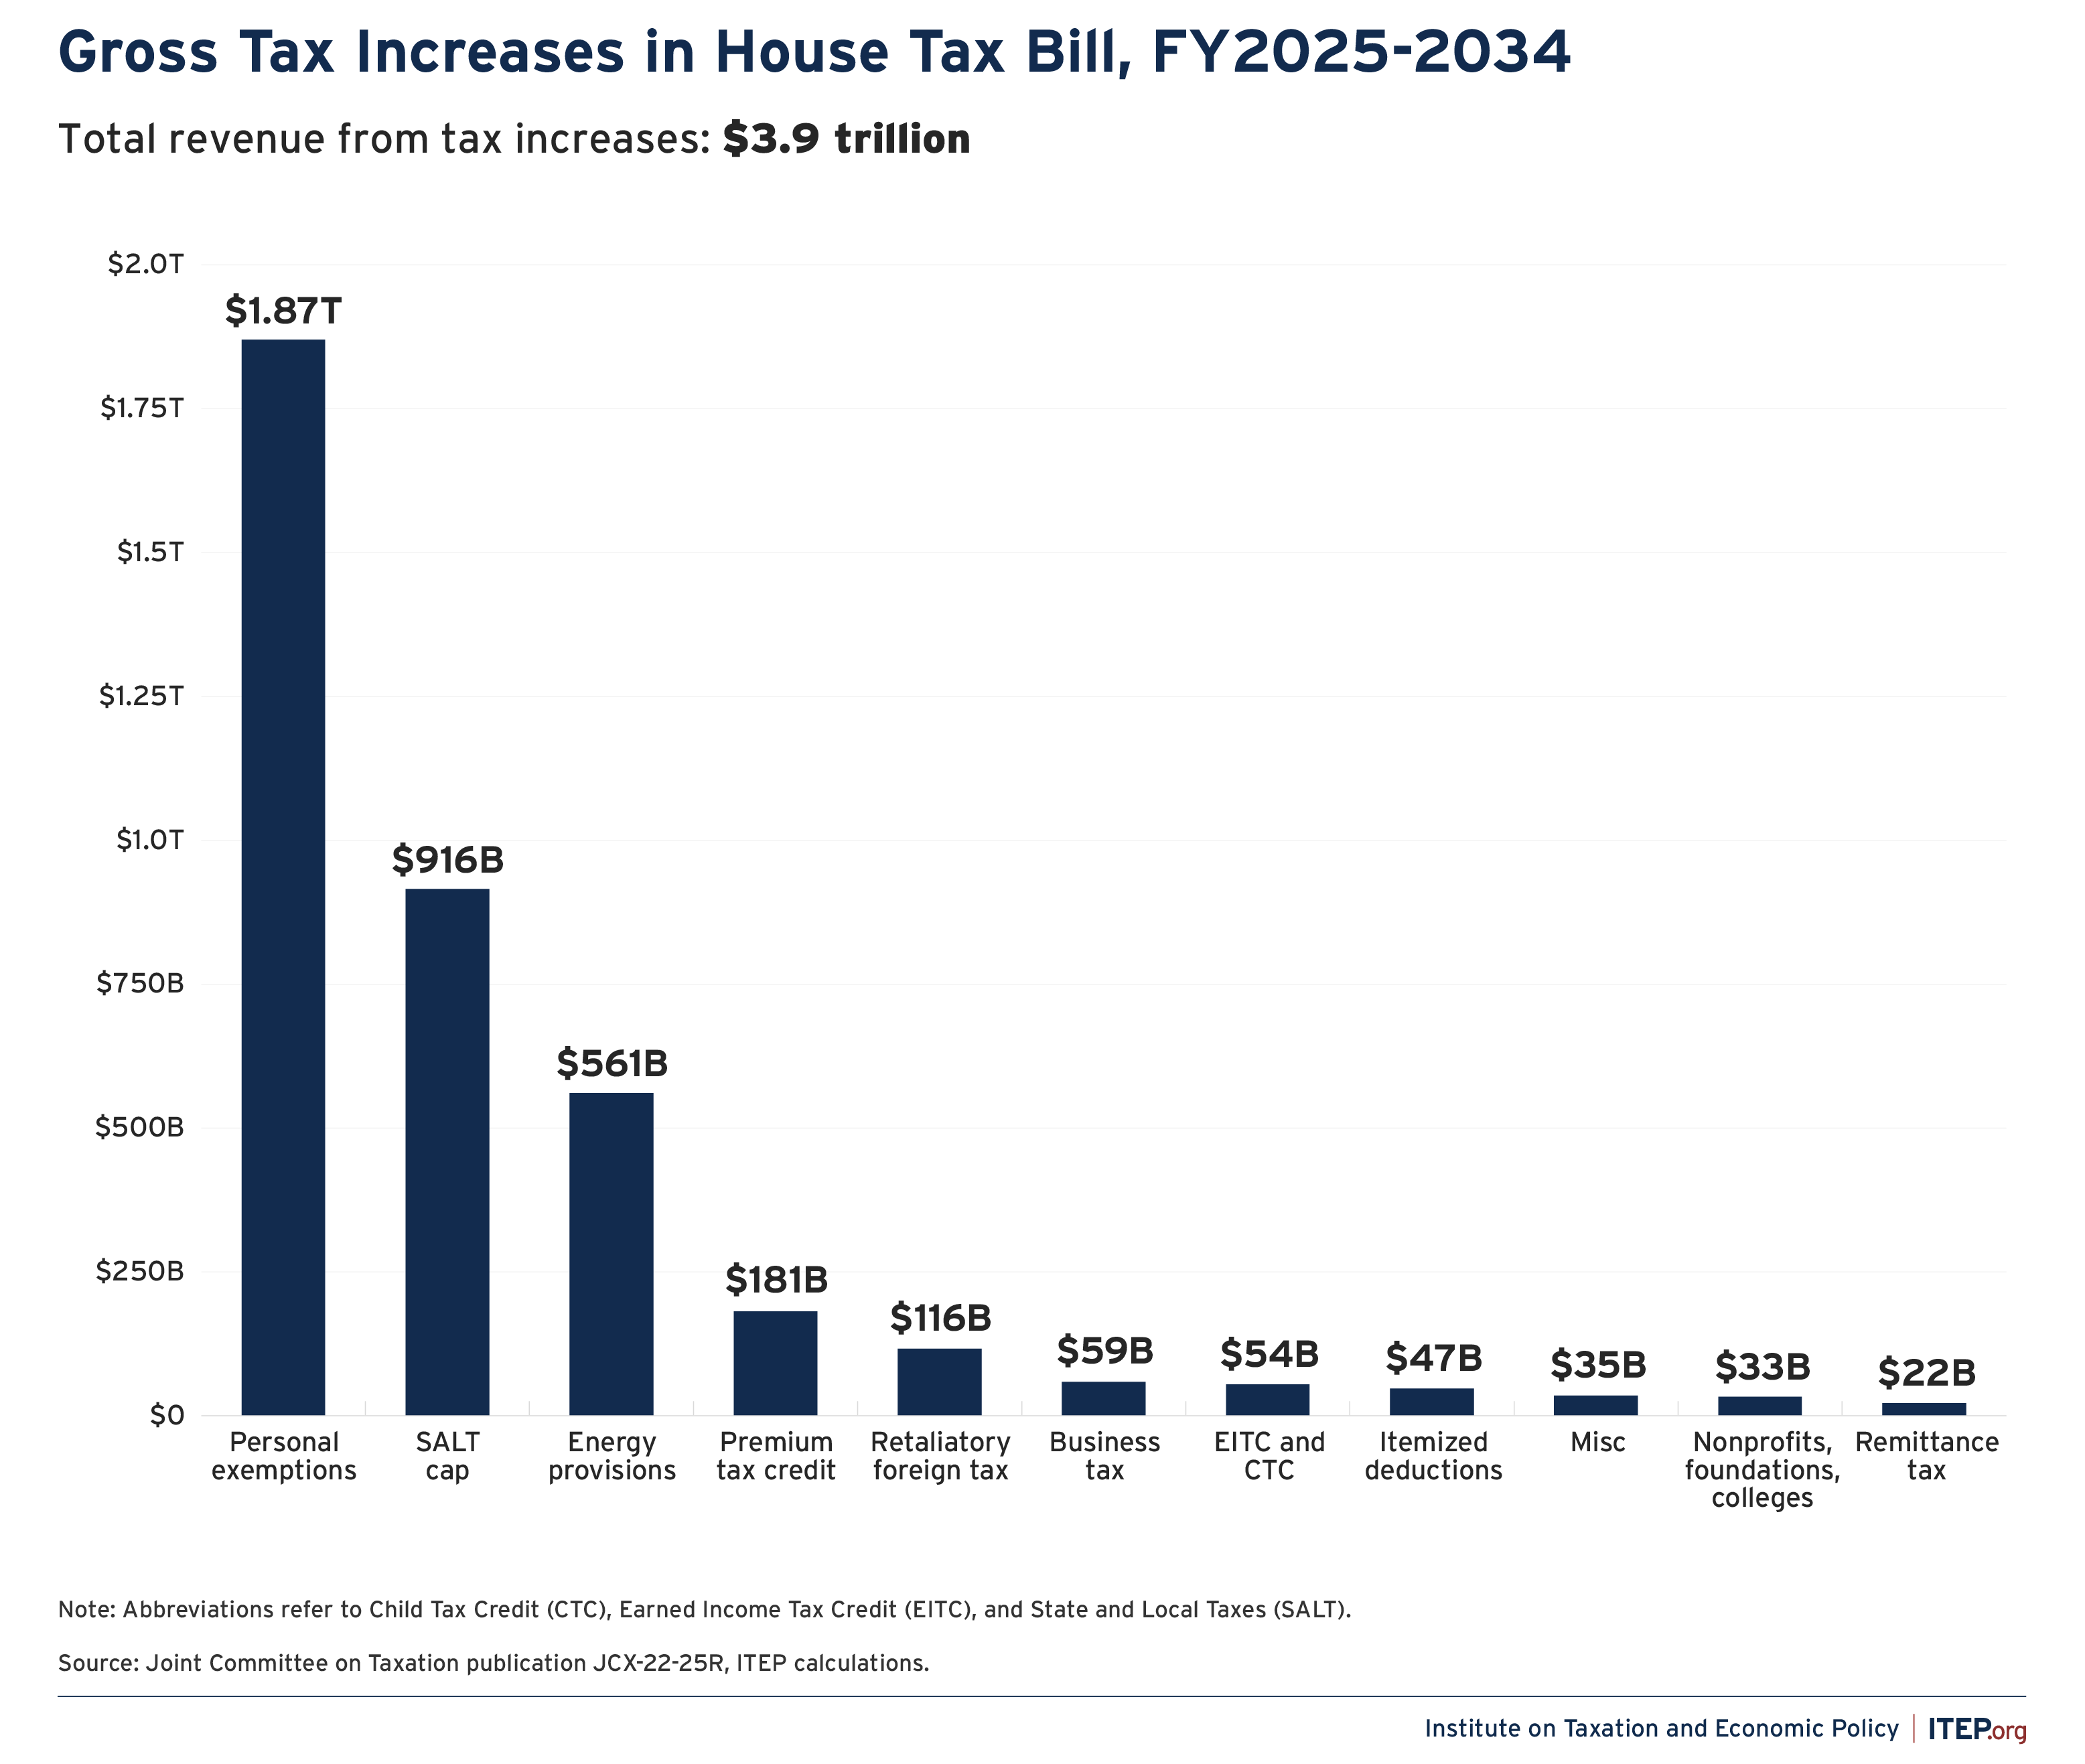
Aside from repealing personal exemptions, the most important revenue-raisers in the bill are the repeal or reduction of a variety of tax provisions meant to help accelerate the nation’s transition to a green energy economy, the paring back of premium tax credits meant to help families afford health insurance, and the extension of caps on the amount of state and local tax (SALT) that taxpayers—especially those living in blue states with more robust income and property taxes—can write off on their federal tax forms. In fairness, some of the tax increase associated with SALT shown in Figure 4 can be thought of as an offset to the AMT cuts shown in Figure 3, as the AMT functioned partly as a limitation on SALT deductions.
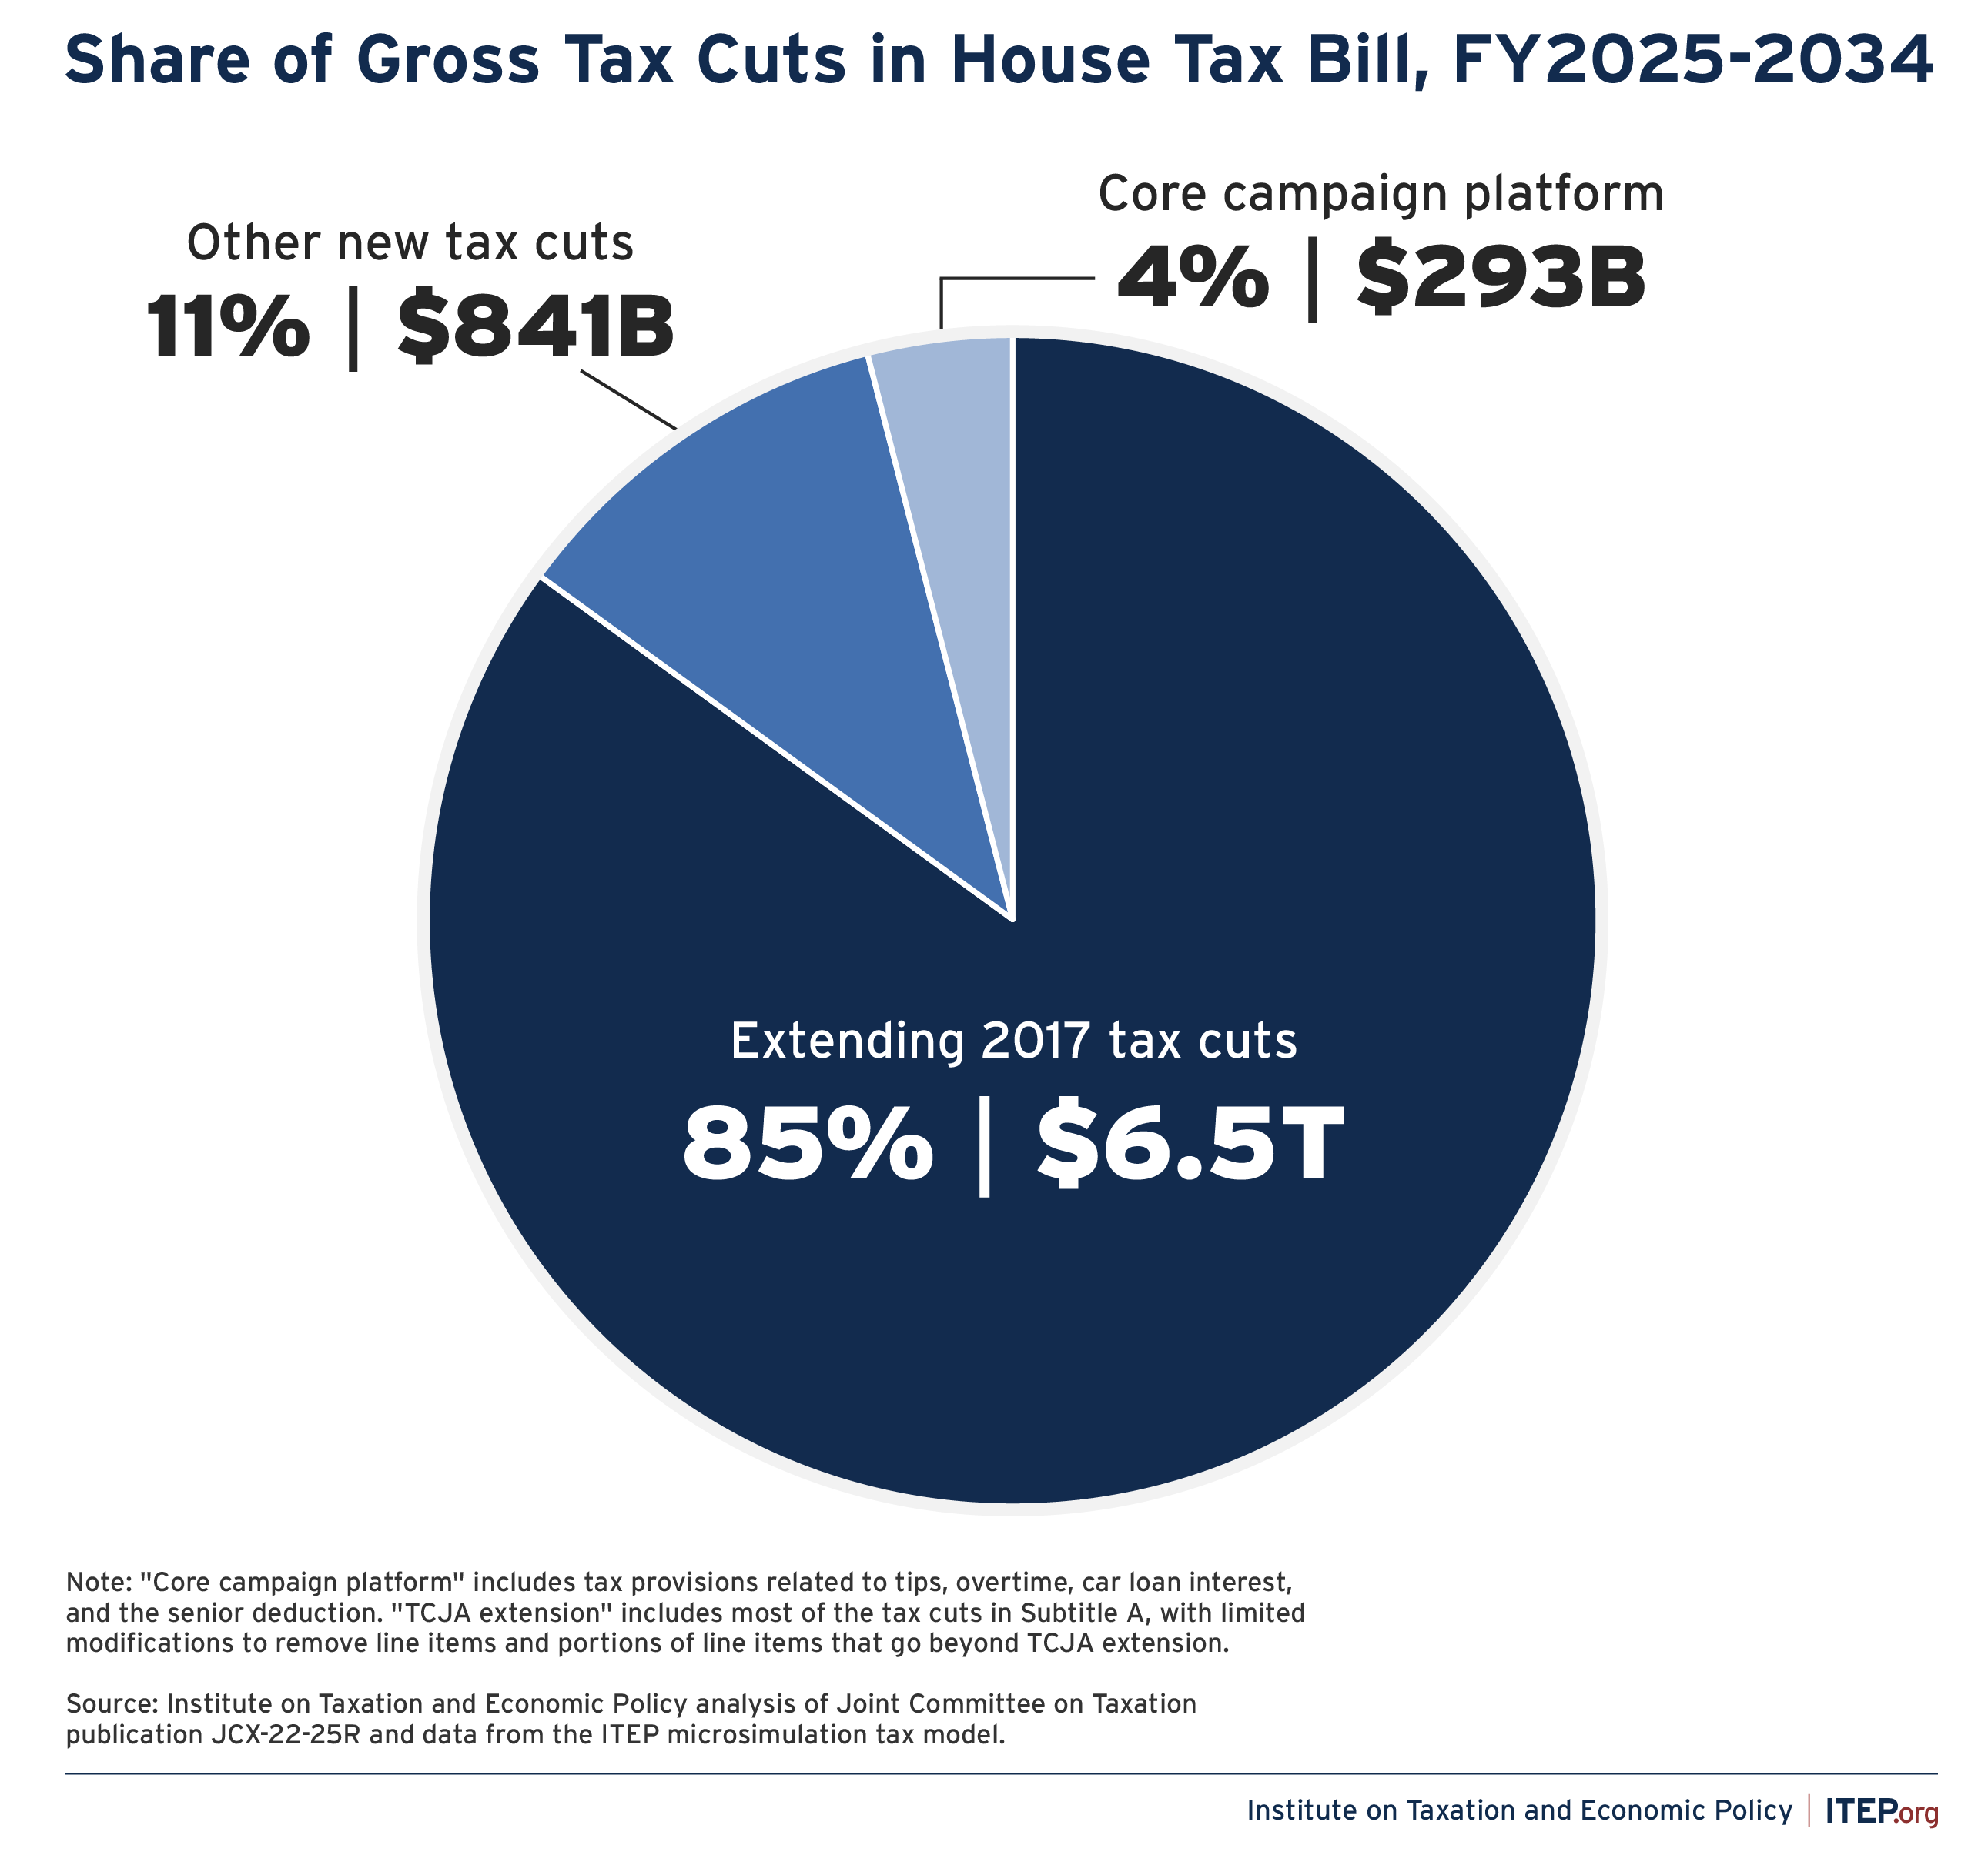
One of the more remarkable takeaways from the JCT’s revenue estimates is just how insignificant the tax provisions discussed most during the last presidential campaign—especially tax breaks for tips, overtime, car loan interest, and senior citizens—are in the broader context of this very large bill. These core features of the Trump campaign’s platform, which continue to dominate much of the debate over taxes today, come at a total cost of $293 billion. While that amount is not trivial, it equals just 3.8 percent of the $7.7 trillion gross tax cut being offered under this bill. The tax cuts being offered to businesses, by contrast, are more than four times larger.
The low price tag attached to the highest-profile tax changes is partly due to their limited reach (most Americans do not receive tips or overtime pay, for instance), and partly due to the fact that the bill’s authors have chosen to place four year sunsets on each of these provisions. The temporary nature of these policies ostensibly targeted toward the working class, as well as others such as temporary enhancements to the Child Tax Credit and the standard deduction, stands in sharp contrast to the permanent nature of some of the bill’s less-discussed provisions such as its permanent cuts to the estate tax and so-called GILTI taxes on multinational corporations’ offshore profits.
As seen in Figure 5, the vast majority (85 percent) of the tax bill represents an extension of the temporary portions of the same tax cuts first enacted by Republicans on a temporary basis in 2017. Of the remainder, only a small sliver are the highest-profile items getting an outsized share of the attention in the current tax debate.
FIGURE 5
Fully unpacking a bill of this size is no easy endeavor, and there is no doubt that many new and important findings regarding its effects will continue to trickle out in the weeks and months ahead. In the meantime, however, the JCT’s work offers a powerful starting point. The JCT has done a tremendous service in producing a range of very high-quality information in a very short amount of time to help the public understand this complex and, as it turns out, highly regressive piece of tax legislation.