Executive Summary
- The gas tax is the single most important source of transportation funding for the federal government. Together, taxes on gasoline and diesel fuel raise over $30 billion per year, or 85 percent of the revenue flowing into the nation’s transportation spending account.
- But gas tax revenues are on an unsustainable course. Over the last five years, Congress has transferred more than $53 billion from the general fund to the transportation fund in order to compensate for lagging gas tax revenues. By 2015, the transportation fund will be insolvent unless an additional $15 billion transfer is made. Larger transfers will be needed in subsequent years.
- Two important, yet completely unrelated developments have combined to greatly reduce the purchasing power of the poorly-designed federal gas tax. Improvements in vehicle fuel-efficiency have cut directly into gas tax revenues by allowing drivers to travel farther distances while buying less gasoline. Meanwhile, inevitable growth in the cost of asphalt, machinery, and other construction materials has put additional strain on the gas tax because its rate has not been adjusted to keep pace. The combined impact of these two factors has reduced the value of the gas tax by 28 percent relative to 1997—the year in which the federal government decided the gas tax should be used exclusively for transportation purposes.
- Comparing the relative importance of these two issues, over three-fourths (78 percent) of the current gasoline tax revenue shortfall is a result of Congress’ failure to plan for inevitable growth in the cost of building and maintaining the nation’s infrastructure. The remainder (22 percent) is due to improvements in vehicle fuel-efficiency. In other words, construction cost growth has been 3.5 times more important than fuel-efficiency gains in eroding the purchasing power of the gas tax.
- This current gas tax revenue shortfall could have been prevented if the tax was better designed. Currently, the gas tax is levied as a fixed amount per gallon sold: 18.4 cents per gallon. A well-designed “variable-rate” tax structure, however, that rises each year alongside construction cost inflation and fuel-efficiency growth would have brought the nation’s transportation account from frequent deficits to surpluses in every year. This reform would have raised a total of $215 billion in revenue to build and maintain America’s infrastructure—including $19 billion in 2013 alone—if it had been enacted in 1997.
- The cost of this reform for the average driver would have been fairly modest. The gas tax rate today would be 29 cents per gallon—or 10.6 cents higher than where it currently stands. This increase would have been phased-in gradually, with the tax rate increase in most years amounting to less than 1 cent per gallon. That 10.6 cent tax increase would cost the average driver $4.66 per month in 2013.
- Such a reform is not without precedent. Congress has already recognized the importance of planning for inflation in other areas of the tax code—most of the nation’s income tax brackets, exemptions, deductions, and credits currently rise with inflation every year. Moreover, a majority of the country’s population already lives in a state that levies a “variable-rate” state gas tax, where the tax rate automatically rises on a regular basis.
- Despite the merits of raising the gas tax, the disproportionate impact of the gas tax on low-income Americans is a real problem. But holding down the gas tax rate is an ineffective tool for preserving the progressivity of the U.S. tax code. Personal income tax provisions like the Earned Income Tax Credit (EITC) are far more helpful to low-income families than a low gas tax rate, and enhancements of such credits can be paired with gas tax reform to offset the regressive impact of the gas tax.
Gas Tax in Context
On October 1, 2013, the federal gasoline tax rate will have been stuck at 18.4 cents per gallon for exactly 20 years. Despite two decades of neglect, the gas tax is the single most important source of transportation funding for the federal government. Taxes on gasoline and diesel fuel raise over $30 billion per year, accounting for 85 percent of the revenue flowing into the nation’s transportation spending account.[1]
But the short-sighted design of the gas tax has put its revenues on an unsustainable course. The gas tax is increasingly falling short of America’s infrastructure needs. In just the last five years, Congress has transferred more than $53 billion out of the nation’s already deficit-ridden general fund in order to compensate for sluggish gas tax revenue growth in the transportation fund.[2] Absent major reform, many more of these Band-Aid fixes will be required in the years ahead, including an additional $15 billion transfer in 2015 just to maintain current funding levels.[3] Transfers significantly larger than this amount will be neefded if Congress decides to address the backlog of maintenance and congestion-reducing projects on hold across the country.
The historic and ongoing decline of the gas tax is a result of its inability to deal with two important developments: fuel-efficiency gains that reduce the gas tax base and normal growth in construction costs that erodes the gas tax rate. This report explains how both of these challenges affect the sustainability of the gas tax, and measures the relative importance of each in contributing to the current transportation funding shortfall. The report then offers a specific recommendation for reforming the gas tax to improve its revenue growth in the face of these two issues. It concludes by showing how implementing this reform earlier could have prevented our current predicament—bringing the nation’s transportation spending account from frequent deficits to constant surpluses at a relatively low cost to the average driver.
Inflation Trumps Fuel-Efficiency
The long-term sustainability of the gas tax is being threatened by two completely unrelated issues: a shrinking tax base, and a shrinking tax rate.
The tax base is the universe of items or activities subject to a tax. In the case of the gas tax, the tax base is simply the amount of gasoline sold. In recent years, as vehicles have become more fuel-efficient, the amount of gasoline sold per mile driven has been on the decline.
Improved vehicle fuel-efficiency is undoubtedly a positive development for the environment, America’s energy independence, and drivers’ pocketbooks, but it is also a challenge for the nation’s poorly designed gas tax. Since 1997, when the federal government began using all gas tax revenues for transportation projects, the average fuel-efficiency of a passenger vehicle on America’s roads has increased by 1.7 miles per gallon (mpg)—from 19.7 to 21.4 mpg.[4] For a vehicle with a 15 gallon gas tank, this means that the average driver is able to wear down the roadways with an extra 25 miles of driving before they have to stop, refuel, and pay anything in gas taxes. Multiply that by 230 million vehicles, and across the span of a year it’s the equivalent of almost 203 billion tax-free miles of travel on America’s roads.[5]
Fuel efficiency’s impact on the gas tax base is often cited as the main reason that gas tax revenues are falling short. In reality, however, the impact of construction cost growth on the gas tax rate has been far more important.
Unlike most taxes that are levied on a percentage-basis (e.g., 5 percent of a product’s price or 25 percent of a taxpayer’s income), the gasoline tax is levied as a fixed amount per gallon—currently 18.4 cents. As lawmakers have long known, however, writing fixed dollar amounts into the tax law inevitably creates problems in the medium- and long-term as inflation erodes their “real” value. For this reason, many features of federal income tax law (e.g., tax exemptions, credits, and tax bracket cut-off points) are specifically designed to rise in lock-step with inflation each year. Unfortunately, this type of “inflation indexing” has not been implemented with respect to the federal gas tax.
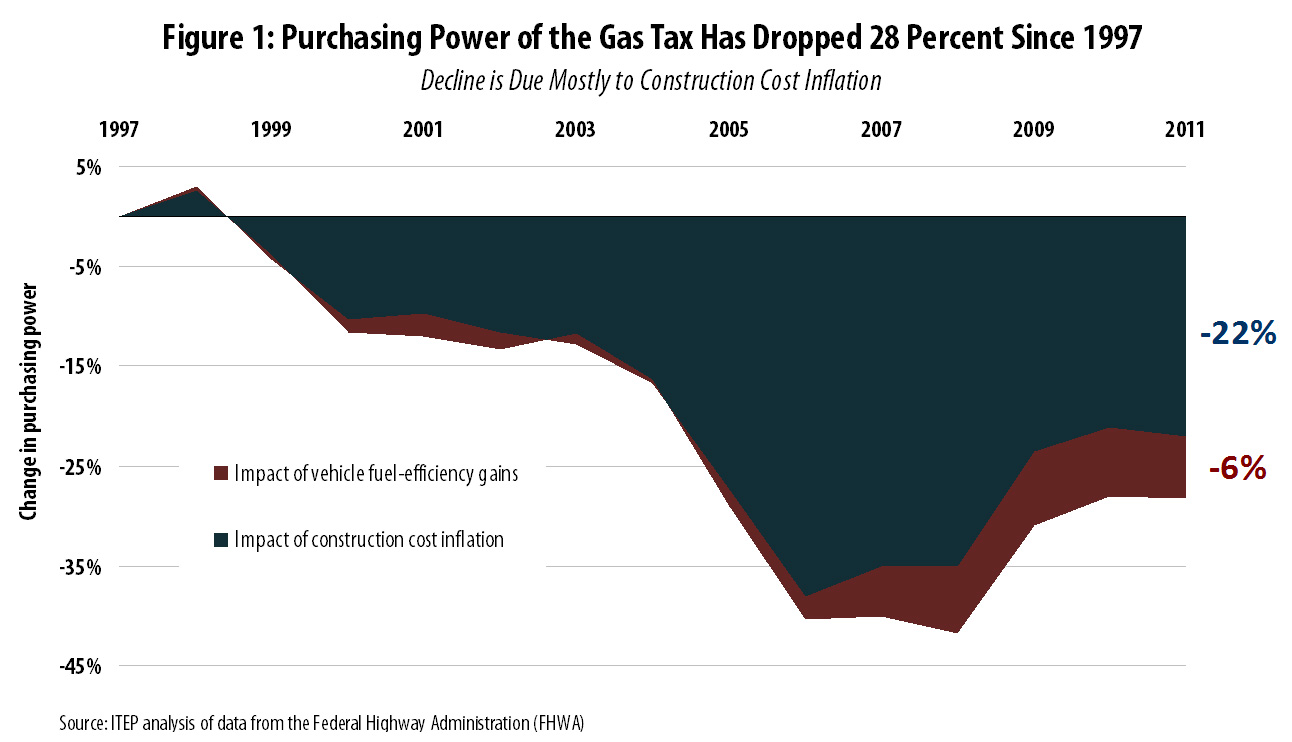 As Figure 1 shows, over the same period of time that fuel-efficiency gains took a 6 percent bite out of the purchasing power of the gas tax, construction cost inflation reduced the tax’s value by 3.5 times that amount, or 22 percent.[6] Put another way, over three-quarters (78 percent) of the current gas tax shortfall can be traced back to growth in the cost of construction materials and labor. The remaining 22 percent of the shortfall is due to fuel-efficiency gains.[7]
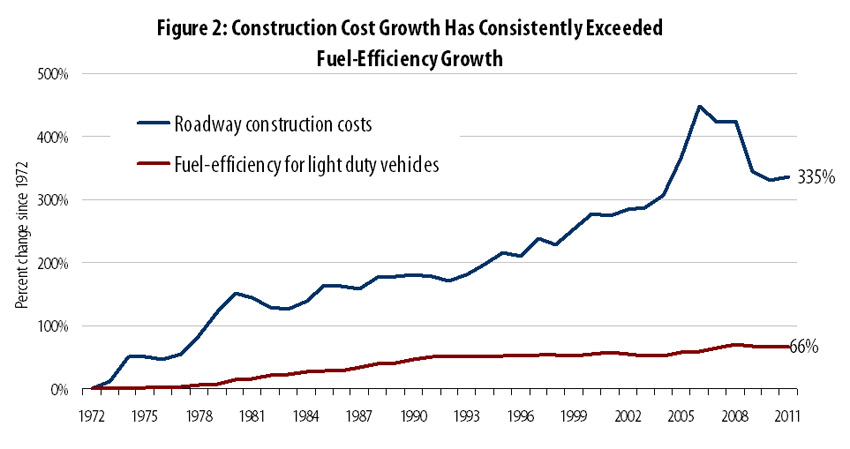 This trend is nothing new. As Figure 2 shows, construction cost growth has routinely outpaced fuel-efficiency gains over the last 40 years.
Interestingly, however, construction costs have actually grown more slowly than the general inflation rate faced by consumers. While construction costs grew by 335 percent between 1972 and 2011, consumers saw the products they buy increase in price by 438 percent.[8] This trend holds true in the more recent past as well—the 29 percent growth in construction costs seen since 1997 trails the 40 percent growth that occurred in consumer prices over that period.
Clearly, construction costs are not spiraling out of control. Rather, the extremely poor design of the gas tax has left it unprepared to deal with the medium- and long-term effects of even normal levels of growth in construction costs.
|
Vehicle Miles Traveled Much like improvements in vehicle fuel-efficiency, decreases in the amount of driving, or “vehicles miles traveled” (VMT), reduce gas tax revenues by causing gasoline purchases to fall. For decades, this issue was of little practical significance as both total VMT and per-capita VMT grew steadily. At the turn of the century, however, per-capita VMT unexpectedly began to plateau, and actually began declining in 2005. Total VMT followed a similar pattern, falling in 2007 for the first time in nearly thirty years.* While some of the more recent decline is likely due to the late 2000’s recession, much of it can be traced back to changes in Americans’ transportation preferences and needs. In particular, young Americans’ habits began to change dramatically before the recession began, making it unlikely that historical trends will resume once the economy fully recovers.** Americans, and younger Americans in particular, have opted to cut back on their driving in two broad ways: First, advancements in technology have allowed more would-be drivers to not only work from home, but to socialize from home as well. One poll found that more than half of all young people “sometimes choose to spend time with friends online instead of driving to see them.” To the extent that reduced driving can be traced to people simply having less use for the transportation system, any resulting decline in gas tax revenue is of little concern because wear-and-tear and the need for additional system capacity should decline as well. Second, public transit ridership is on the rise, again driven largely by changes in young people’s habits. This is good news for drivers as more transit ridership means less congestion on the roadways. But this trend also cuts into gas tax revenues without necessarily reducing strain on the transportation system overall. Since a portion of the federal gas tax is reserved for mass transit, this development has resulted in less funding for both roads and transit, and may warrant even larger gas tax increases beyond those needed to offset fuel-efficiency gains and construction cost inflation. *Puentes, Robert. “The Road… Less Traveled.” Brookings Institution. December 2008. ** Davis, Benjamin, et al. “Transportation and the New Generation.” Frontier Group and U.S. PIRG Education Fund. April 2012. |
Outlook for the Future
Going forward, construction cost growth and vehicle fuel-efficiency gains will both continue to be major issues affecting the gas tax.
Since 1972, the earliest year for which data are available, transportation construction costs have grown by an average of roughly 4 percent per year.[9] While it’s unlikely that the mix of transportation investments being made in the years ahead will exactly mirror those of the past, there is also no reason to expect that the transportation construction industry will suddenly become immune to the inflationary pressures felt throughout the rest of the economy. Construction cost inflation will continue to affect the purchasing power of the gas tax in the years ahead.
In regard to vehicle fuel-efficiency, the signs of what lies ahead are even clearer. New government standards are expected to boost the average fuel-efficiency of most new vehicles from 29.7 to 34.1 mpg between 2012 and 2016, and then to 49.6 mpg by 2025.[10] That’s a 67 percent improvement in just 13 years. (By comparison, fuel-efficiency for new cars over the previous 13 years increased by just 20 percent.[11])
The full effect of this development will not be felt until at least 2040, since it depends on older vehicles being replaced by the newer, more fuel-efficient models. But there is little doubt that the fuel-efficiency of the vehicle fleet on the nation’s roadways will soon begin to climb significantly faster than in years past. In other words, while growth in vehicle fuel-efficiency is a relatively small contributor to the gas tax revenue shortfalls that exist today, it will become an increasingly important issue in the years ahead.
Recommendation
The current design of the gas tax has left it incapable of raising an adequate amount of revenue in the face of rising fuel-efficiency and construction costs. But this need not be the case. The useful life of the gas tax could be extended far into the future if the tax is reformed so that its rate automatically adjusts to keep pace with construction costs and vehicle fuel-efficiency. Reform should involve four main components (technical details are explained in Appendix A):
- First, the gas tax rate should be increased to compensate for the loss in purchasing power described earlier in this report. The Congressional Budget Office (CBO) estimates that the tax rate would need to rise by 10 cents per gallon in 2015 to maintain current funding levels.[12] This is generally in line with the analysis shown later in this report, which indicates that the rate would have to rise by 10.6 cents per gallon in 2013 to offset the last 16 years of inflation and fuel-efficiency gains. The CBO also estimates that an increase significantly larger than either of these amounts would be needed to fund all projects where the benefits exceed their costs.[13]
- Second, the gas tax rate should be allowed to rise over time alongside construction cost inflation, much like federal income tax brackets and exemptions already rise every year in proportion to inflation. Florida, Massachusetts, and Maryland currently levy their gas taxes in roughly this manner, though their tax rates are tied to the general inflation rate faced by American consumers rather than the specific inflation rate in the cost of transportation construction.[14] Another fourteen states and the District of Columbia tie their gas tax rates to inflation in the price of gasoline.[15]
- Third, the gas tax rate should also rise over time as vehicle fuel-efficiency improves. If the average vehicle’s fuel-efficiency were to jump by 3 percent (from 30 mpg to 30.9 mpg, for example), the tax rate would increase by an identical 3 percent in order to prevent a decline in the overall amount of taxes paid per mile driven. This would not only allow for a consistent level of funding for transportation, but would also encourage a race-to-the-top in terms of vehicle fuel-efficiency. Drivers’ decisions to buy more fuel-efficient cars would trigger a gas tax increase that would encourage more drivers to follow their lead.
- Fourth and finally, in order to ensure that these tax rate adjustments do not lead to volatile gas tax collections, two mechanisms should be used to prevent large changes in the tax rate from year to year. First, average measures of construction costs and fuel-efficiency from the previous few years should be used to “smooth” the impact that a single unusual year of growth in these measures could have on the tax rate. Second, a backstop limit on changes in the tax rate should be imposed, preventing the rate from ever changing by more than 10 percent in a single year, for example.[16]
Impact on the Transportation Budget
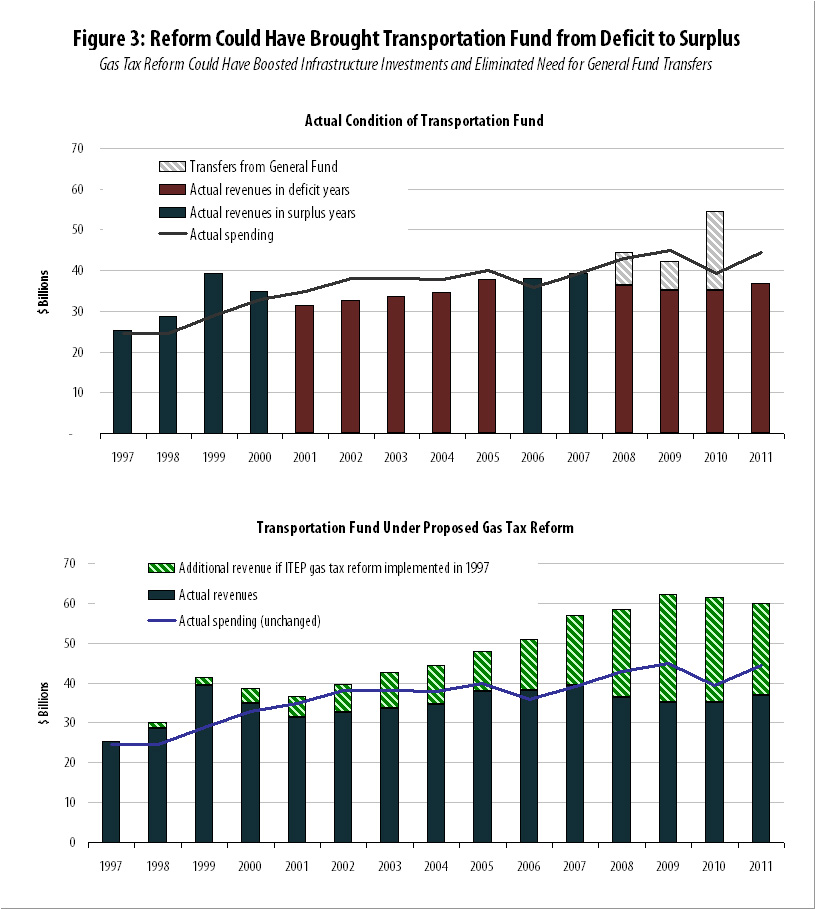
To illustrate the impact of the reform proposed in the previous section, Figure 3 shows how the federal government’s transportation fund would have fared if the gas tax rate had been tied to growth in construction costs and fuel-efficiency starting in 1997—the year in which the federal government decided to fully dedicate gas tax revenues to the fund.
Assuming diesel tax rates were increased to maintain the current balance between gasoline and diesel tax revenues, $215 billion in additional transportation revenue would have been raised over the 1997-2013 period, including almost $19 billion in 2013 alone.[17] Under this scenario, the nation’s transportation account would have been brought from frequent deficits to surpluses in every year. $53 billion in general fund transfers could have been avoided and nearly $162 billion in additional investments in America’s infrastructure could have been made while still keeping the transportation fund in balance.
Impact on Drivers
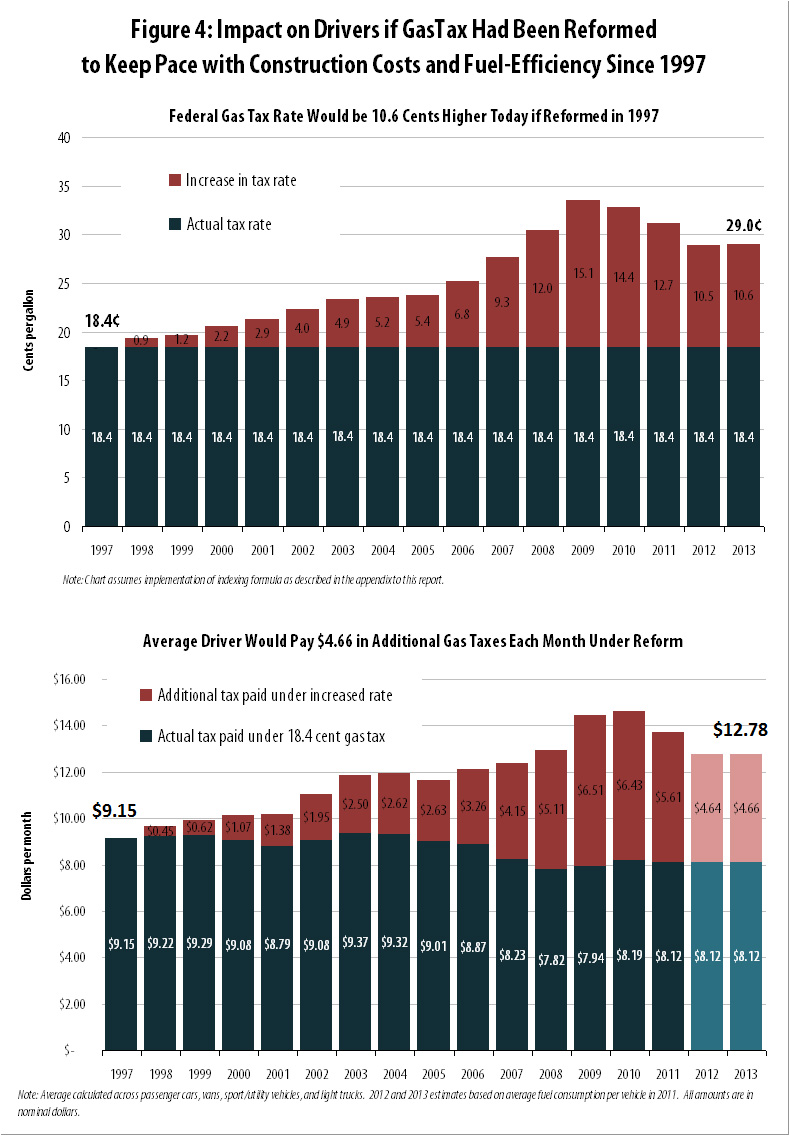
Despite the major impact this reform would have had on America’s transportation budget, the impact on the average driver would have been fairly modest. Figure 4 shows that if lawmakers had implemented gas tax reform in 1997, the gas tax today would be 29 cents per gallon—or 10.6 cents higher than where it currently stands.[18] This increase would have occurred gradually, with the rate rising by no more than 1 cent per gallon in most years, and never by more than 3.1 cents in any given year.
For the average driver, a 10.6 cent increase in the gas tax would amount to $4.66 in additional gas tax payments per month.[19] But the payoff associated with that $4.66 payment could be significant. Americans currently waste 5.5 billion hours and 2.9 billion gallons of fuel stuck in traffic each year.[20] At the same time, pavement conditions on nearly one in three of America’s major roads are rated either poor or mediocre, and one out of every nine American bridges is structurally deficient.[21] Infrastructure improvements financed through the gas tax could lessen all of these problems, saving drivers both time and money.[22]
|
Gas Tax Fairness While most drivers could afford to pay $4.66 in additional gas taxes each month with little problem, this may not be the case for families living in poverty. Critics of the gas tax correctly note that the gas tax is regressive—requiring lower- and middle-income families to devote far more of their household budget to paying the tax than the wealthy. ITEP estimates that nationwide, the poorest 20 percent of families spend 1.7 percent of their incomes paying federal, state, and local gas taxes, compared to just 0.2 percent of income for the nation’s most affluent taxpayers. Because of this basic inequity, Minnesota lawmakers chose to pair a 2008 gas tax increase with a new tax credit for low-income taxpayers, although that credit was later repealed to fill the state’s budget gap when revenues plummeted during the recession. Five states currently offer low-income tax credits specifically designed to offset regressive taxes on consumption—typically the sales tax. This same basic model could be applied to the gas tax. For lawmakers concerned with reducing tax regressivity, targeted tax credits are a far better option than holding down the gas tax rate. Roughly one-third of all gas tax revenues come from the wealthiest 20 percent of taxpayers. Enacting a new low-income credit or expanding an existing one such as the Earned Income Tax Credit (EITC) can be done in a way that aids only those families for whom the gas tax and other regressive taxes are truly unaffordable. |
Reform in Context
The gas tax reform proposed in this report is not radical. Seventeen states and the District of Columbia already levy their gas taxes in a manner where the tax rate is automatically adjusted to keep pace with inflation. In total, over half the country’s population lives in a state with a “variable-rate” gas tax of this sort.[23]
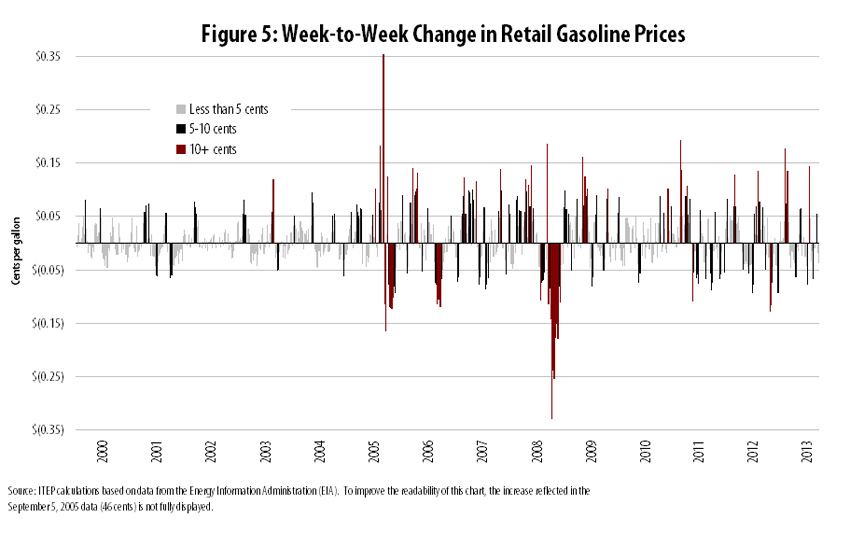
Moreover, the impact of gas tax reform on gas prices would hardly be unprecedented. Since January of 2000, American drivers have watched the retail price of gasoline swing up or down by more than 10 cents per gallon in a single week on 52 separate occasions. Swings of more than 5 cents per gallon have occurred a staggering 194 times over that same period—an average of more than once per month.
In this context, the impact of gas tax reform on gas prices would likely be undetectable to most drivers. Gas taxes make up a small, and shrinking, share of the price drivers pay at the pump.[24] This would hold true even if the gas tax were significantly increased and reformed.
Conclusion
Federal gas tax revenues are falling short of the nation’s transportation infrastructure needs—a problem that will worsen significantly in the years ahead unless the gas tax is increased and reformed. Most of the gas tax revenue shortfall occurring today is a result of the tax’s failure to keep pace with inevitable growth in the cost of building and maintaining transportation infrastructure. Vehicle fuel-efficiency gains have played a more modest role in reducing gas tax revenues, but will be an increasingly important issue in the years ahead.
The challenge posed to the gas tax by each of these developments can be addressed through the reform proposed in this report: allowing the gas tax rate to be automatically adjusted each year to match growth in construction costs and in vehicle fuel-efficiency. Had this reform been implemented in 1997, the gas tax rate would be 10.6 cents higher today and drivers would be paying an average of $4.66 in additional taxes each month.
The revenues raised by reform would have brought the nation’s transportation spending account from frequent deficits to surpluses in every year. Over $162 billion in additional transportation investments could have been made over the last sixteen years, and $53 billion in deficit-financed transportation spending from the nation’s general fund account could have been avoided.
Appendix A: Implementing Reform
This report proposes reforming the federal gas tax so that its rate automatically varies alongside both transportation construction costs and vehicle fuel-efficiency, subject to certain limitations on volatility in the tax rate. In practice, this reform could be implemented in a variety of ways. One such approach, used to perform the analyses contained in figures 3 and 4 of this report, is explained in this appendix.
Construction cost growth is measured using data from the national Composite Bid Price Index (BPI), extended to the present day using the National Highway Construction Cost Index (NHCCI). (The BPI was discontinued in 2006 and replaced by the NHCCI.) These indexes measure growth in the cost of both the materials and labor involved in road construction. We know of no comparable data on the cost of providing public transit, but these indexes are a useful proxy for total transportation cost growth since over 80 percent of federal gas tax revenue is directed toward highway purposes.
Data from the Federal Highway Administration’s (FHWA) Highway Statistics series (Table VM-1) were used to measure growth in the average fuel-efficiency of vehicles operating on America’s roadways in any given year. (While data on the fuel-efficiency of vehicles manufactured during each new “model year” are cited more frequently by researchers and journalists, they do not provide an accurate picture of the strain being placed on the gas tax in any given year because only a fraction of vehicles actually using the roads are made in the most recent model year.) The FHWA data are not organized into separate categories for gasoline and diesel-powered vehicles, but we used fuel-efficiency data for passenger cars, vans, sport/utility vehicles, and light trucks as a proxy for the fuel-efficiency of all gasoline-powered vehicles. For 1997-2006, fuel-efficiency was calculated by dividing the total miles driven by “passenger cars” and “other 2-axle 4-tire vehicles” by the total amount of fuel consumed by these vehicles. The same method was used for 2007-2011, but FHWA renamed these categories to be simply “light duty vehicles.”
After assembling the data described above into separate indexes measuring both construction costs and vehicle fuel-efficiency, a trailing average of each index was taken before using those indexes to adjust the gas tax rate. This was done to smooth volatility in the gas tax rate over time, since an average of construction costs and fuel-efficiency over the previous few years is less vulnerable to sudden changes than an index based entirely on the most recent year’s data. (The analyses in figures 1 and 2 use actual, rather than average, index values because these analyses are purely informational, and are unrelated to the specific reform proposed in this report.)
A three-year trailing average was used for the construction cost index. For example, to calculate the hypothetical gas tax rate under reform in 2013 (see Figure 4), an average was taken of the construction cost index values for 2010, 2011, and 2012.
Due to data limitations, this three-year average measure of construction costs was paired with just a two-year trailing average index for vehicle fuel-efficiency. Full-year construction cost estimates become available during the first few months of the following year, but fuel-efficiency data are reported significantly later. Fuel-efficiency data for 2012, for example, will not be released until late 2013—too late to be used in setting the gas tax rate for 2013. As a result, the 2013 tax rate calculation performed in this report relied on an average of fuel-efficiency data for 2010 and 2011. Given current data release schedules, implementing this report’s recommendation exactly as calculated would require adjusting the tax rate roughly mid-year or later.
Once these trailing average indexes were created, adjusting the gas tax rate to keep pace with both indexes was done using this equation:
rn = r0 * (cn/c0) * (fn/f0)
Where:
rn and r0 = gas tax rate in the current year and base year
cn and c0 = construction cost index in the current year and base year (3-year trailing average)
fn and f0 = fuel-efficiency index in the current year and base year (2-year trailing average)
Subject to the limitation that, in the interest of reducing tax rate volatility, the tax rate cannot change by more than 10 percent from one year to the next:
| rn – rn-1 | ≤ 0.1 * rn-1
Deciding on the precise level at which to set the volatility cap inevitably involves some subjectivity. We chose 10 percent in part because of precedent set at the state level—Kentucky, West Virginia, and the District of Columbia all cap annual changes in their gas tax rates at 10 percent, while Maryland caps changes at 8 percent. Had this 10 percent cap been in place alongside gas tax reform over the 1997-2013 period examined by this study, the cap would have been reached in three of sixteen years. Specifically, the cap would have limited tax rate increases in 2007, 2008, and 2009 that would have otherwise occurred as a result of rapid construction cost growth during the late 2000’s construction bubble.
Appendix B: Additional Methodology
The gas tax rate calculations used in figures 3 and 4 are explained in Appendix A. To gauge how these increased tax rates would have impacted the average driver, we used FHWA data on the average annual fuel consumption by light duty vehicles for 1997-2011 (see FHWA’s Highway Statistics series, Table VM-1). Given the fairly small size of the gas tax rate changes being analyzed, we assumed that any increase in gas prices associated with those changes would not affect the amount of gasoline consumed per vehicle.
To estimate the impact that higher gas tax rates would have had on the federal transportation budget between 1997 and 2011, we multiplied the higher gas tax rate estimated for each year by the number of taxable gallons of gasoline sold in that year (see Highway Statistics, Table MF-2). Again, we assumed no changes in gasoline consumption as a result of the higher tax rate. Diesel tax revenues, which typically make up about one fourth of total motor fuel tax collections in each year, were assumed to rise in order to maintain the same proportion of gasoline versus diesel tax revenues collected in each year. In reality, diesel tax rates would likely be adjusted based either on a separate index measuring growth in the fuel-efficiency of diesel-powered vehicles, or based on a new highway cost allocation study measuring the relative contribution of gasoline versus diesel-powered vehicles in contributing to wear-and-tear on the nation’s roadways.
Actual Highway Trust Fund revenues, expenditures, and general fund transfers for years up to 2011 were taken from Table FE-210 of the Highway Statistics series. The most recent general fund transfer ($18.8 billion in the 2012 MAP-21 law) was reported by the Congressional Budget Office.
Endnotes
[1] This includes taxes collected on both gasoline and diesel fuel sales. See the Federal Highway Administration’s Highway Statistics series, Table FE-10.
[2] ITEP calculation based on data from the Federal Highway Administration and the Congressional Budget Office.
[3] Cawley, Kim P. “Testimony: Status of the Highway Trust Fund.” Congressional Budget Office testimony before the U.S. House of Representatives Committee on Transportation and Infrastructure, Subcommittee on Highways and Transit.” July 23, 2013. Available at: http://www.cbo.gov/publication/44434
[4] Highway Statistics, Table VM-1. 1997 data are available at: http://www.fhwa.dot.gov/policyinformation/statistics/1998/vm1.cfm and 2011 data are available at: http://www.fhwa.dot.gov/policyinformation/statistics/2011/pdf/vm1.pdf
[5] Unrounded FHWA data reveals that fuel-efficiency for passenger vehicles improved by 1.64 miles per gallon between 1997 and 2011. Multiplying that gain across 233,841,442 light-duty vehicles consuming an average of almost 530 gallons of fuel each yields nearly 203 billion miles of tax-free driving in 2011.
[6] ITEP calculations for 1997-2011 based on the Composite Bid Price Index and the National Highway Construction Cost Index (NHCCI).
[7] These figures do not include the diesel tax, but rather focus solely on the gasoline tax. The fuel-efficiency of diesel-powered vehicles has remained basically unchanged since 1997 according to FHWA data, so the decline of the diesel tax is rooted entirely in construction cost growth. In other words, the impact of fuel-efficiency on total motor fuel tax revenues (including both gasoline and diesel) is even smaller than 22 percent.
[8] As measured by the Bureau of Labor Statistics Consumer Price Index for All Urban Consumers.
[9] ITEP calculations for 1997-2011 based on the Composite Bid Price Index and the National Highway Construction Cost Index (NHCCI).
[10] Congressional Budget Office. “How Would Proposed Fuel Economy Standards Affect the Highway Trust Fund?” May 2012. Available at: http://www.cbo.gov/publication/43198
[11] ITEP calculation for model year 1999 versus 2012 cars and trucks. See Environmental Protection Agency. “Light-Duty Automotive Technology, Carbon Dioxide Emissions, and Fuel Economy Trends: 1975 Through 2012.” EPA-420-R-13-001. March 2013. Available at: http://www.epa.gov/otaq/fetrends.htm#report
[12] Cawley, Kim P. “Testimony: Status of the Highway Trust Fund.” Congressional Budget Office testimony before the U.S. House of Representatives Committee on Transportation and Infrastructure, Subcommittee on Highways and Transit.” July 23, 2013. Available at: http://www.cbo.gov/publication/44434
[13] Ibid.
[14] While construction cost inflation is the most relevant measure for purposes of adjusting the gas tax, the general inflation rate as measured by the Consumer Price Index (CPI) often tracks the rate of growth in construction costs fairly well, especially over the longer term. Over the course of the last twenty years, for example, construction costs increased by 63 percent while the CPI increased by a comparable 59 percent.
[15] The seventeen states with gas tax rates tied to inflation, the price of gasoline, or both include: California, Connecticut, Florida, Georgia, Hawaii, Illinois, Indiana, Kentucky, Maryland, Massachusetts, Michigan, Nebraska, New York, North Carolina, Vermont, Virginia, and West Virginia.
[16] See Appendix A for an explanation of both of these volatility-reducing measures.
[17] 2012 and 2013 data are not included in Figure 3 because the FHWA has yet to report the official revenue and spending amounts for those years. Projections of the revenues that could have been raised by reform in 2012 and 2013 are based in part on gasoline and diesel consumption estimates from the Energy Information Administration (EIA).
[18] This is lower than the 15.1 cent peak increase that would have been reached in 2009 as a result of rapid growth in construction costs associated with the late 2000’s construction bubble.
[19] This assumes the full amount of the tax is passed on to the driver in the form of higher gas prices. Furthermore, although a 10.6 cent hike would cause drivers to pay $4.66 more per month than they would otherwise, it’s worth noting that their total monthly gas tax bill ($12.78) would be only $3.63 higher than it was in 1993, since fuel consumption per vehicle has declined in recent years.
[20] Schrank, David et al. “Urban Mobility Report.” Texas A&M Transportation Institute. December 2012. Available at: http://mobility.tamu.edu/ums/
[21] American Society of Civil Engineers. “2013 Report Card for America’s Infrastructure.” March 2013. Available at: http://www.infrastructurereportcard.org/
[22] This is particularly salient in the longer-run, since investing more in routine maintenance can avoid the need for costlier total rebuilds of infrastructure at a later date, and since raising additional gas tax revenue can mitigate the need for deficit-financed spending from the general fund that must be paid back later with interest.
[23] ITEP calculation based on data from the U.S. Census Bureau. See note 15 for the relevant list of states.
[24] Institute on Taxation and Economic Policy. “Don’t Blame the Gas Tax for High Gas Prices.” May 20, 2013. Available at: https://itep.org/itep_reports/2013/05/dont-blame-the-gas-tax-for-high-gas-prices.php