States Should Enact, Expand Mansion Taxes to Advance Fairness and Shared Prosperity
report

The report was produced in partnership with the Center on Budget and Policy Priorities and co-authored by CBPP’s Deputy Director of State Policy Research Samantha Waxman.[1]
A historically large share of the nation’s wealth is concentrated in the hands of a few, a reality glaring in the housing sector. High-value homes in many parts of the country have grown even more valuable over the past several years while people with low incomes, especially renters, face ever-growing challenges affording housing. Further, since systemic inequities have meant that wealthy people are overwhelmingly white, extreme wealth concentration reinforces the barriers that make it harder for people of color to make gains. One way states can build more broadly shared prosperity is by adopting a progressive tax on the sale of high-value homes — one type of so-called “mansion tax” — and using the revenue to support affordable housing and other investments.
Mansion tax revenue can help fund not just affordable housing but also schools, health care, roads, and other services and infrastructure critical to residents’ long-term future. And the taxes would make upside-down state and local tax systems — where the wealthy pay less as a share of income[2] — fairer. States, for example, could target the top 5 or 10 percent of highest-value homes, whose owners are likely to be among those paying the lowest overall state and local tax rates as a share of income.
States with existing mansion taxes should increase their rates on the highest-value homes. States without the taxes should enact them, with progressive rates. This report provides estimates of how much revenue states could raise with these reforms. The approach states take — they should create market-reflective brackets, tax primary as well as secondary homes, index the taxes to inflation, and avoid loopholes — will determine the amount that they can raise. But in short it could be billions that states can put toward urgent needs.
Affordable Housing Out of Reach for Many; Mansion Taxes Can Help Fund Solutions
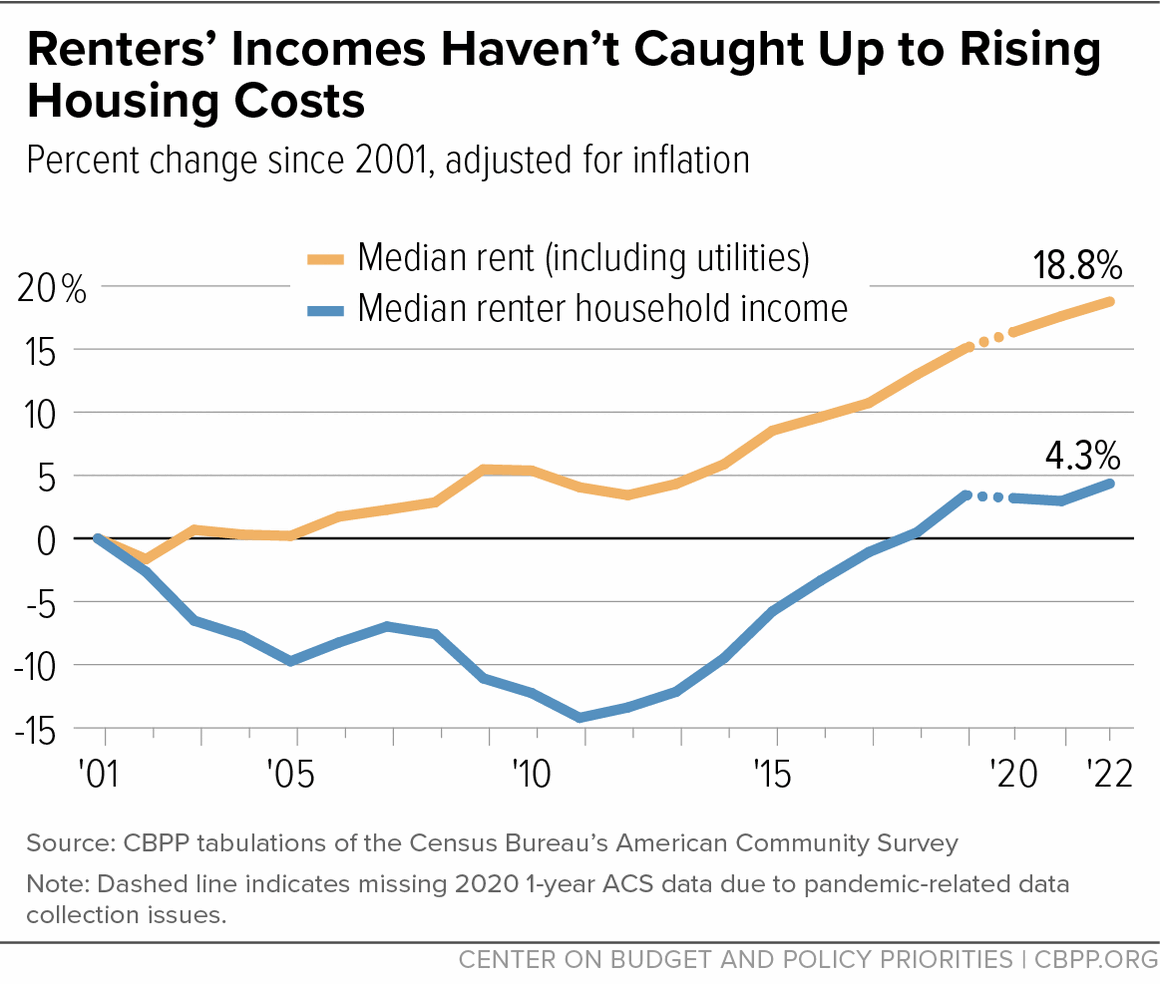
Housing is increasingly becoming unaffordable for low-income renters. Median rents have risen more than 18 percent over the last 20 years while median renter household incomes have increased just over 4 percent, making it harder for renters to afford housing and other basic needs like food, clothing, and transportation.[3] (See Figure 1.) During the height of the COVID pandemic in 2021, 8.53 million households with very low incomes and without housing assistance paid more than one-half of their income toward rent, lived in severely inadequate housing conditions, or both, according to the Department of Housing and Urban Development.[4]
Furthermore, because of long-standing inequities in education, employment, and housing, Black, Latino, and American Indian and Alaska Native households have lower median incomes compared to white households. Racial income inequality makes the housing affordability crisis worse for renters of color.[5]
Meanwhile, federal rental assistance only supports 1 in 4 eligible households due to limited funds.[6] States and localities should therefore look to other sources of revenue to initiate and expand their own housing affordability efforts. Mansion taxes, in the form of progressive real estate transfer taxes, are a solution that some states and localities have already enacted, others are now exploring, and still others should pursue as a way to fund critical housing assistance.
Mansion Taxes Are One Way to Improve State Taxation of Wealth
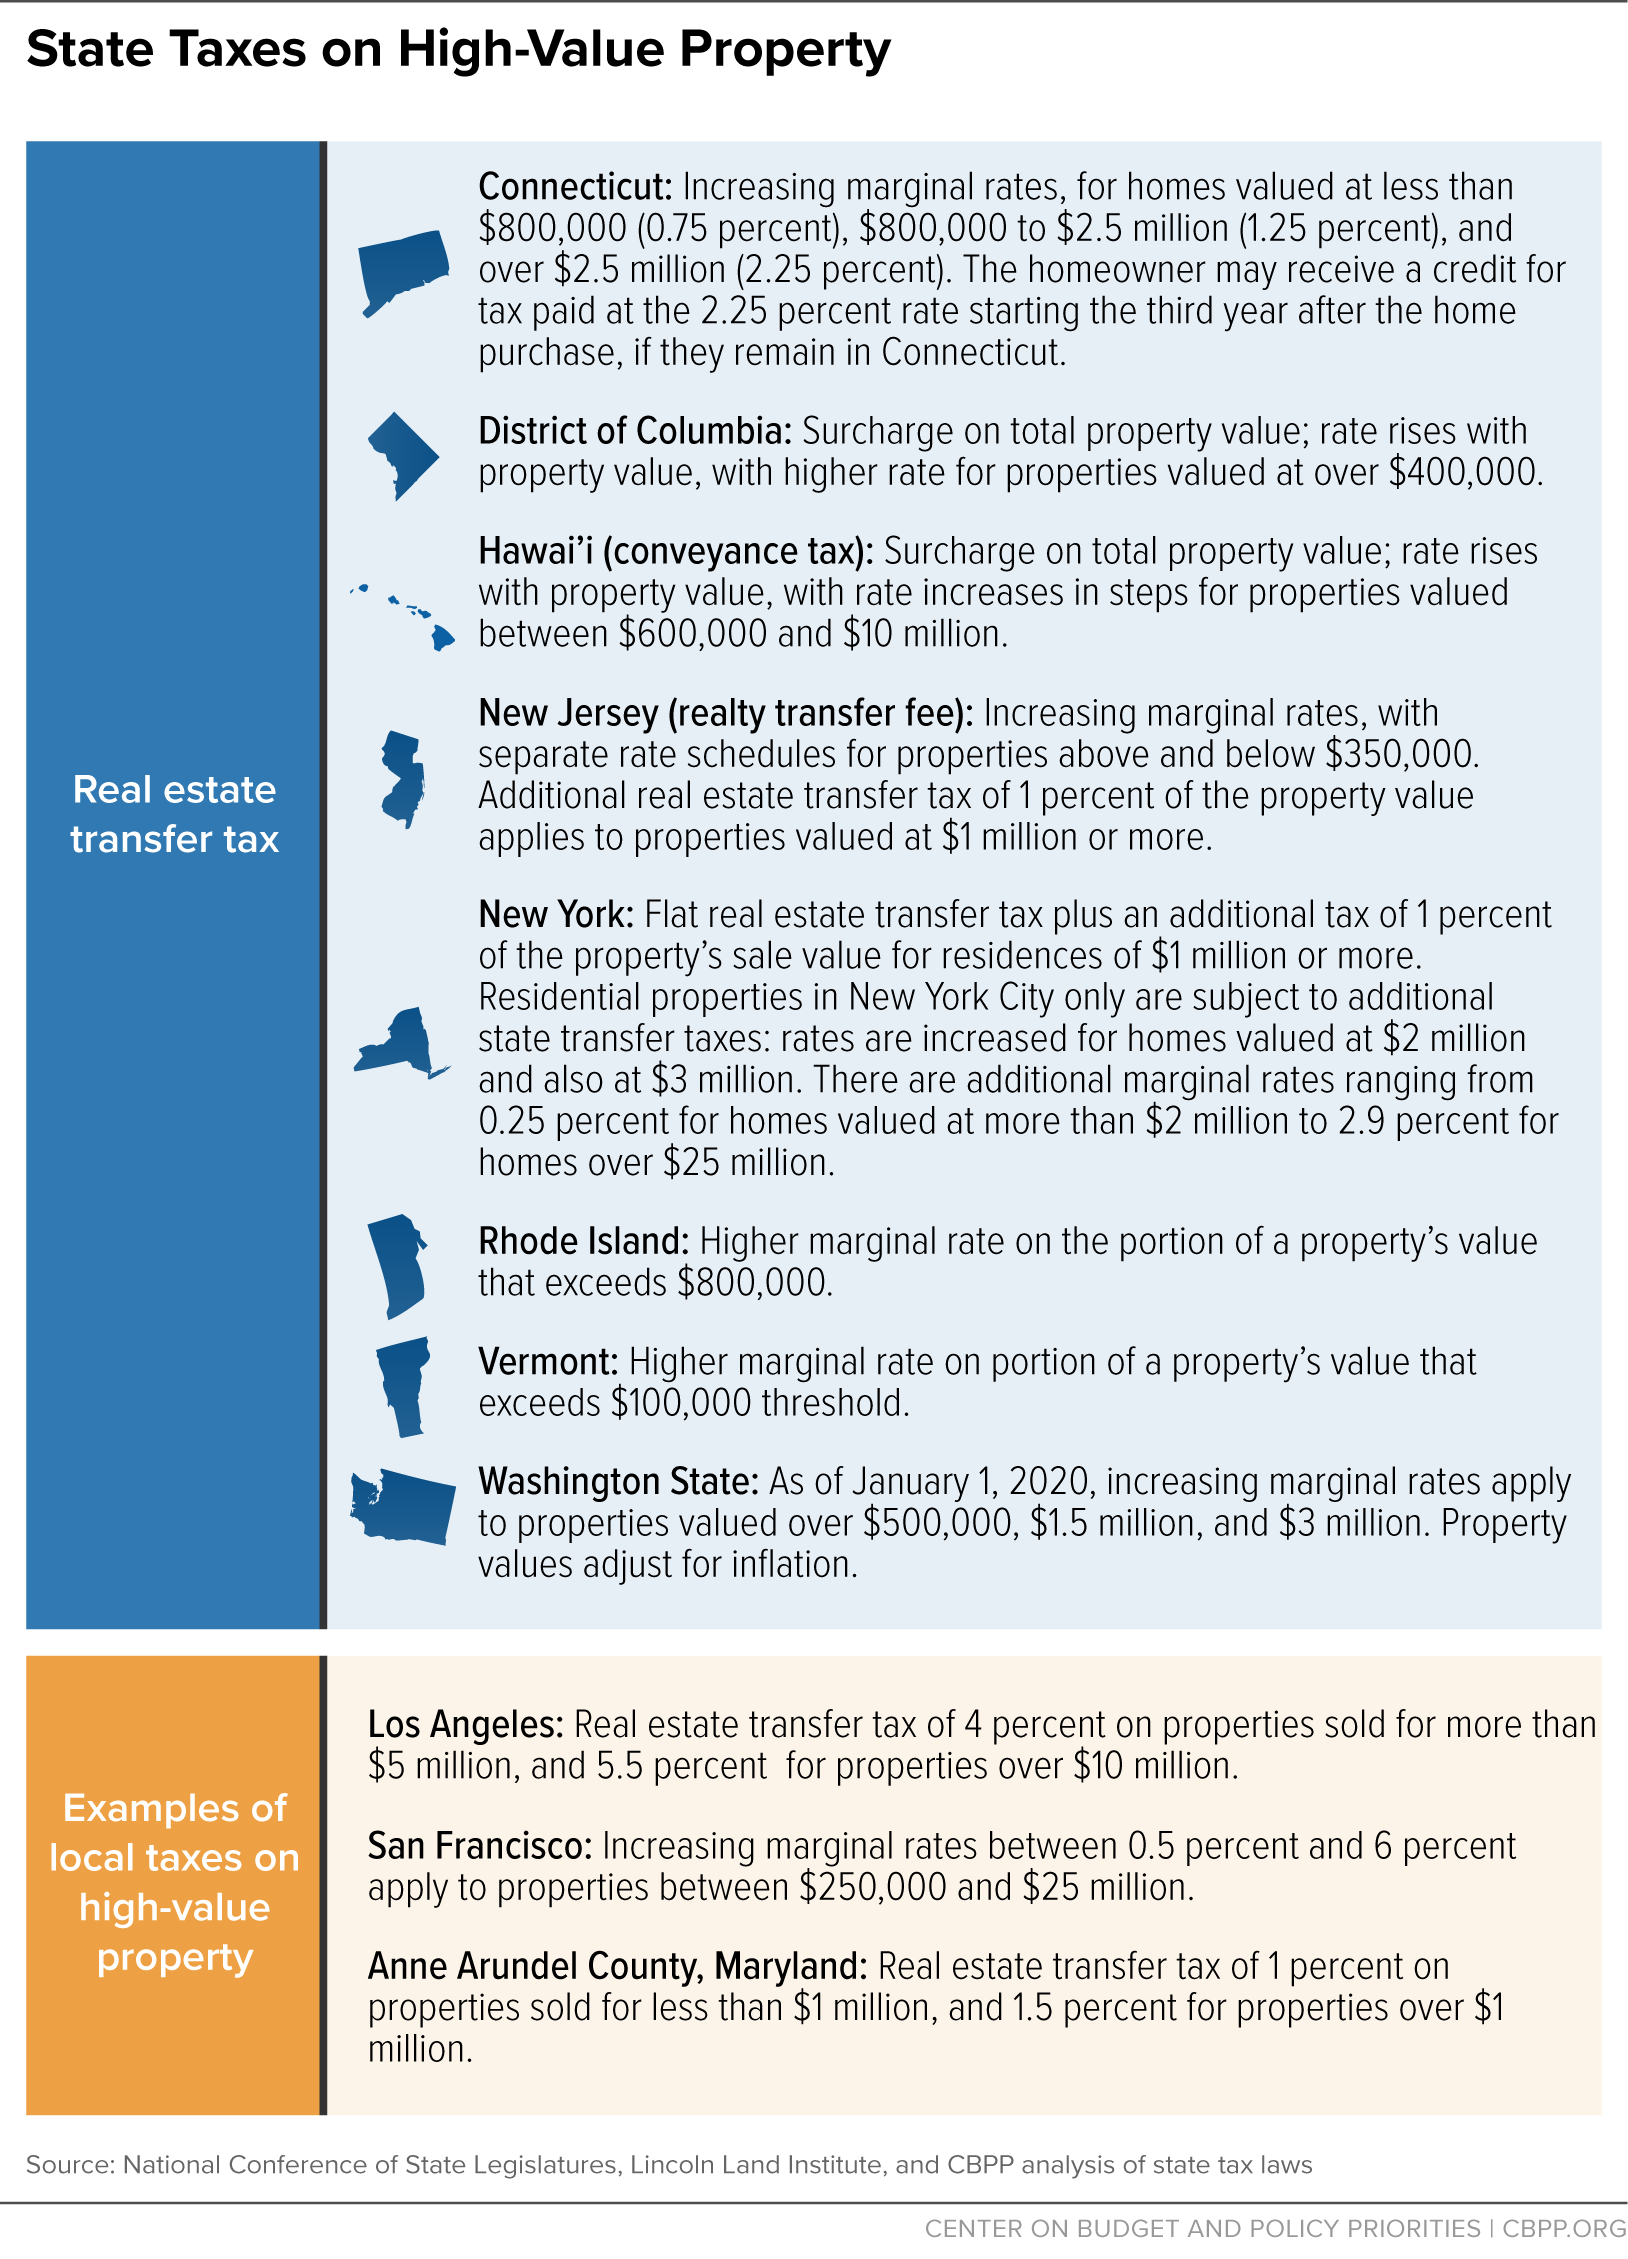
Mansion taxes can improve tax fairness by ensuring that people with the most housing wealth are paying their share for social needs like affordable housing, schools, and health care. Thirty-three states and the District of Columbia already have real estate transfer taxes. Of those states, seven (Connecticut, Hawai’i, New Jersey, New York, Rhode Island, Vermont, and Washington) plus the District of Columbia levy a surcharge on the highest-value homes or have a progressive bracket structure through their real estate transfer tax system. (See Figure 2.) Similar surcharges exist in some localities in California, Connecticut, Illinois, Maryland, New Mexico, and New York.[7]
![]()
When designing or reforming such taxes, states should:
- Create brackets that reflect the state’s or locality’s real estate market. Real estate markets vary widely within and across states. States or localities considering real estate transfer taxes should focus tax brackets on the highest-value homes in those areas, such as the top 5-10 percent of home values.
- Include primary residences along with secondary and vacation homes. States could also pursue an extra tax or surcharge on second homes if desired.
- Index for inflation or home price growth. Indexing is a sensible feature, as it would ensure the tax remains focused on the highest-value homes over time. States could either tie the exemption level to a broad price measure like the Consumer Price Index or look at sales from the prior year and allow the exemption level to adjust, such that roughly the same, say, top 5 or 10 percent of homes are subject to tax each year.
- Avoid creating loopholes that allow wealthy people to avoid the tax. One such loophole allows real estate owners to transfer property ownership into another legal entity — such as a subsidiary corporation — and then sell shares of that entity, rather than the real estate itself. That strategy avoids the transfer tax, since most real estate transfer taxes only cover direct sales from a seller to a buyer, and not transfers of stock which transfer real estate indirectly. While often applied to commercial real estate, owners of high-value homes can also use this strategy. To best close this loophole, states should follow New York’s approach of taxing buyers with a majority share (“controlling interest”) in any entity that owns real estate.[8]
Estimating Revenues From Progressive Real Estate Transfer Taxes
Mansion taxes can raise significant revenue to invest in housing affordability and other public services. Using residential transaction data from Zillow and other sources, Figure 4 shows the revenue that could be raised if every state enacted transfer taxes on high-value home sales (Zillow, 2023). (State-specific revenue figures for 32 states with available data are provided in Appendix I, Table 3.)
![]()
Each of the taxes examined here has a three-tier structure with rates of 2, 3, and 4 percent. The price levels above which those rates apply vary based on home prices in each state. Rates are assumed to apply on a marginal basis in these scenarios, meaning that only the portion of sales price above each price threshold is subject to the advertised tax rate.
An example can help illustrate how these taxes work. In Virginia, for instance, we estimate that the top 10, 5, and 1 percent of home sales are those with prices over $900,000, $1.1 million, and $1.9 million, respectively. Under the tax structure examined here, the first $900,000 of every home’s sales price would be tax exempt. For homes selling at higher prices, the portion of price between $900,000 and $1.1 million would be taxed at 2 percent, the portion between $1.1 million and $1.9 million at 3 percent, and the portion above $1.9 million at 4 percent.
This structure would generate $129 million annually in Virginia and $8.7 billion if implemented nationwide. (See Appendix I, Table 3.) For context, Virginia’s state-level Affordable Housing Trust Fund was funded at $18 million over fiscal years 2018-2019 and 2019-2020.[9] If Virginia earmarked the $128 million in potential mansion tax revenue for affordable housing development, as many other states do, it could increase its Affordable Housing Trust Fund amount tenfold in just a single year. At the national level, $8.7 billion could fund rental assistance subsidies for an estimated 780,000 households per year, or it could more than double the federal public housing budget.
The marginal-rate approach is consistent with how personal income taxes typically work and may have fewer effects on the housing market than non-marginal brackets, which may come with “cliff” effects. Under a non-marginal bracket, for instance, a home selling for $899,999 would incur no tax but a home selling for $900,000 would incur $18,000. Such a structure may sometimes discourage the sale of homes with values just above the cliff level, though the evidence on this question is mixed.[10]
A number of states and localities have chosen to apply their rates on a non-marginal basis because doing so raises far more revenue, even with the supposed chill effects. The results contained in Appendix I indicate that non-marginal rates can raise more than twice as much revenue as marginal ones. Viewed another way, levying the rates on a non-marginal basis can allow states to raise the same amount of revenue as a marginal rate structure while setting the exemption level significantly higher. In Colorado, for example, we estimate that a marginal rate applied to prices over $2 million would raise roughly the same amount of revenue as a non-marginal rate applied to the full sales price of homes selling for more than $4 million.
Another caveat is that the data in this report only include the revenue that could be raised by taxing single-family homes and condos (Zillow, 2023). They exclude business property, apartment complexes, and other properties. Our analysis of Zillow data indicates that these other properties comprise roughly one-third of all transactions by value. They are likely an even larger share of higher-price transactions. A recent analysis of a transfer tax on properties selling for more than $5 million in Los Angeles, for example, found that most (62 percent) of the revenue came from properties that were not single-family residences.[11]
A reasonable assumption from the data, then, is that something close to half of the tax base subject to a high-value transfer tax will be properties other than single-family residences. Taxing all properties in the ways described in this report would therefore likely generate roughly double the revenue shown in these estimates of taxes on just single-family residences.
Appendix I: Data Appendices
Appendix I tables provide information about the revenue potential of a progressive real estate transfer tax in the 32 states for which data are available. Table 1 looks at these taxes levied only on the portion of each sale above certain price points, such as $1 million, and table 2 at taxes levied on the full sales prices of homes that sell above those thresholds. Tables 3 and 4 look at taxes levied on each state’s share of homes above certain top values; table 3 looks at taxes on the amount exceeding that threshold, and table 4 at taxes on the full sales price. Tables 3 and 4 provide 50-state estimates, too.
In the data tables appended to this report as a related resource, tables A through F look at these taxes above certain home price thresholds, such as above $1 million. Tables G through K look at the revenue potential of these taxes based on the home prices in each state, such as certain tax rates on the top 10 percent of home values.
Table 1.
Revenue Potential of 4% Tax on Portion of Residential Property Sales Price Above Various Price Points ($Millions)
| State | $1M+ | $1.5M+ | $2M+ | $2.5M+ | $3M+ | $3.5M+ | $4M+ | $4.5M+ | $5M+ | $10M+ |
| Alabama | $95 | $51 | $35 | $25 | $19 | $16 | $15 | $12 | $11 | $5 |
| Arkansas | $15 | $8 | $5 | $4 | $3 | $2 | $2 | $1 | $1 | — |
| California* | $3,023 | $1,925 | $1,340 | $1,004 | $792 | $644 | $538 | $459 | $399 | $157 |
| Colorado | $315 | $188 | $134 | $104 | $85 | $71 | $61 | $53 | $47 | $20 |
| Connecticut | $92 | $61 | $44 | $33 | $25 | $20 | $17 | $14 | $12 | $4 |
| Delaware | $14 | $9 | $6 | $4 | $3 | $3 | $2 | $2 | $2 | — |
| Florida | $1,457 | $1,015 | $784 | $636 | $534 | $458 | $399 | $352 | $315 | $150 |
| Georgia | $81 | $46 | $31 | $22 | $17 | $13 | $11 | $9 | $9 | $1 |
| Illinois | $214 | $121 | $80 | $58 | $45 | $37 | $31 | $26 | $22 | $9 |
| Iowa | $8 | $4 | $2 | $2 | $1 | $1 | — | — | — | — |
| Kentucky | $15 | $8 | $5 | $4 | $3 | $3 | $2 | $2 | $2 | — |
| Maryland | $127 | $57 | $31 | $18 | $12 | $9 | $6 | $5 | $3 | — |
| Massachusetts | $628 | $383 | $268 | $199 | $156 | $126 | $105 | $89 | $78 | $26 |
| Michigan | $54 | $26 | $15 | $11 | $8 | $7 | $5 | $4 | $4 | $2 |
| Minnesota | $71 | $42 | $31 | $26 | $23 | $21 | $19 | $18 | $17 | $12 |
| Nebraska | $2 | — | — | — | — | — | — | — | — | — |
| Nevada | $176 | $118 | $94 | $80 | $70 | $64 | $59 | $55 | $52 | $38 |
| New Hampshire | $23 | $13 | $9 | $7 | $5 | $4 | $4 | $3 | $3 | $1 |
| New Jersey | $233 | $122 | $76 | $53 | $39 | $30 | $24 | $20 | $16 | $4 |
| New York | $1,211 | $932 | $776 | $669 | $591 | $530 | $482 | $441 | $407 | $230 |
| North Carolina | $125 | $65 | $42 | $30 | $23 | $18 | $15 | $12 | $10 | $3 |
| Ohio | $45 | $27 | $19 | $16 | $14 | $12 | $11 | $10 | $9 | $5 |
| Oklahoma | $19 | $11 | $7 | $6 | $5 | $4 | $3 | $3 | $3 | $2 |
| Pennsylvania | $137 | $67 | $41 | $29 | $22 | $17 | $14 | $11 | $10 | $4 |
| Rhode Island | $16 | $10 | $7 | $6 | $5 | $4 | $4 | $3 | $3 | $1 |
| South Carolina | $198 | $124 | $91 | $72 | $60 | $51 | $45 | $40 | $36 | $19 |
| Tennessee | $182 | $98 | $63 | $45 | $34 | $26 | $21 | $18 | $15 | $6 |
| Vermont | $12 | $6 | $4 | $2 | $2 | $1 | $1 | — | — | — |
| Virginia | $140 | $63 | $36 | $25 | $20 | $16 | $14 | $13 | $12 | $6 |
| Washington | $440 | $236 | $153 | $113 | $89 | $73 | $63 | $55 | $50 | $29 |
| West Virginia | $1 | — | — | — | — | — | — | — | — | — |
| Wisconsin | $30 | $17 | $12 | $9 | $7 | $5 | $5 | $4 | $3 | — |
| 32-State Total | $9,199 | $5,853 | $4,243 | $3,311 | $2,711 | $2,288 | $1,976 | $1,737 | $1,550 | $738 |
California is the only state listed without a statewide real estate transfer tax. Values are estimates for calendar year 2024. Individual figures may not sum to totals due to rounding. Commercial and multi-family properties are excluded from these figures. These calculations assume the final incidence of the tax is shared evenly between buyers and sellers and that the sales price will therefore be reduced by half the amount of tax paid. These figures were calculated with an exemption for the portion of sales price below these points (e.g., for a $1.2 million home sale, only $200,000 is taxed in the $1M+ tax base scenario). Available data only allow for reliable estimates in 32 states. This table only includes real estate transfer taxes levied at the state level, not those wholly levied by localities (for example, California). Some states split revenue between states and localities. Colorado has a documentary stamp tax that functions similarly to a real estate transfer tax. The Taxpayer Bill of Rights (TABOR) prohibits real estate transfer taxes as of 1992.
Source: Institute on Taxation and Economic Policy (ITEP) and Center on Budget and Policy Priorities (CBPP) analysis of data from Zillow, the National Association of Realtors, the U.S. Census Bureau, and various state and local agencies
Table 2.
Revenue Potential of 4% Tax on Full Sales Price of Residential Property Selling Above Various Price Points ($Millions)
| State | $1M+ | $1.5M+ | $2M+ | $2.5M+ | $3M+ | $3.5M+ | $4M+ | $4.5M+ | $5M+ | $10M+ |
| Alabama | $261 | $121 | $84 | $62 | $50 | $39 | $33 | $29 | $27 | $15 |
| Arkansas | $40 | $19 | $13 | $9 | $7 | $6 | $5 | $4 | $4 | $1 |
| California* | $6,212 | $4,253 | $3,069 | $2,312 | $1,852 | $1,529 | $1,274 | $1,078 | $939 | $382 |
| Colorado | $758 | $408 | $288 | $223 | $182 | $154 | $132 | $115 | $98 | $52 |
| Connecticut | $179 | $128 | $98 | $77 | $64 | $50 | $40 | $34 | $29 | $10 |
| Delaware | $31 | $19 | $15 | $10 | $8 | $6 | $5 | $4 | $4 | $2 |
| Florida | $2,810 | $1,898 | $1,514 | $1,247 | $1,056 | $927 | $821 | $727 | $659 | $307 |
| Georgia | $209 | $112 | $80 | $60 | $49 | $40 | $35 | $30 | $25 | $13 |
| Illinois | $529 | $297 | $201 | $144 | $113 | $91 | $78 | $69 | $58 | $22 |
| Iowa | $26 | $10 | $6 | $4 | $3 | $3 | $2 | $2 | $1 | — |
| Kentucky | $38 | $19 | $13 | $9 | $7 | $6 | $5 | $5 | $4 | $2 |
| Maryland | $384 | $170 | $105 | $62 | $40 | $30 | $22 | $17 | $12 | $2 |
| Massachusetts | $1,411 | $841 | $621 | $468 | $370 | $301 | $251 | $214 | $184 | $73 |
| Michigan | $166 | $73 | $43 | $28 | $21 | $16 | $15 | $12 | $10 | $4 |
| Minnesota | $180 | $92 | $62 | $46 | $38 | $34 | $31 | $28 | $25 | $18 |
| Nebraska | $7 | $2 | $1 | — | — | — | — | — | — | — |
| Nevada | $374 | $218 | $163 | $133 | $116 | $104 | $94 | $87 | $81 | $53 |
| New Hampshire | $63 | $29 | $20 | $15 | $12 | $10 | $8 | $7 | $6 | $3 |
| New Jersey | $616 | $309 | $203 | $139 | $106 | $85 | $67 | $56 | $45 | $13 |
| New York | $2,007 | $1,517 | $1,292 | $1,123 | $995 | $914 | $836 | $771 | $722 | $434 |
| North Carolina | $333 | $165 | $110 | $77 | $58 | $46 | $38 | $32 | $27 | $11 |
| Ohio | $122 | $60 | $42 | $32 | $27 | $24 | $20 | $18 | $17 | $12 |
| Oklahoma | $50 | $24 | $17 | $12 | $9 | $8 | $7 | $5 | $5 | $3 |
| Pennsylvania | $399 | $180 | $113 | $78 | $57 | $45 | $37 | $31 | $26 | $10 |
| Rhode Island | $36 | $21 | $15 | $12 | $10 | $9 | $8 | $7 | $6 | $3 |
| South Carolina | $439 | $260 | $190 | $145 | $123 | $105 | $89 | $79 | $71 | $37 |
| Tennessee | $478 | $252 | $168 | $123 | $94 | $74 | $58 | $50 | $46 | $17 |
| Vermont | $37 | $17 | $10 | $7 | $5 | $3 | $3 | $2 | $2 | — |
| Virginia | $442 | $188 | $102 | $62 | $45 | $35 | $28 | $24 | $22 | $12 |
| Washington | $1,130 | $601 | $383 | $270 | $209 | $165 | $139 | $120 | $103 | $50 |
| West Virginia | $5 | $1 | — | — | — | — | — | — | — | — |
| Wisconsin | $77 | $40 | $28 | $21 | $17 | $16 | $12 | $10 | $9 | $3 |
| 32-State Total | $19,848 | $12,344 | $9,070 | $7,012 | $5,744 | $4,878 | $4,193 | $3,667 | $3,268 | $1,565 |
California is the only state listed without a statewide real estate transfer tax. Values are estimates for calendar year 2024. Individual figures may not sum to totals due to rounding. Commercial and multi-family properties are excluded from these figures. These calculations assume the final incidence of the tax is shared evenly between buyers and sellers and that the sales price will therefore be reduced by half the amount of tax paid. Available data only allow for reliable estimates in 32 states. This table only includes real estate transfer taxes levied at the state level, not those wholly levied by localities (for example, California). Some states split revenue between states and localities. Colorado has a documentary stamp tax that functions similarly to a real estate transfer tax. The Taxpayer Bill of Rights (TABOR) prohibits real estate transfer taxes as of 1992.
Source: Institute on Taxation and Economic Policy (ITEP) and Center on Budget and Policy Priorities (CBPP) analysis of data from Zillow, the National Association of Realtors, the U.S. Census Bureau, and various state and local agencies
Table 3.
Revenue Potential of Various Residential Transfer Tax Structures, if Taxing Only the Portion of Sales Price Above Various Price Boundaries ($Millions)
Option 1: 2% tax on the top 10 to top 5 percentile of sale price; 3% tax on the top 5 to top 1 percentile of home sale price; and 4% tax on the top 1 or higher percentile of home sale price
Option 2: 2% tax on the top 5 to top 3 percentile of sale price; 3% tax on the top 3 to top 1 percentile of home sale price; and 4% tax on the top 1 or higher percentile of home sale price
Option 3: 2% tax on the top 3 to top 2 percentile of sale price; 3% tax on the top 2 to top 1 percentile of home sale price; and 4% tax on the top 1 or higher percentile of home sale price
Option 4: 2% tax on the top 3 to top 1 percentile of sale price; 3% tax on the top 1 to top 0.1 percentile of home sale price; and 4% tax on the top 0.1 or higher percentile of home sale price
Option 5: 2% tax on the top 2 to top 1 percentile of sale price; 3% tax on the top 1 to top 0.1 percentile of home sale price; and 4% tax on the top 0.1 or higher percentile of home sale price
| State | Option 1 | Option 2 | Option 3 | Option 4 | Option 5 |
| Alabama | $183 | $128 | $100 | $81 | $68 |
| Arkansas | $39 | $27 | $21 | $17 | $14 |
| California* | $1,216 | $870 | $681 | $546 | $461 |
| Colorado | $233 | $178 | $144 | $116 | $101 |
| Connecticut | $88 | $64 | $49 | $39 | $32 |
| Delaware | $22 | $16 | $14 | $11 | $9 |
| Florida | $1,481 | $1,160 | $965 | $778 | $678 |
| Georgia | $138 | $98 | $79 | $63 | $54 |
| Illinois | $278 | $197 | $156 | $124 | $106 |
| Iowa | $24 | $16 | $12 | $10 | $8 |
| Kentucky | $37 | $26 | $20 | $16 | $14 |
| Maryland | $124 | $83 | $64 | $50 | $41 |
| Massachusetts | $307 | $216 | $169 | $134 | $112 |
| Michigan | $157 | $103 | $77 | $62 | $51 |
| Minnesota | $102 | $76 | $62 | $52 | $46 |
| Nebraska | $11 | $7 | $5 | $4 | $4 |
| Nevada | $169 | $135 | $117 | $99 | $90 |
| New Hampshire | $28 | $20 | $16 | $13 | $12 |
| New Jersey | $184 | $131 | $103 | $83 | $65 |
| New York | $725 | $567 | $472 | $378 | $331 |
| North Carolina | $152 | $107 | $84 | $67 | $57 |
| Ohio | $139 | $94 | $74 | $61 | $51 |
| Oklahoma | $47 | $33 | $26 | $21 | $18 |
| Pennsylvania | $205 | $138 | $106 | $85 | $72 |
| Rhode Island | $19 | $14 | $12 | $10 | $9 |
| South Carolina | $226 | $170 | $139 | $113 | $99 |
| Tennessee | $226 | $161 | $126 | $100 | $85 |
| Vermont | $15 | $10 | $8 | $6 | $5 |
| Virginia | $129 | $90 | $70 | $58 | $47 |
| Washington | $264 | $189 | $149 | $123 | $107 |
| West Virginia | $9 | $6 | $4 | $3 | $3 |
| Wisconsin | $64 | $45 | $36 | $29 | $25 |
| 32-State Total | $7,042 | $5,174 | $4,160 | $3,355 | $2,873 |
| 50-State Estimate | $8,737 | $6,420 | $5,162 | $4,163 | $3,565 |
California is the only state listed without a statewide real estate transfer tax. Values are estimates for calendar year 2024. Individual figures may not sum to totals due to rounding. Commercial and multi-family properties are excluded from these figures. These calculations assume the final incidence of the tax is shared evenly between buyers and sellers and that the sales price will therefore be reduced by half the amount of tax paid. Available data only allow for reliable estimates in 32 states. This table only includes real estate transfer taxes levied at the state level, not those wholly levied by localities (for example, California). Some states split revenue between states and localities. Colorado has a documentary stamp tax that functions similarly to a real estate transfer tax. The Taxpayer Bill of Rights (TABOR) prohibits real estate transfer taxes as of 1992.
Source: Institute on Taxation and Economic Policy (ITEP) and Center on Budget and Policy Priorities (CBPP) analysis of data from Zillow, the National Association of Realtors, the U.S. Census Bureau, and various state and local agencies
Table 4.
Revenue Potential of Various Residential Transfer Tax Structures, if Taxing Full Sales Price of State’s Various Top-Value Residential Property ($Millions)
Option 1: 2% tax on the top 10 to top 5 percentile of sale price; 3% tax on the top 5 to top 1 percentile of home sale price; and 4% tax on the top 1 or higher percentile of home sale price
Option 2: 2% tax on the top 5 to top 3 percentile of sale price; 3% tax on the top 3 to top 1 percentile of home sale price; and 4% tax on the top 1 or higher percentile of home sale price
Option 3: 2% tax on the top 3 to top 2 percentile of sale price; 3% tax on the top 2 to top 1 percentile of home sale price; and 4% tax on the top 1 or higher percentile of home sale price
Option 4: 2% tax on the top 3 to top 1 percentile of sale price; 3% tax on the top 1 to top 0.1 percentile of home sale price; and 4% tax on the top 0.1 or higher percentile of home sale price
Option 5: 2% tax on the top 2 to top 1 percentile of sale price; 3% tax on the top 1 to top 0.1 percentile of home sale price; and 4% tax on the top 0.1 or higher percentile of home sale price
| State | Option 1 | Option 2 | Option 3 | Option 4 | Option 5 |
| Alabama | $511 | $351 | $270 | $218 | $182 |
| Arkansas | $113 | $77 | $59 | $47 | $39 |
| California* | $2,758 | $1,998 | $1,588 | $1,279 | $1,089 |
| Colorado | $537 | $388 | $312 | $253 | $217 |
| Connecticut | $174 | $132 | $107 | $86 | $73 |
| Delaware | $52 | $37 | $30 | $24 | $20 |
| Florida | $2,893 | $2,205 | $1,819 | $1,481 | $1,296 |
| Georgia | $367 | $257 | $201 | $163 | $137 |
| Illinois | $679 | $485 | $382 | $309 | $260 |
| Iowa | $85 | $56 | $41 | $33 | $27 |
| Kentucky | $105 | $72 | $56 | $45 | $37 |
| Maryland | $374 | $252 | $191 | $152 | $124 |
| Massachusetts | $688 | $500 | $393 | $316 | $266 |
| Michigan | $499 | $333 | $251 | $201 | $163 |
| Minnesota | $278 | $193 | $150 | $123 | $104 |
| Nebraska | $42 | $27 | $20 | $16 | $13 |
| Nevada | $356 | $266 | $218 | $183 | $159 |
| New Hampshire | $76 | $52 | $41 | $33 | $27 |
| New Jersey | $483 | $336 | $261 | $210 | $173 |
| New York | $1,196 | $959 | $814 | $665 | $591 |
| North Carolina | $405 | $282 | $218 | $176 | $145 |
| Ohio | $419 | $283 | $216 | $175 | $145 |
| Oklahoma | $132 | $90 | $69 | $56 | $46 |
| Pennsylvania | $578 | $396 | $302 | $243 | $201 |
| Rhode Island | $44 | $32 | $25 | $21 | $18 |
| South Carolina | $509 | $369 | $296 | $241 | $207 |
| Tennessee | $592 | $416 | $323 | $261 | $218 |
| Vermont | $44 | $30 | $23 | $18 | $15 |
| Virginia | $403 | $271 | $205 | $165 | $136 |
| Washington | $670 | $473 | $370 | $301 | $255 |
| West Virginia | $34 | $22 | $16 | $13 | $10 |
| Wisconsin | $185 | $127 | $97 | $79 | $66 |
| 32-State Total | $16,281 | $11,768 | $9,362 | $7,584 | $6,460 |
| 50-State Estimate | $20,200 | $14,601 | $11,616 | $9,409 | $8,015 |
California is the only state listed without a statewide real estate transfer tax. Values are estimates for calendar year 2024. Individual figures may not sum to totals due to rounding. Commercial and multi-family properties are excluded from these figures. These calculations assume the final incidence of the tax is shared evenly between buyers and sellers and that the sales price will therefore be reduced by half the amount of tax paid. Available data only allow for reliable estimates in 32 states. This table only includes real estate transfer taxes levied at the state level, not those wholly levied by localities (for example, California). Some states split revenue between states and localities. Colorado has a documentary stamp tax that functions similarly to a real estate transfer tax. The Taxpayer Bill of Rights (TABOR) prohibits real estate transfer taxes as of 1992.
Source: Institute on Taxation and Economic Policy (ITEP) and Center on Budget and Policy Priorities (CBPP) analysis of data from Zillow, the National Association of Realtors, the U.S. Census Bureau, and various state and local agencies
Appendix II: Methodology
The primary data source behind the numbers contained in this report was the Zillow Transactions and Assessment Database (ZTRAX). Data from ZTRAX were supplemented with information from the National Association of Realtors, the U.S. Census Bureau, and various state tax and budget agencies to craft the most reliable estimates possible for calendar year 2024. It is important to note that ZTRAX has been discontinued and thus future analyses of this type will need to rely on other aggregations of local property and transactions data.
ZTRAX was a remarkable dataset for both its size and level of detail. The database contained more than 400 million public records and spanned more than two decades. While its depth and breadth were both undeniable strengths, the enormous number of data entry processes converging in this dataset also produced results that needed to be cleaned and scrutinized carefully before use.
To confirm the validity of the ZTRAX data, we checked its aggregate transaction values, by state and fiscal year, against the transaction values implied by state and local real estate transfer tax (RETT) revenue collections. For instance, if a state reported that it collected $80 million in revenue with a 0.1 percent RETT rate, then we would expect to see roughly $80 billion in transactions in ZTRAX. In most states, this comparison yielded a favorable result, with ZTRAX exhibiting both a level, and trajectory over time, of transactions consistent with state and local revenue data. In some states, however, the transactions data proved difficult to reconcile with official revenue totals, and we opted to exclude those states from this report for that reason. At least some of this difficulty is likely related to variations in data entry and reporting procedures across local governmental units. Deeper analysis in these states may have allowed us to identify the nature of these departures and possibly work around some of the issues, but the termination of the ZTRAX program did not allow sufficient time for this.
Ultimately, the states excluded from this study are a mix of states where real estate transactions are not publicly reported, and of states where transactions are reported but where we were unable to confirm the validity of the ZTRAX data using the approach described above.
To produce the estimates in this report, we needed to select the base year for our calculations. Each transaction and assessment sale record contained multiple date fields, and any, all, or none of these may have had a value present. To assign a master date to each record, we selected the first non-null value from documentdate, signaturedate, or recordingdate, in that order. Records with no date were excluded from the results.
We initially considered using fiscal year 2021 data as the base, but that year proved especially difficult to reconcile with official state and local RETT revenue collections — perhaps because of data reporting issues in the early months of the COVID-19 pandemic. We also decided not to use fiscal year 2020 because the real estate market during the final few months of that year was heavily affected by the onset of the pandemic and the early policy response. Ultimately, it was clear from our review that fiscal year 2019 offered the most robust starting point for our calculations, as it was the most current period that could be verified against state fiscal data.
With the states and year of analysis defined, we then began an intensive process of categorizing and cleaning the data. We constructed a category within the transactions dataset of residential transactions using the land use codes available in ZTRAX. This category includes detached single-family residences as well as townhouses, individual condominium units, and various other residential property types. This category excludes business properties and apartment complexes. While most of the transactions in our dataset were sales of individual properties, there were instances where multiple properties were bundled into one transaction. After evaluating a sample of multi-property transactions, we retained the stated sale price for transactions including three or fewer unique non-null addresses, as these often represented a primary property packaged with properties of considerably less value — for example, a large home with acreage combined with a guest cottage on a small adjacent parcel. For transactions including four or more unique addresses, we divided the stated sale price by the number of unique non-null addresses. Transactions with no properties with non-null addresses were treated as having one property.
Once multi-property transactions were identified, we looked for records with data entry errors. In some cases, the sale price was one to three orders of magnitude too high. In others, additional digits had been inserted into the sale price or the sale price was otherwise miskeyed. To extract these for review, we attempted to find a fallback sale price in the assessment data. We then looked for transactions where the sale price varied substantially from the fallback price. Each of these was reviewed by comparing the property address with external information to determine if the correct sale price appeared to be, for example, $110,000 or $1,100,000. After various forms of data cleaning and adjustments were applied, we evaluated the remaining handful of improbably large transactions and revised or recategorized them as needed.
At this stage, we now had a base fiscal year 2019 dataset for each state of interest. We then developed factors to apply to that dataset that allowed us to age the count and value of transactions to calendar year 2024 levels. These factors, which vary by state, were arrived at with a few considerations in mind.
We first weighted each transaction, while holding prices constant, to bring the aggregate value of transactions in line with the value we expected to see based on our review of state and local RETT revenue data for fiscal year 2019. This afforded us a 2019 transactions dataset that could be used to produce revenue estimates that precisely matched the actual revenue yield of existing state and local RETTs.
We then used data from the National Association of Realtors to determine regional trends in the number and price of existing home sales over the 2019-2024 period. These were combined with similar data from the U.S. Census Bureau on new home sales counts and prices. The result was a set of region-specific factors for moving both sales counts and prices from 2019 into each subsequent fiscal year and to calendar year 2024. In every region, those factors pointed toward higher prices and lower transaction counts in 2024 than in 2019.
Because state housing markets can vary from their broader regional average, we compared our results for each year to the results we expected to see based on the reported level of state and local RETT revenues. Revenue data availability varies by state, as some states report revenues with more lag time than others. Where revenue data were available, we further refined our adjustment factors, for both count and price of transactions, to bring our aggregate transactions amount in line with the total implied by those revenue figures. This step of the process allowed for more accurate, state-specific adjustment factors than the regional data permit. Values for every state rely on the regional factors to some extent, however, as state revenue data do not extend through calendar year 2024 (nor could they).
The 2024 transactions dataset was used to produce all the estimates contained in this report. In determining the revenue yield of a tax applied to those transactions, it is necessary to specify the extent to which the economic incidence of that tax falls on buyers or sellers — a question separate from whether the statutory incidence of the tax is assigned to buyers or sellers.
The ultimate incidence of a RETT depends on each party’s price elasticity, which in turn varies across housing markets. In the absence of reliable state-by-state estimates of these elasticities, our calculations assume that the tax is evenly shared between buyers and sellers. This matters to our revenue estimates because the portion of the tax falling on sellers shows up as a lower sales price that slightly reduces the overall size of the tax base.
The revenue yield of a tax falling exclusively on buyers could be calculated simply as:
C = R * B
Where C represents revenue collections, R represents the tax rate, and B represents the tax base.
Our calculation, with half of the tax falling on sellers, is instead as follows:
C = (R * B) / (1 + (0.5*R))
The centerpiece of this report is state-by-state data illuminating the tax base and revenue potential of RETTs on high-value residential sales. We provide these estimates for 32 states. For a few of our revenue calculations (in Appendix I, tables 3 and 4), we extrapolate from those data with a 50-state approximation that can help the reader understand the national significance of this tax base.
In devising this extrapolation technique, we examined the size of these 32 states compared to the nation as a whole by choosing one of three different measures: their share of nationwide population (75.9 percent), nationwide GDP (76.7 percent), and nationwide adjusted gross income flowing to tax units with annual incomes over $1 million (80.6 percent). We decided to use the third of these three measures for our extrapolation, meaning we assume that 80.6 percent of the relevant tax base is in the 32 states that we observe in our dataset and that the other 19.4 percent is in the remaining 18 states plus the District of Columbia. We made this choice both because we expect that high-end incomes are more closely correlated with high-end home sales than the other two measures, and because this choice yields the most conservative revenue estimate of the three measures (that is, we would have estimated a higher nationwide revenue potential if we had assumed that only 76 or 77 percent of the tax base was located in the 32 states we examined).
We opted not to produce a 50-state estimate of the revenue amounts using fixed price points (tables 1 and 2) because it is clear that an outsized share of the highest-value bands are disproportionately located in certain states such as California, Florida, and New York. The percentile-based bands are better suited to this kind of extrapolation because while some states may not have a meaningful volume of $5 million or $10 million home sales, every state does have a category of sales that can be classified as the top 5 or top 1 percent, for example, occurring within its own borders.
Endnotes
[1] Data provided by Zillow through the Zillow Transaction and Assessment Dataset (ZTRAX). More information on accessing the data can be found at http://www.zillow.com/ztrax. The results and opinions are those of the author(s) and do not reflect the position of Zillow Group.
[2] ITEP, “Who Pays? A Distributional Analysis of the Tax Systems in All 50 States,” 7th Edition, January 2024, https://itep.org/whopays-7th-edition/.
[3] Peggy Bailey, “Addressing the Affordable Housing Crisis Requires Expanding Rental Assistance and Adding Housing Units,” CBPP, October 27, 2022, https://www.cbpp.org/research/housing/addressing-the-affordable-housing-crisis-requires-expanding-rental-assistance-and.
[4] Thyria A. Alvarez and Barry L. Steffen, “Worst Case Housing Needs 2023 Report To Congress,” prepared for U.S. Department of Housing and Urban Development Office of Policy Development and Research, May 2023, https://www.huduser.gov/portal/portal/sites/default/files/pdf/Worst-Case-Housing-Needs-2023.pdf.
[5]Erik Gartland, “Chart Book: Funding Limitations Create Widespread Unmet Need for Rental Assistance,” CBPP, February 15, 2022, https://www.cbpp.org/research/housing/funding-limitations-create-widespread-unmet-need-for-rental-assistance.
[6] Ibid.
[7] Andrew Boardman, “Local Mansion Taxes: Building Stronger Communities with Progressive Taxes on High-Value Real Estate,” ITEP, March 14, 2024, https://itep.org/local-mansion-taxes/. There is uncertainty about the future of the Santa Fe, New Mexico real estate transfer tax due to an ongoing court case. See Evan Chandler, “Judge Strikes Down Santa Fe ‘Mansion Tax,’” Santa Fe Reporter, May 22, 2024, https://www.sfreporter.com/news/2024/05/22/judge-strikes-down-santa-fe-mansion-tax/.
[8] New York State Department of Taxation and Finance, “Publication 576: Transfer or Acquisition of a Controlling Interest in an Entity with an Interest in Real Property,” June 2008, https://www.tax.ny.gov/pdf/publications/real_estate/pub576.pdf.
[9] Virginia Department of Housing and Community Development, “Virginia Housing Trust Fund: Allocation of Resources,” https://www.dhcd.virginia.gov/vhtf. The trust fund was funded at $11 million in fiscal year 2018-2019 and $7 million in fiscal year 2019-2020.
[10] Wojciech Kopczuk and David Munroe, “Mansion Tax: The Effect of Transfer Taxes on the Residential Real Estate Market,” American Economic Journal: Economic Policy, 2015, https://eml.berkeley.edu/~saez/course/kopczuk-munroe15.pdf; Joel Slemrod, Caroline Weber, and Hui Shan, “The Behavioral Response to Housing Transfer Taxes: Evidence from a Notched Change in D.C. Policy,” SSRN, https://papers.ssrn.com/sol3/papers.cfm?abstract_id=2771229.
[11] Peter Dreier et al., “An Analysis Of ‘Measure ULA’: A Ballot Measure To Reform Real Estate Transfer Taxes In The City Of Los Angeles,” September 2022, UCLA Lewis Center for Regional Policy Studies, https://www.lewis.ucla.edu/wp-content/uploads/sites/17/2022/09/ULA-White-Paper.pdf.