Key findings
- America’s largest, consistently profitable corporations saw their effective tax rates fall from an average of 22.0 percent to an average of 12.8 percent after the Trump tax law went into effect in 2018.
- The 296 largest and consistently profitable U.S. corporations in this study paid $240 billion less in taxes from 2018 to 2021 than if they had continued to pay the effective rates they’d paid before the Trump tax law.
- While profits for the largest, continuously profitable U.S. corporations rose by 44 percent after passage of the Trump tax law, their federal tax bills dropped by 16 percent.
- The number of these corporations paying tax rates of less than 10 percent increased from 56 to 95 after the Trump tax law went into effect.
- Many of the largest and most well-known corporations in the country — including Walmart, Verizon, Disney, and Meta — had the largest tax reductions after the Trump tax law went into effect.
Introduction
Following the implementation of the tax changes signed into law in 2017 by President Trump, the vast majority of the nation’s largest corporations saw substantial tax reductions. The 296 companies in the Fortune 500 and S&P 500 that were consistently profitable from 2013 to 2021, and for which U.S. profits and federal income taxes are disclosed, collectively saw the share of their profits that they paid in tax drop from 22.0 to 12.8 percent.
While these corporations’ profits grew by 44 percent, their federal tax bills dropped by 16 percent. These companies paid $240 billion less in taxes from 2018 to 2021 than they would have paid under the effective rates they paid before the Trump law. The number of companies paying exceptionally low tax rates grew, with the number paying less than 10 percent jumping from 56 to 95.
The primary reasons these large corporations have seen tax cuts of this magnitude are clear. Most importantly, the 2017 tax law drastically cut the statutory corporate tax rate from 35 to 21 percent. It also expanded tax breaks for corporate expenses characterized as capital investment and expanded other ways to minimize U.S. tax liability. The law also reduced some tax avoidance mechanisms but taken as a whole it increased these companies’ ability to take advantage of tax breaks.
Many of the nation’s best known and most profitable corporations enjoyed the largest tax reductions:
- Verizon alone would have paid $11 billion more in taxes from 2018 to 2021 if its effective tax rate hadn’t dropped from 21 to 8 percent. While Verizon’s U.S. profits grew by 18 percent after the enactment of the Trump tax law, its federal income taxes dropped by 52 percent.
- Walmart would have paid about $9 billion more if its effective rate hadn’t dropped from 31 to 17 percent. Walmart’s profits dropped slightly after the passage of the 2017 tax law, by 3 percent, while its taxes fell by a much larger amount: 45 percent.
- AT&T would have paid $8 billion more if its effective rate hadn’t dropped from 13 to 3 percent. The company saw a slight increase in profits of 1 percent while its taxes dropped by 81 percent.
- Meta would have paid $8 billion more if its effective rate hadn’t dropped from 28 to 18 percent. Meta’s profits almost quadrupled from the pre-tax-cut 2013-2016 period to the 2018-2021 period (rising by 372 percent) and its taxes did go up—but only doubled (up by 203 percent).
Figure 1.
Before and After the Trump Tax Law for 16 Prominent Corporations
| Company | Effective tax rates | Saved taxes | % change 2013-2016 to 2018-2021* |
||
| 2013-2016 | 2018-2021 | in profits | in taxes | ||
| Verizon Communications | 21% | 8% | $10.7 billion | 18% | –52% |
| Walmart | 31% | 17% | $9.0 billion | –3% | –45% |
| AT&T | 13% | 3% | $8.2 billion | 1% | –81% |
| Meta | 28% | 18% | $8.0 billion | 372% | 203% |
| Intel | 27% | 13% | $7.7 billion | 47% | –31% |
| Comcast | 24% | 14% | $6.6 billion | 42% | –17% |
| Walt Disney | 26% | 8% | $6.1 billion | –27% | –78% |
| Visa | 32% | 18% | $5.2 billion | 74% | –2% |
| Lockheed Martin | 33% | 15% | $5.0 billion | 46% | –33% |
| Capital One Financial | 31% | 16% | $5.1 billion | 42% | –28% |
| Target | 34% | 16% | $3.4 billion | 25% | –42% |
| Honeywell International | 23% | 6% | $2.3 billion | 13% | –71% |
| FedEx | 18% | 1% | $2.1 billion | 7% | –92% |
| Deere | 30% | 13% | $1.7 billion | 2% | –54% |
| Archer Daniels Midland | 26% | 6% | $838 million | –30% | –83% |
| Domino’s Pizza | 29% | 9% | $402 million | 87% | –43% |
* 2017 was a transition year between the prior and post-Trump tax regimes and was thus excluded. See further discussion later in this report.
Source: ITEP analysis of Securities and Exchange Commission filings of publicly traded corporations
As shown in a table later in this report, the size of the tax reductions varies substantially by industry. More than a dozen different sectors’ effective rates declined by 10 percentage points or more after the tax cuts took effect. Three industries – motor vehicles, oil and gas, and utilities – disclosed effective tax rates close to zero both before and after the passage of the 2017 cuts and, as a result, saw no meaningful tax reductions.
This Study and the Trump Tax Law
This study looks at the taxpaying behavior of 296 major American corporations in two different four-year periods, one before and one after the enactment of the Trump tax law in 2017. These are companies in the Fortune 500 and S&P 500 that were profitable in every year from 2013 to 2021, and for which annual reports to shareholders allow for calculations of effective tax rates. These corporations collectively reported $2.75 trillion of pretax profits in the U.S. over the four years between 2018 and 2021— more than a third of the total nationwide $8.2 trillion in pretax corporate profits reported by the Commerce Department in these years.
The two periods examined in this study are 2013-2016, reflecting the four-year period before the 2017 tax law went into effect, and 2018-2021 after the law went into full effect. The transition year of 2017 was excluded as not representative of either tax regime, as later explained in this report.
The 2017 tax law was intended by its authors, President Trump and Congressional Republicans, to significantly cut corporate taxes. As this report shows, it did. The law cut the statutory corporate tax rate from 35 to 21 percent and made changes to many corporate tax breaks, expanding some while constraining others.
Further information on the ITEP approach of analyzing corporate taxes, analysis of the 2017 tax law, details on provisions of that law and how companies avoid taxes under it, can be found at the end of this report as well as in prior ITEP reports.[1]
How the Trump Tax Law Affected Corporate Tax Breaks
Most corporations, both before and after the passage of the 2017 law, have paid less than the statutory tax rate because of special tax breaks and loopholes. In theory, lawmakers could have mitigated the impact of drastically slashing the statutory corporate income tax rate from 35 to 21 percent by also scaling back these tax breaks. On balance, however, Congress and President Trump failed to do this — despite claims to the contrary. In fact, the gap between effective tax rates paid by the corporations in this study and the statutory tax rate rose slightly after the Trump tax law — even as the rate cut substantially reduced their overall taxes.
In the four years from 2013 through 2016, if the 296 corporations in this study paid an effective tax rate equal to the statutory tax rate of 35 percent, they would have paid $666.4 billion during that period. Instead, they paid $248.0 billion, a full 37 percent less. That is another way of saying that the 296 corporations sheltered 37 percent of their income from the corporate income tax during those years.
Rather than reducing tax avoidance as any successful tax reform would be expected to do, the 2017 law increased it. The same calculation for the 2018-2021 period demonstrates that these companies sheltered 39 percent of their income from the corporate income tax.
Figure 2.
The Cost of Tax Avoidance: Tax Subsidies to 296 Companies
| Years | U.S. income | Tax at statutory rate | Actual tax | Tax subsidies | % profits sheltered from tax |
| 2013 to 2016 | $1.90 trillion | $666.4 billion | $418.4 billion | $248.0 billion | 37% |
| 2018 to 2021 | $2.75 trillion | $577.0 billion | $351.5 billion | $225.6 billion | 39% |
Source: ITEP analysis of Securities and Exchange Commission filings of publicly traded corporations
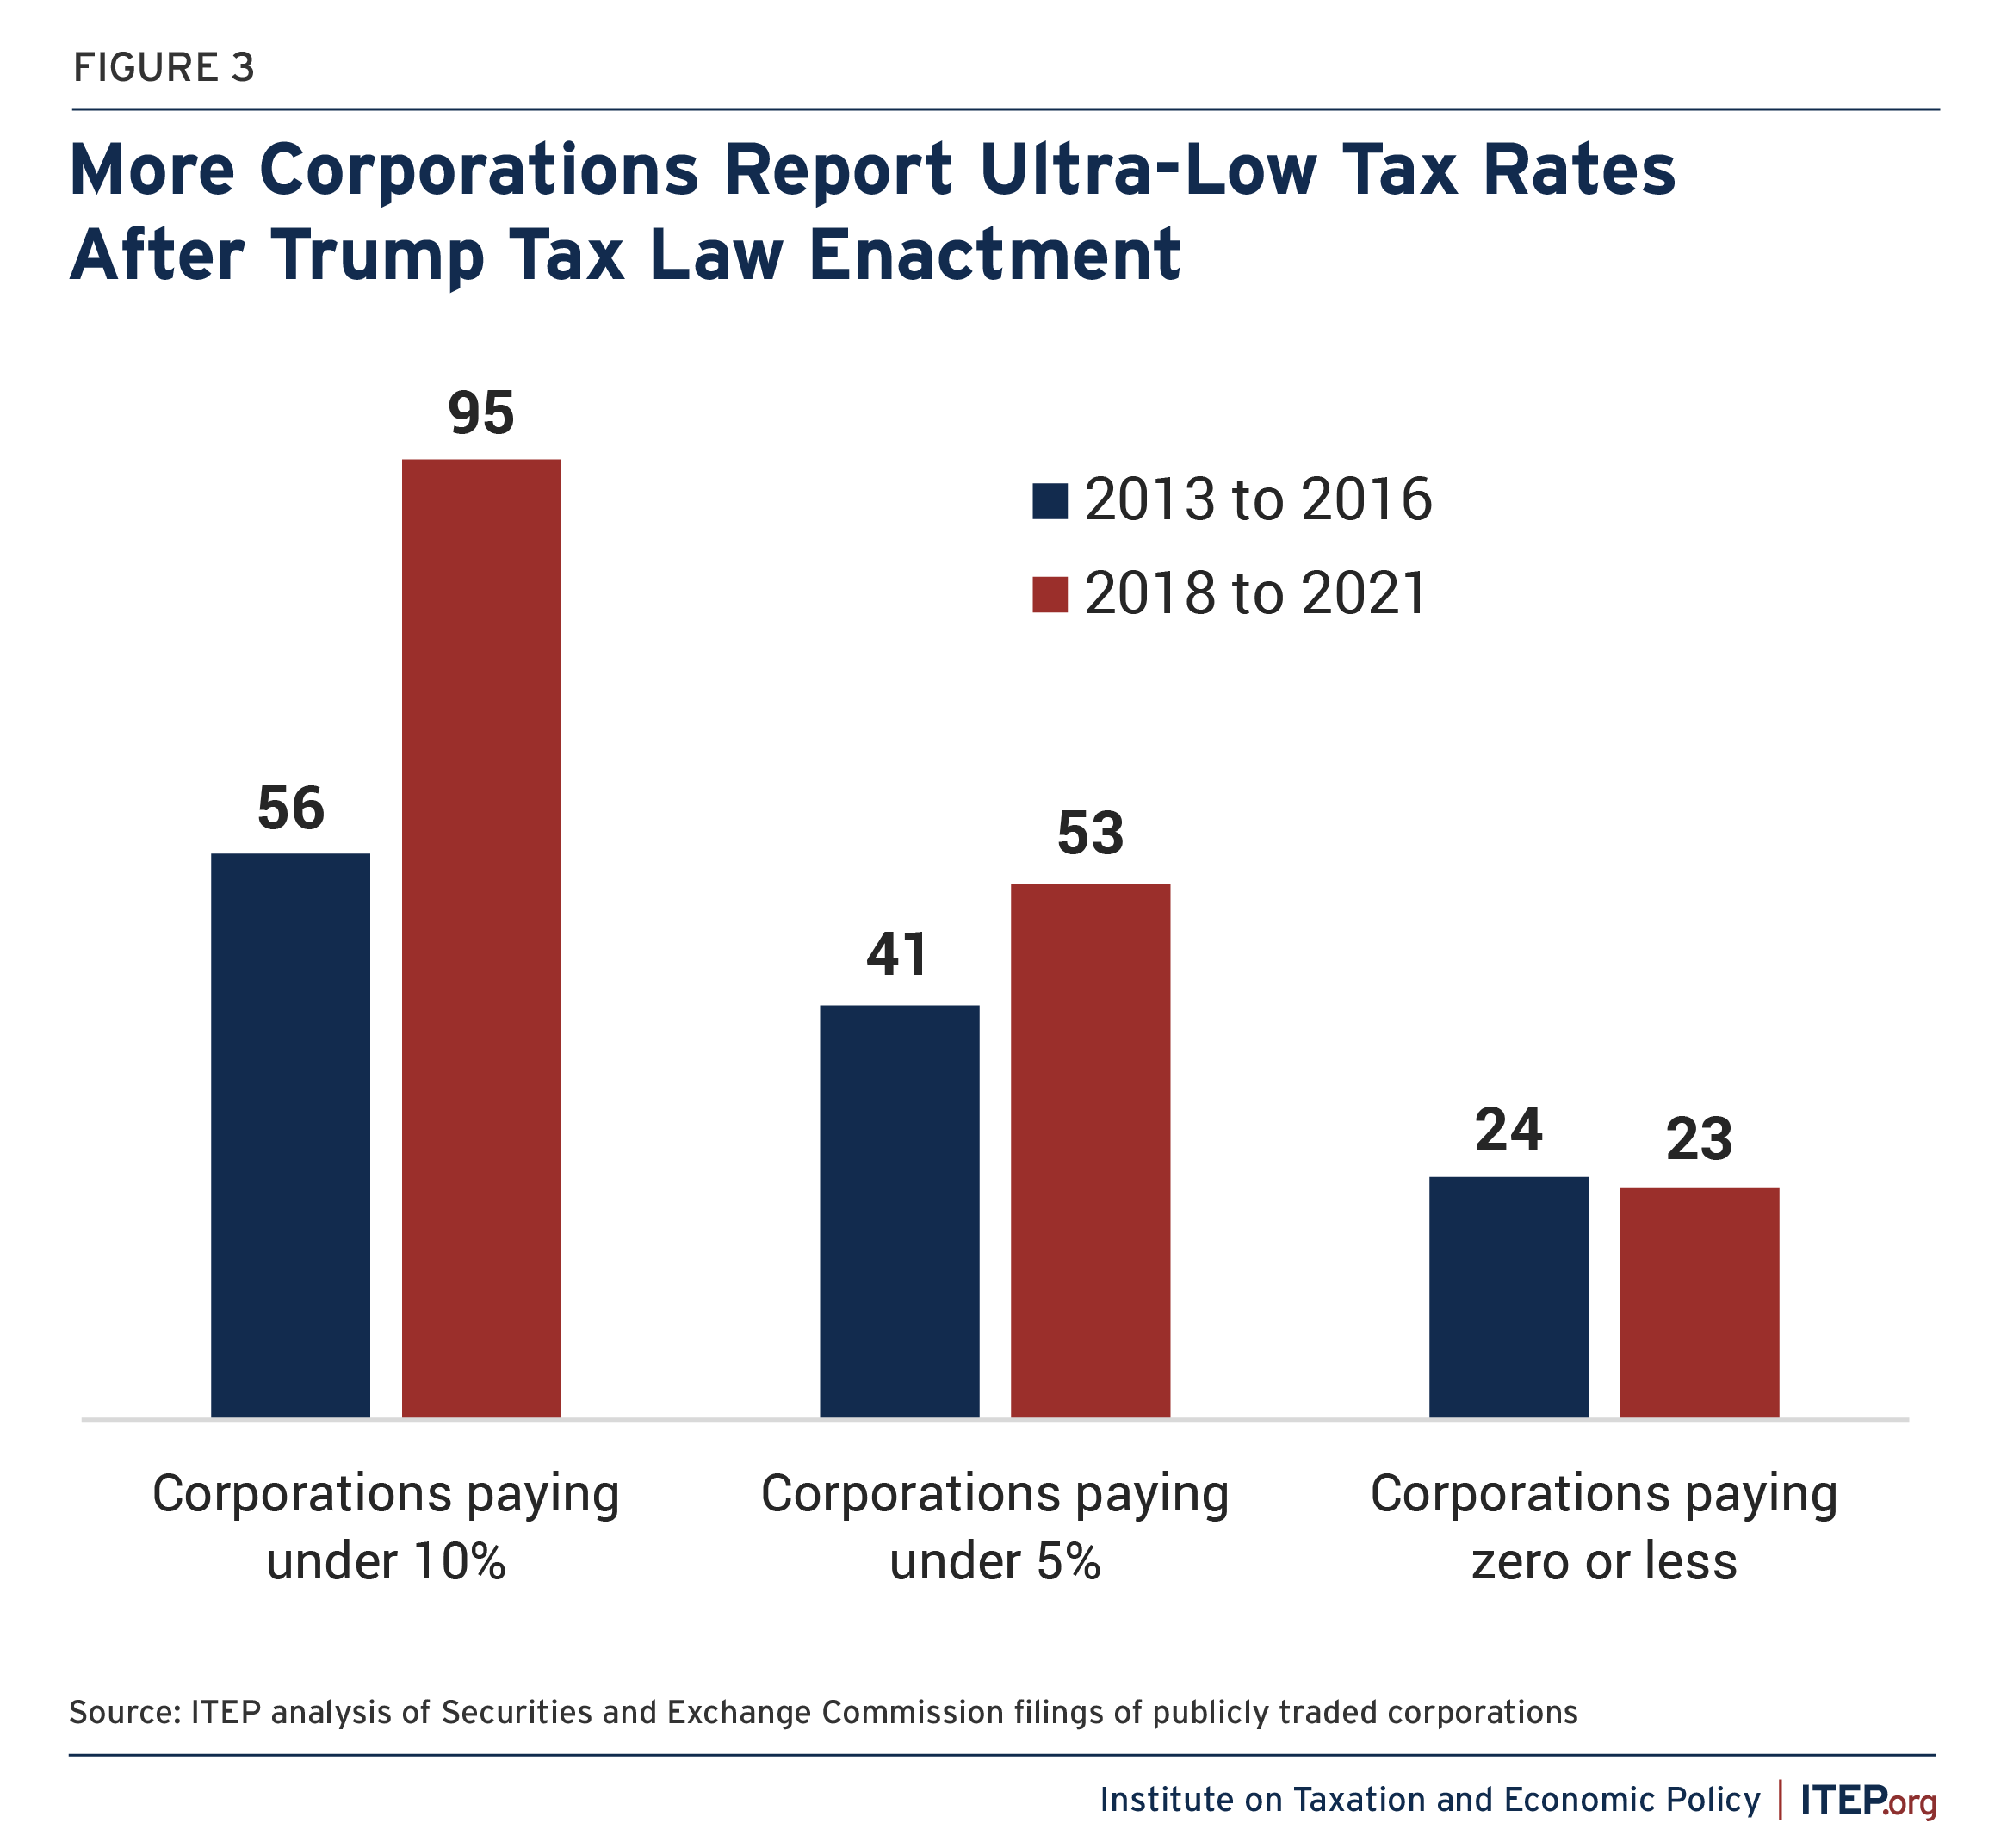
The Trump Tax Law Led to More Corporations Paying Extremely Low Tax Rates
Many individual companies in our sample disclose effective tax rates far below the already-low averages reported in this study both before and after 2017. The number of companies paying low taxes became more pronounced in the wake of the Trump tax law:
- For the 296 companies examined in this study, the number paying an effective tax rate of less than 10 percent rose from 56 in the pre-Trump period to 95 in the post-2017 period.
- The number of companies paying an effective tax rate of less than 5 percent rose from 41 in the pre-Trump period to 53 in the post-2017 period.
- The number of companies paying nothing in federal corporate income taxes was essentially unchanged (24 in the pre-Trump period and 23 in the post-2017 period).
Some Industries Enjoyed Especially Large Tax Cuts
Each of the 26 industry groups surveyed in this report experienced lower effective tax rates after passage of the 2017 tax cuts, but some industries got larger rate reductions than others. The biggest percentage point reduction in effective tax rates was in the electronics and electrical equipment sector. These companies saw their average tax rate fall from 31 to 9.3 percent after 2017, a rate reduction of more than 20 percentage points. A total of 14 industries benefited from double-digit drops in their effective tax rates after 2017.
Most other industries saw single-digit reductions in effective tax rates between these two periods. Three industries – motor vehicles, oil and gas, and utilities — saw particularly small changes in their effective tax rates between the two time periods because companies in these industries were already reporting tax rates averaging at, or close to, zero before the passage of the 2017 rate cut, so corporate tax cuts could offer them little.
Figure 4.
Effective Corporate Tax Rates for 296 Corporations, by Industry, Pre- and Post-Trump
| Industry | Four-year totals, 2013-2016 |
Four-year totals, 2018-2021 |
Effective rate point change |
||||
| ($ amounts in millions) | Profit | Tax | Rate | Profit | Tax | Rate | |
| Electronics, electrical equipment | $1,665 | $515 | 31.0% | $1,640 | $153 | 9.3% | –21.6% |
| Information Technology Services | $5,036 | $1,400 | 27.8% | $8,902 | $1,068 | 12.0% | –15.8% |
| Network and other communications equipment |
$2,889 | $812 | 28.1% | $4,493 | $556 | 12.4% | –15.7% |
| Health care | $67,175 | $23,524 | 35.0% | $122,582 | $23,885 | 19.5% | –15.5% |
| Industrial Machinery | $37,695 | $10,472 | 27.8% | $42,437 | $5,258 | 12.4% | –15.4% |
| Retail & wholesale trade | $283,906 | $88,309 | 31.1% | $441,722 | $70,685 | 16.0% | –15.1% |
| Semiconductors & other electronic components |
$53,496 | $14,287 | 26.7% | $99,629 | $12,019 | 12.1% | –14.6% |
| Miscellaneous services | $164,143 | $40,341 | 24.6% | $165,176 | $18,315 | 11.1% | –13.5% |
| Engineering & construction | $10,080 | $2,795 | 27.7% | $24,014 | $3,623 | 15.1% | –12.6% |
| Medical Products and Equipment | $11,150 | $2,687 | 24.1% | $14,948 | $1,714 | 11.5% | –12.6% |
| Food & beverages & tobacco | $64,862 | $17,378 | 26.8% | $76,550 | $11,081 | 14.5% | –12.3% |
| Financial data services | $55,056 | $16,056 | 29.2% | $80,298 | $13,686 | 17.0% | –12.1% |
| Aerospace & defense | $53,693 | $13,446 | 25.0% | $74,140 | $10,377 | 14.0% | –11.0% |
| Telecommunications | $208,009 | $37,663 | 18.1% | $247,859 | $18,208 | 7.3% | –10.8% |
| Internet Services & Retailing | $17,106 | $4,732 | 27.7% | $80,757 | $14,336 | 17.8% | –9.9% |
| Computer software | $14,051 | $3,419 | 24.3% | $23,807 | $3,622 | 15.2% | –9.1% |
| Miscellaneous manufacturing | $76,922 | $17,573 | 22.8% | $117,532 | $16,369 | 13.9% | –8.9% |
| Transportation | $61,875 | $14,735 | 23.8% | $74,748 | $11,417 | 15.3% | –8.5% |
| Chemicals | $21,466 | $4,010 | 18.7% | $23,908 | $2,808 | 11.7% | –6.9% |
| Pharmaceuticals | $29,996 | $8,536 | 28.5% | $48,014 | $10,406 | 21.7% | –6.8% |
| Household & personal products | $48,660 | $10,446 | 21.5% | $55,018 | $8,642 | 15.7% | –5.8% |
| Financial | $452,502 | $80,028 | 17.7% | $717,642 | $89,685 | 12.5% | –5.2% |
| Utilities, gas and electric | $115,760 | $2,928 | 2.5% | $124,628 | –$967 | –0.8% | –3.3% |
| Motor vehicles and parts | $25,379 | $1,022 | 4.0% | $29,756 | $481 | 1.6% | –2.4% |
| Metals & metal products | $7,000 | $1,318 | 18.8% | $24,964 | $4,160 | 16.7% | –2.2% |
| Oil, gas & pipelines | $14,527 | –$2 | –0.0% | $22,560 | –$132 | –0.6% | –0.6% |
| ALL INDUSTRIES | $1,904,096 | $418,429 | 22.0% | $2,747,726 | $351,456 | 12.8% | –9.2% |
Source: ITEP analysis of Securities and Exchange Commission filings of publicly traded corporations
Not All Companies Have Experienced Lower Taxes
Corporations’ effective tax rates can go up or down both because of tax law changes and because of changes in their businesses, such as where they are in investment cycles. The companies examined in this study were profitable every year from 2013 to 2021 and we compare two four-year periods before and after the large Trump corporate tax cuts—so meaningful tax bills are to be expected in both periods and declines in the share of profits paid in taxes are dominated by the significant changes in the tax law that affected all large corporations. This is why the overwhelming majority of the 296 companies, 246, saw cuts in their effective rates.
There were, however, 50 companies that saw tax increases. These tended to be companies that were starting with low effective tax rates. For example, Whirlpool’s taxes went from 5 to 8 percent, General Motors’ went from -1 to 0 percent and Netflix’s went from -5 to 0 percent (The latter two started with negative tax rates because their tax breaks exceeded the amount of tax they would have otherwise paid). Overall, 246 companies saw their rates cut about in half, dropping from an average of 24.6 to 13.3 percent, while 50 saw increases from an average of 4.2 to 9.9 percent.
Figure 5.
Effective Tax Rates Fell for Most Corporations Under Trump Tax Law
| Number of companies | Average effective rates | ||||||
| 2013-2016 | 2018-2021 | ||||||
| Effective tax rate dropped | 246 | 24.6% | 13.3% | ||||
| Effective tax rate increased | 50 | 4.2% | 9.9% | ||||
| All 296 companies | 296 | 22.0% | 12.8% | ||||
Source: ITEP analysis of Securities and Exchange Commission filings of publicly traded corporations
Uncertainty About Corporate Taxes After 2021
The year 2022 is excluded from this report because certain tax increases came into effect that year as scheduled under the Trump tax law, but Congress is considering reversing these policies retroactively, leaving companies’ ultimate tax liability for 2022 uncertain. The most significant of these is a tax hike related to research and development spending that came into effect in 2022 under the Trump tax law.[2] If the 2022 tax level were, unexpectedly, left in place, including 2022 would only raise the post-Trump average effective rate for the companies in this study by 1.2 percentage points.
The new tax increases that came into effect under the Trump law in 2022 (and the possible retroactive repeal of those tax increases by Congress) are not the only uncertain parts of the corporate income tax code right now.
Some of the tax avoidance allowed under the Trump tax law will be reduced by 2022’s Inflation Reduction Act. That law created a 15 percent corporate minimum tax that applies to the worldwide profits of the largest American corporations (those with profits exceeding $1 billion on average over the preceding three years). It also created a new 1 percent tax on stock buybacks that is technically an excise tax (rather than a corporate income tax) paid by companies when they repurchase stock to enrich their shareholders. Both provisions went into effect in 2023 and we may soon have more information about their impact on corporations.
Congress has several options to address corporate tax avoidance and reverse the effects of the 2017 law. For example, President Biden has proposed to partly reverse the reduction in the statutory corporate income tax rate, increase the corporate minimum tax that was originally enacted as part of the Inflation Reduction Act, bar corporations from deducting compensation paid to any individual beyond $1 million annually, and impose a strong minimum tax on offshore corporate profits, among other reforms.[3]
How This Study Compares What Corporations Paid Before and After the Trump Tax Law
This analysis is based on information that publicly traded corporations report to shareholders and potential investors in their annual 10-K reports. It uses the profits that companies report, as well as the “current” federal income tax they report for the year, which is their best estimate of the corporate federal income tax they will pay for the year.
The corporations included in this report were profitable each year from 2013 through 2021. Within this timeframe this study compares what companies paid in two four-year time periods when federal corporate tax law was stable and predictable.
The year 2017 is excluded because most corporations reported in their 2017 10-Ks the transition tax they paid on offshore profits (which were generated over previous years sometimes going back decades) as required under the new law. Many companies reported the transition tax in ways that make it difficult to disentangle from the federal income taxes they paid on U.S. profits (the subject of this report) for 2017.
The year 2022 is excluded because of the uncertainty previously described in how much companies will ultimately end up paying on their 2022 profits.
With the exclusion of 2017 and 2022, we are left with two comparable four-year time periods: 2013 through 2016 (when the statutory federal corporate tax rate was 35 percent) and 2018 through 2021 (when the statutory rate is 21 percent).
For more details on how this report calculates effective corporate tax rates, see Appendix 2.
Appendix 1
Effective Federal Corporate Income Tax Rates, 2013-2016 and 2018-2021
Appendix 2: Corporate Effective Tax Rate Calculation Methodology
This study assesses the health of the U.S. corporate income tax by looking at how it has affected the largest and most profitable corporations in America over the nine years from 2013 through 2021. The study’s research concept and methodology closely follow the approach used in a series of reports by Citizens for Tax Justice and the Institute on Taxation and Economic Policy for the past 40 years. This latest edition in this long-running series looks at 296 of the largest corporations in America and analyzes the federal income taxes reported by each of these companies on their U.S. pretax income over the eight years from 2013 to 2016 and 2018 through 2021. The report calculates, for each company in the sample, an effective federal income tax rate (that is, current federal income tax expense as a share of pretax U.S. income) for both of those four-year periods. All information presented in this study is taken from the 10-K annual financial reports that publicly traded corporations are required to file each year with the Securities and Exchange Commission (SEC).
The sample selection for the companies included in this study begins with the complete universe of publicly traded, U.S.-based corporations in the Fortune 500 (a ranking based on revenues) and the S&P 500 (a ranking based on market capitalization). From this initial list, we excluded companies that reported a U.S. pretax loss in any year from 2013 through 2021. We also excluded companies that failed to provide sufficient information to calculate U.S. pretax income, or current federal income tax, or (in some cases) both. (For example, the hugely profitable corporation Goldman Sachs does not publish a pretax income estimate for the U.S. Berkshire Hathaway does not publish an estimate of current federal income tax.) We also excluded companies that, while consistently profitable, did not publish information for all 10 years between 2013 and 2021, either because their IPO took effect after 2013 or because the company was acquired or otherwise transformed before 2021. Finally, we excluded a small number of multinational corporations that reported geographic income splits that appear implausible relative to the amount of tax expense reported. The most prominent example of this phenomenon is Apple, which consistently reported effective U.S. tax rates over 40 percent in years after 2012, almost twice as high as the statutory U.S. tax rate (even higher after factoring in deferred taxes), which implies that the U.S./foreign income split reported in the 10-K is simply inaccurate. This left us with the 296 companies included in this report.
The tax expense reported by the 296 companies included in our final sample from 2013 through 2021 was about a third of total federal corporate income tax collections during that time. The effective tax rates published in this study are based entirely on data published by these companies in their annual financial reports. In most cases, the effective tax rate for any year is the product of three numbers: U.S. pretax income, current federal income tax, and current state income tax (which is subtracted from pretax income to get net pretax income). The effective federal income tax rate is calculated as: current federal tax / (U.S. pretax income – current state tax).
The use of current federal tax expense is important because current taxes are those the company is obligated to pay during the year and excludes “deferred” income taxes that the company owes but is allowed to postpone paying until a later year.
The pretax incomes published in this study are generally what the companies themselves reported. In some cases, the information reported by the companies does not directly state their pre-tax income, so some calculations are required using the information they do provide. For example, when companies with a (small) multinational presence failed to disclose the geographic split of pretax income, we calculated the U.S. and foreign income share using data on the geographic location of operating profit (where available), or, more frequently, we estimated foreign income using reported foreign tax.
A second infrequent calculation to the published data relates to “noncontrolling interest income.” This is income of a company’s subsidiary that is reported on financial statements as part of income, but that is not taxable to the corporation. When substantial noncontrolling interest income was disclosed, we subtracted it from U.S. and/or foreign pretax income.
A third calculation to published income data relates to “goodwill impairments.” These are non-cash, non-taxable charges against income that are taken irregularly by companies to reflect a sharply diminished estimate of the company’s future earnings potential. These charges affect neither a company’s income taxes nor its cash flow. When these impairments were disclosed, we added them back to reported pretax income.
On the tax side, reported current federal income tax expense was infrequently adjusted in one of two ways. The first has to do with the one-time “transition tax” on pre-2018 earnings imposed by the 2017 tax law. Companies were required to add the expected value of this transition tax to current tax in the ongoing fiscal year when the law was enacted in December 2017. Companies, however, were allowed to pay their transition tax bills over several years. For companies reporting an impact after 2017, either because their fiscal year does not follow the calendar year, or because the companies made second-year or even third-year revisions to their initial estimate of transition tax expense, we subtracted transition tax expense from reported current tax where it was disclosed. We also subtracted the value of Global Intangible Low Taxed Income (GILTI) expense in the limited number of cases where it was disclosed starting in 2018, because this feature of the 2017 tax law is explicitly levied against foreign income, not U.S. income.
For companies disclosing excess tax benefits from stock options before 2016, we also subtracted these benefits from reported current tax expense. This is because until 2016, financial accounting rules allowed companies to report their current tax expense as if these stock option tax breaks did not exist. The value of these tax breaks was reported separately in the consolidated statement of cash flows. A 2016 modification of accounting standards by the Financial Accounting Standards Board (FASB) required companies to subtract the value of these stock option benefits going forward and gave companies leeway in choosing an adoption date. For each company disclosing these tax benefits, we subtract them from reported tax only in the years before they adopted the new FASB standards.
Endnotes
[1] Matthew Gardner, Steve Wamhoff, and Spandan Marasini, “Corporate Tax Avoidance in the First Five Years of the Trump Tax Law,” Institute on Taxation and Economic Policy, February 29, 2024.
[2] Ibid, 1.
[3] Steve Wamhoff, “Revenue-Raising Proposals in President Biden’s Fiscal Year 2025 Budget Plan,” Institute on Taxation and Economic Policy, March 12, 2024.