Extending Temporary Provisions of the 2017 Trump Tax Law: National and State-by-State Estimates
report


An updated version of the state-by-state estimates is available here.
Download National & State-by-State Data
Download state-by-state graphics
Key findings
● The recently introduced TCJA Permanency Act would make the temporary parts of the Tax Cuts and Jobs Act of 2017 (TCJA) permanent at a cost of $288.5 billion in 2026 alone.
● The poorest fifth of Americans would receive just 1 percent of that total while the richest fifth of Americans would receive nearly two-thirds.
● The bill’s most beneficial provisions for the richest 1 percent of taxpayers are the deduction for “pass-through” business income and the cut in the estate tax.
● The combined impact of extending the temporary TCJA provisions and the TCJA provisions that are already permanent is even more tilted in favor of the richest Americans.
The TCJA Permanency Act, recently introduced by Congressional Republicans, would make permanent the provisions of the Tax Cuts and Jobs Act of 2017 that would otherwise expire at the end of 2025. The bill would cost $288.5 billion in 2026 alone.[1] The legislation would disproportionately benefit the richest Americans in several ways:
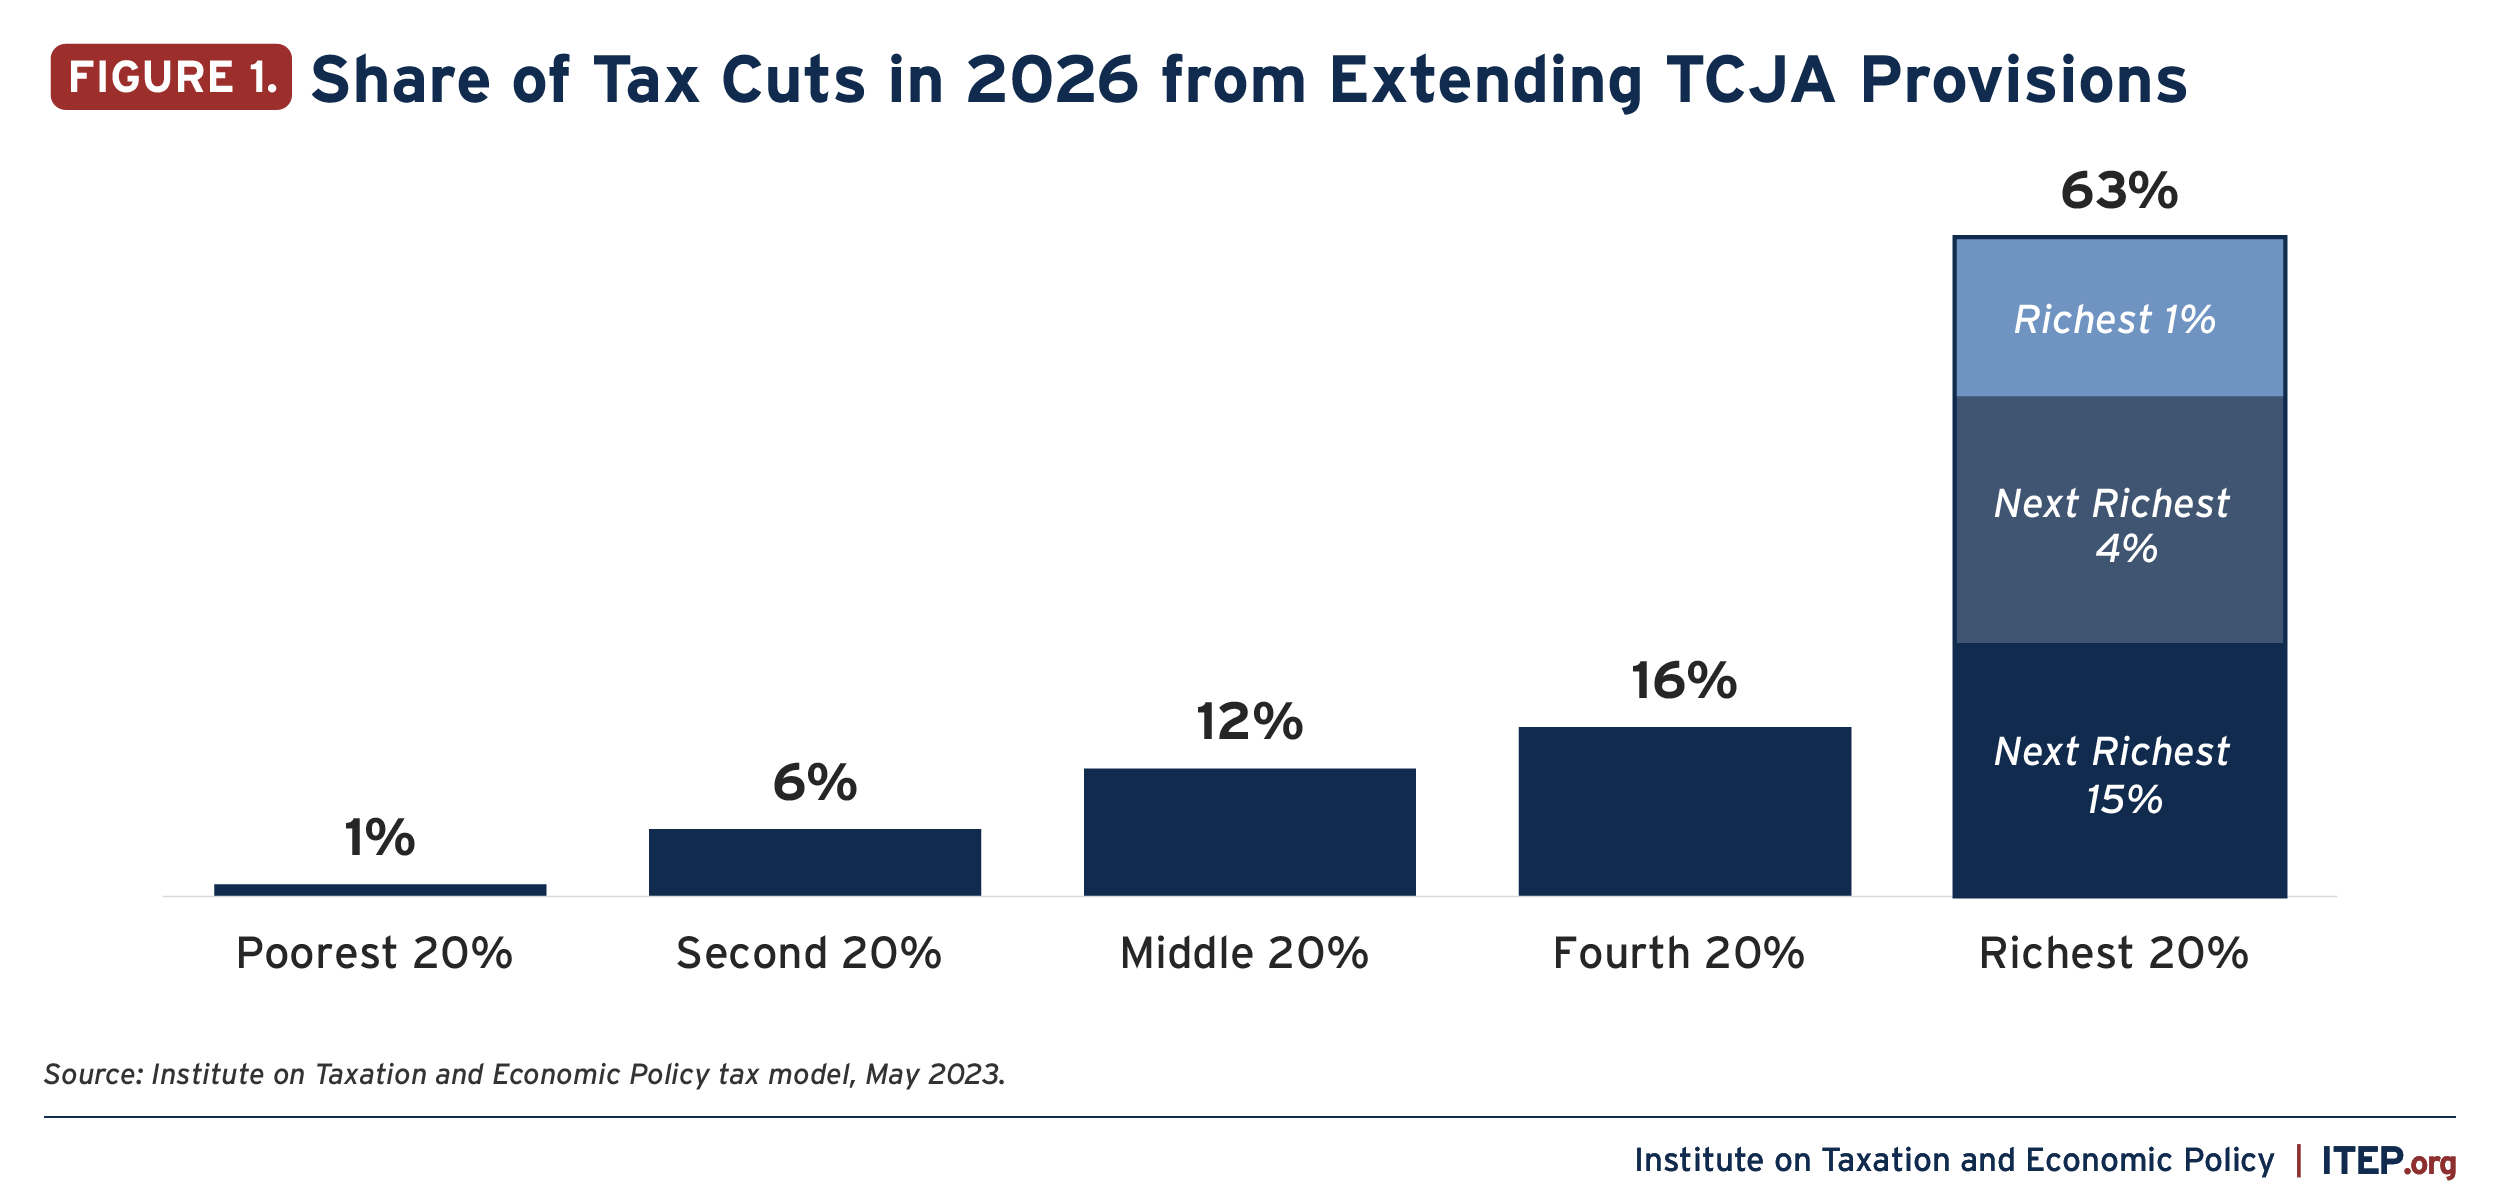
1) In 2026 the poorest fifth of Americans would receive just 1 percent of that total while the richest fifth of Americans would receive nearly two-thirds of that total.
The richest 20 percent would receive 63 percent of the tax cuts in 2026 and the richest 5 percent alone would receive nearly 40 percent of the tax cuts.
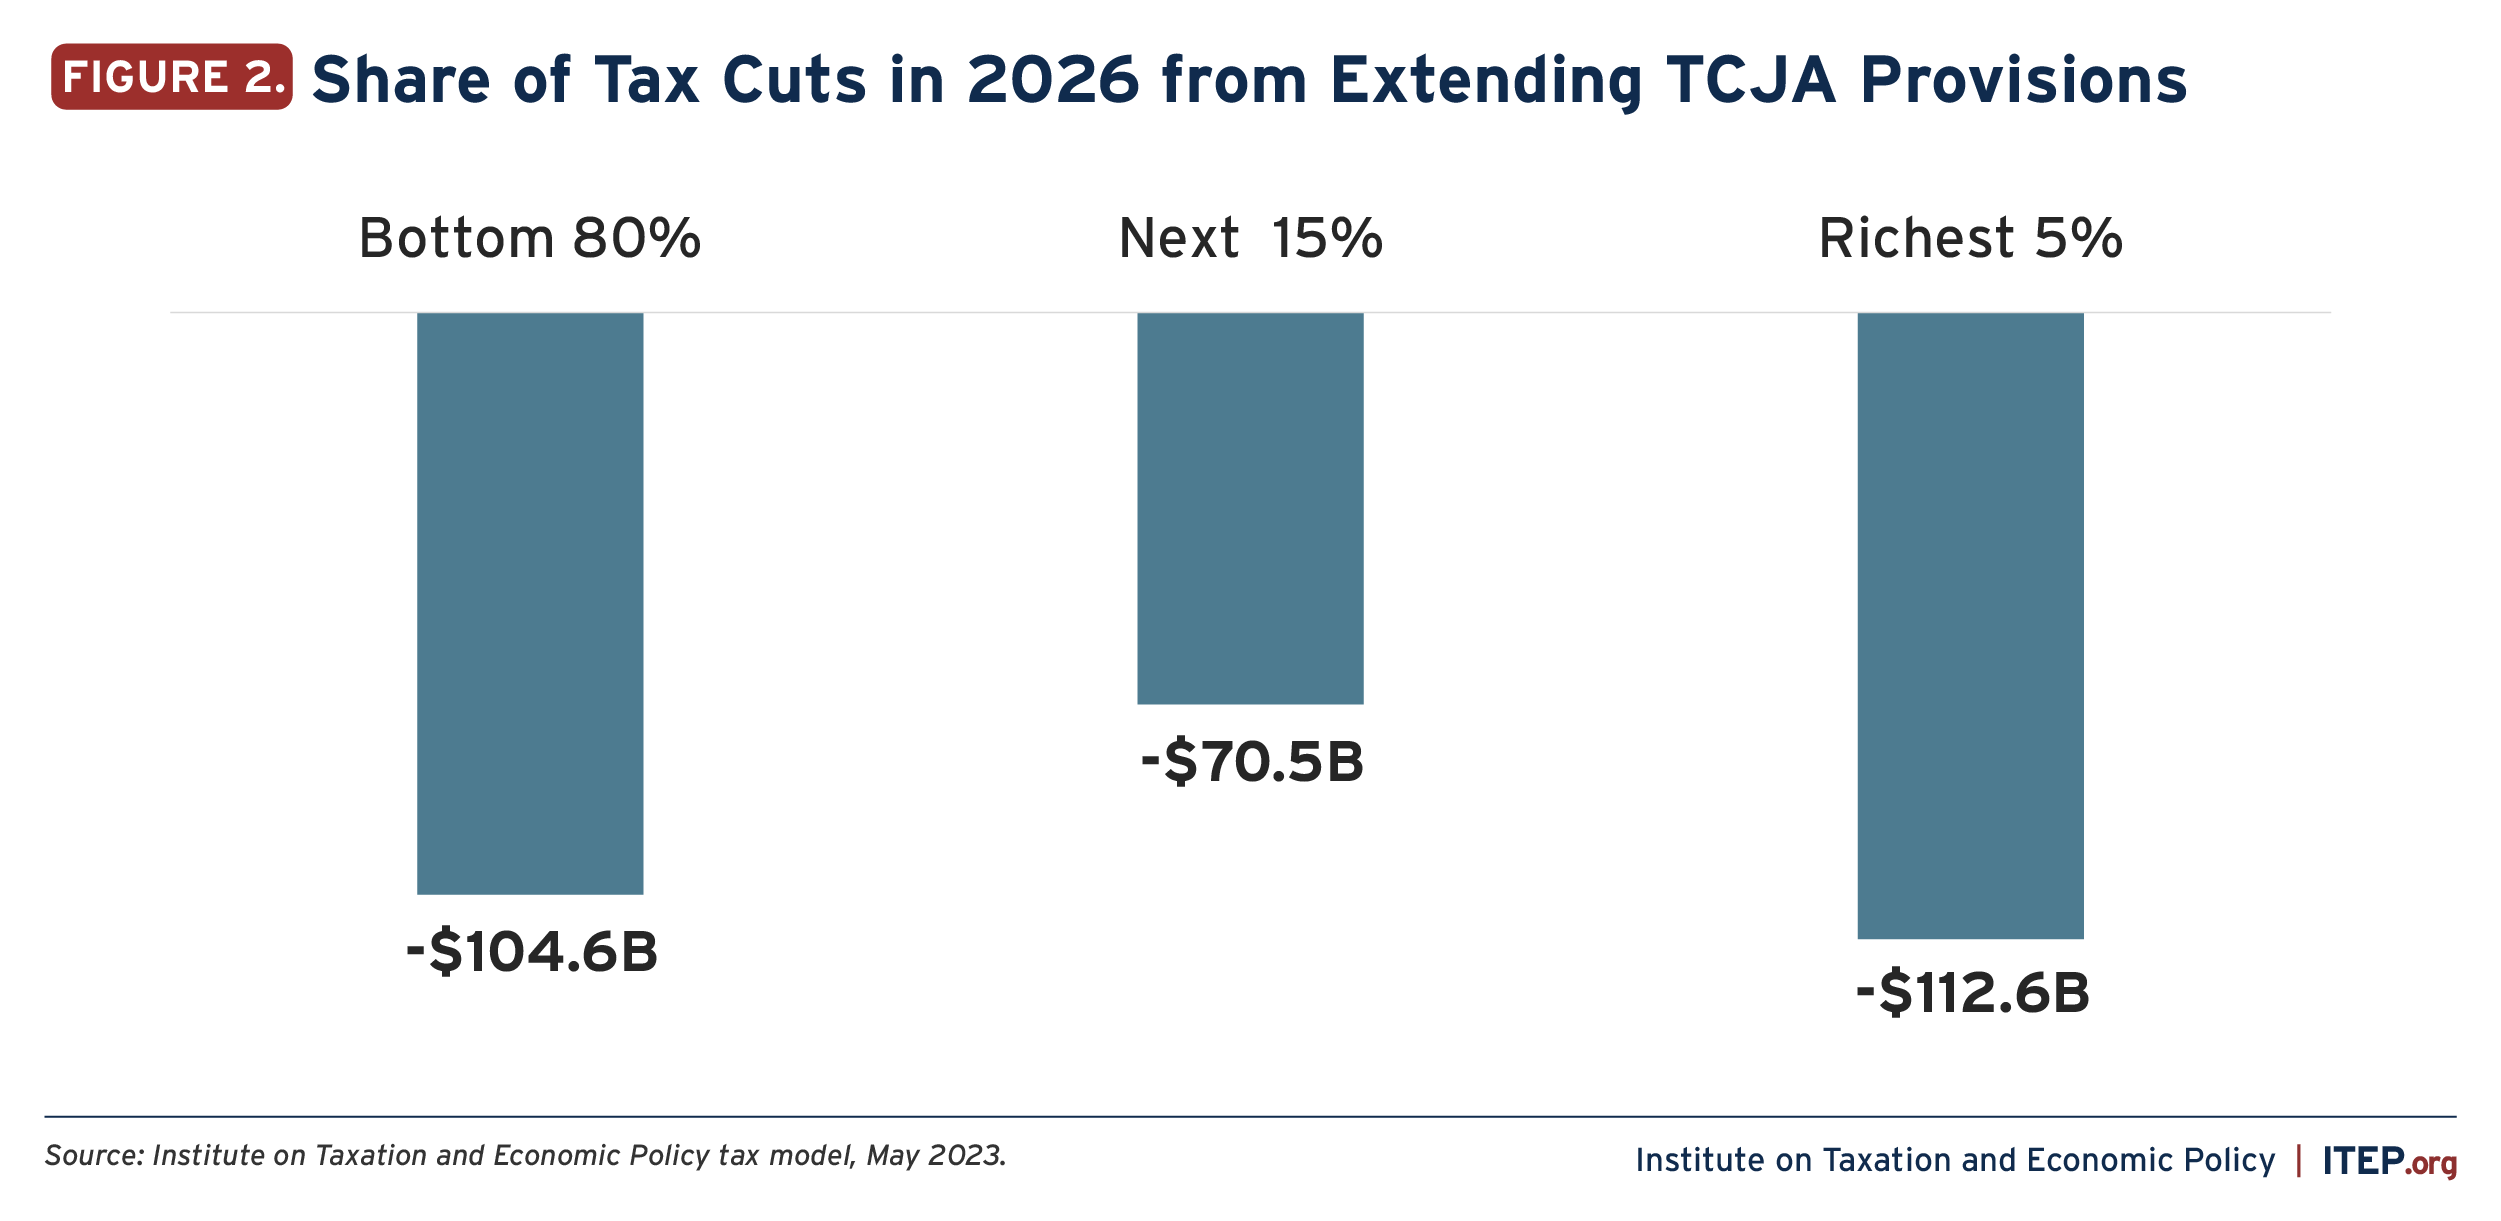
2) The TCJA Permanency Act would provide more tax breaks to the richest 5 percent of Americans than it would provide to the bottom 80 percent of Americans.
The richest 5 percent would receive $112.6 billion in total tax cuts in 2026 compared to $104.6 billion for the bottom 80 percent.
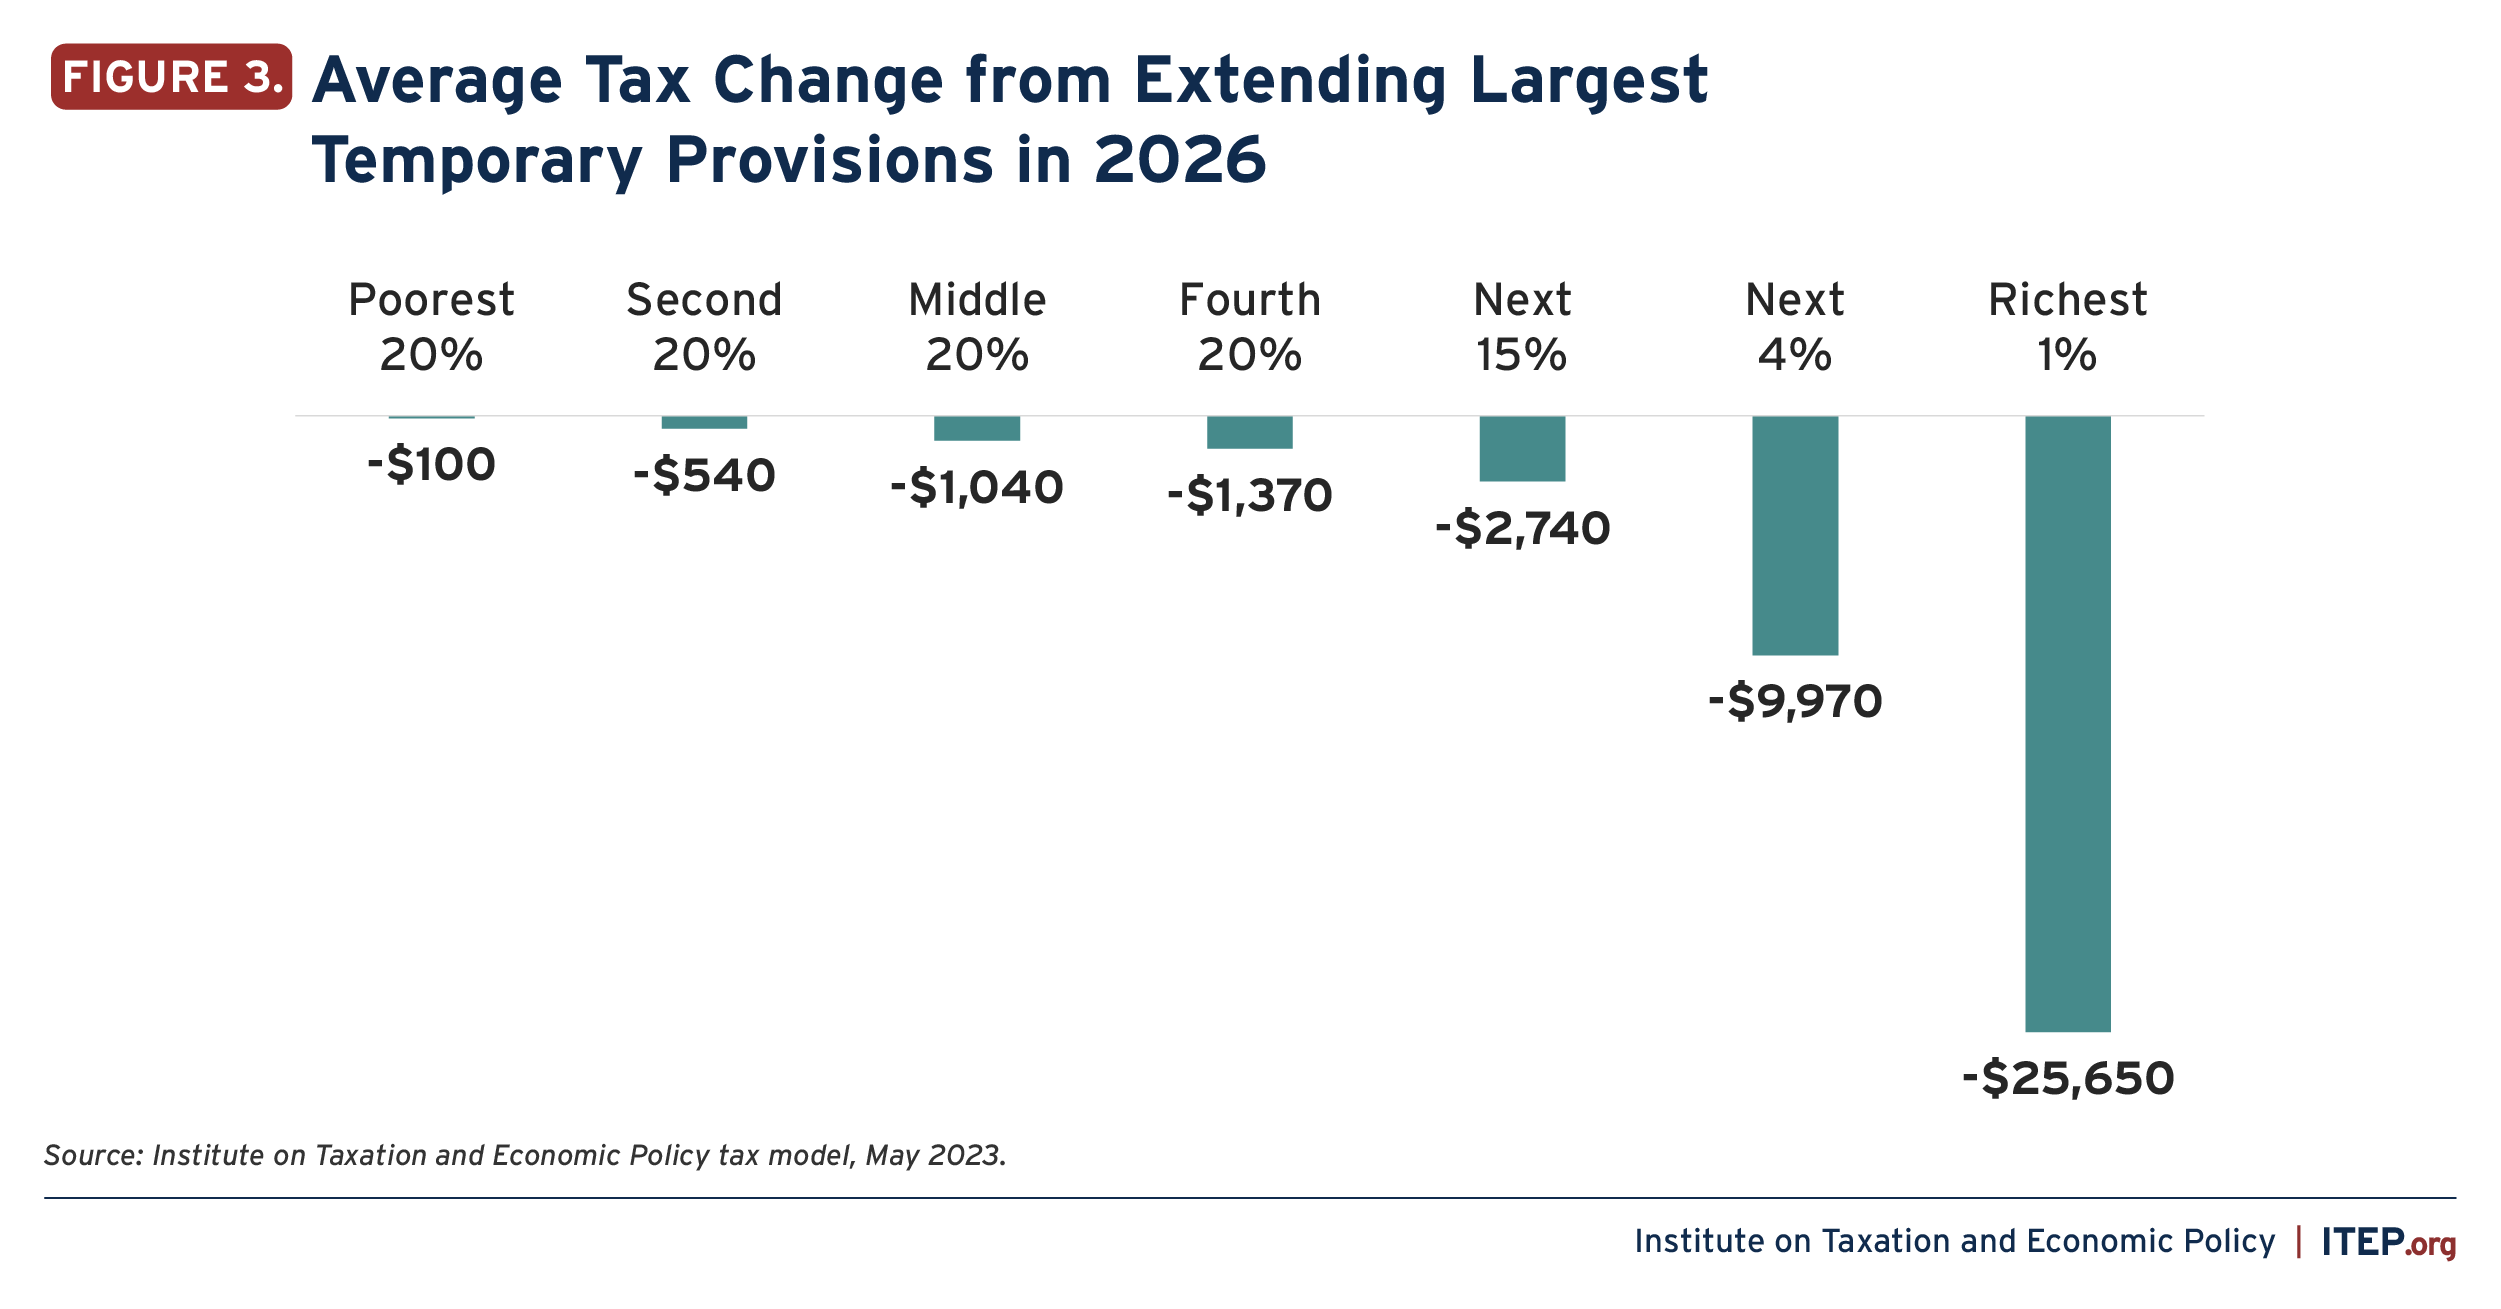
3) The poorest fifth of Americans could expect an average tax cut of $100 while the richest 1 percent could expect an average tax cut of nearly $26,000.
The average tax cut for the richest 1 percent would be 25 times that of the middle 20 percent and more than 250 times that of the bottom 20 percent of Americans.
4) The bill’s most beneficial provisions for the richest 1 percent of taxpayers are the deduction for “pass-through” business income and the cut in the estate tax.
The other temporary provisions that would be made permanent include a provision that, on its own, raises taxes for many well-off households (the cap on state and local tax deductions).

5) When combined with the portions of TCJA that are already permanent, the tax changes are even more tilted to the richest Americans.
The significant permanent provisions in TCJA include a less generous inflation adjustment for the tax code, repeal of the penalty for failing to obtain health insurance, and a large package of corporate tax changes.
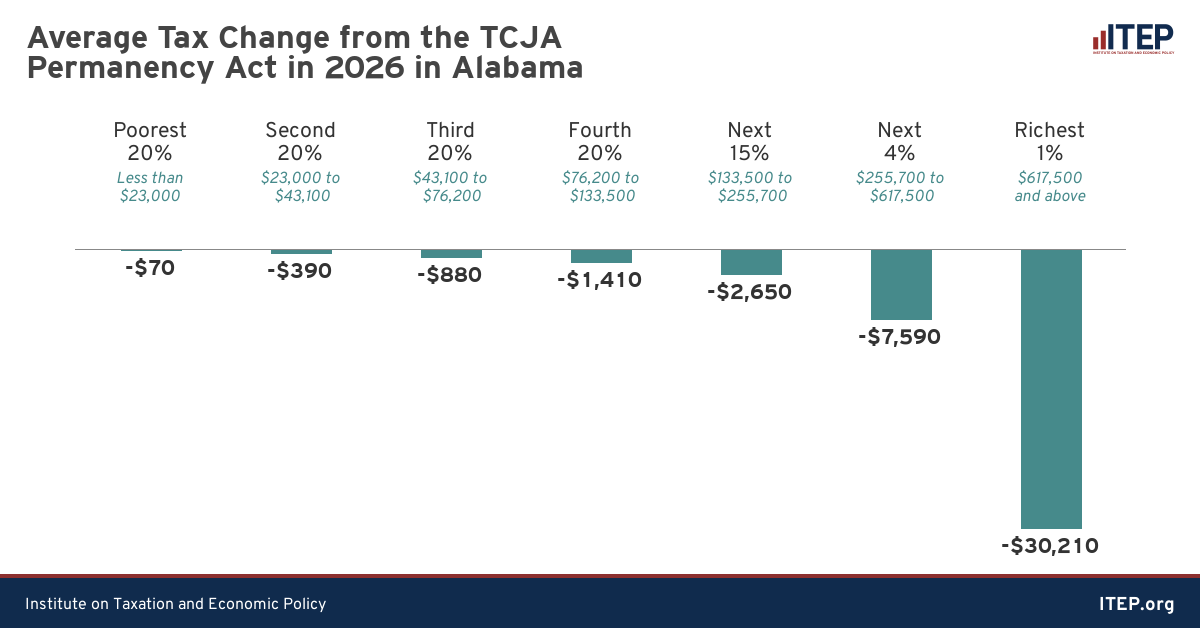
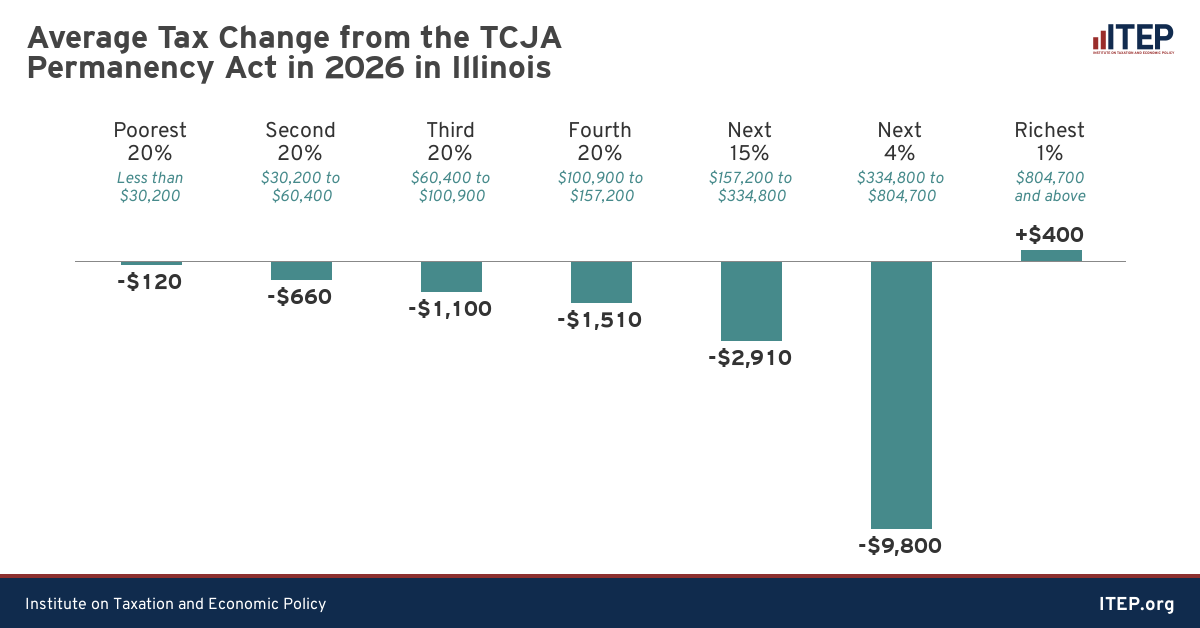
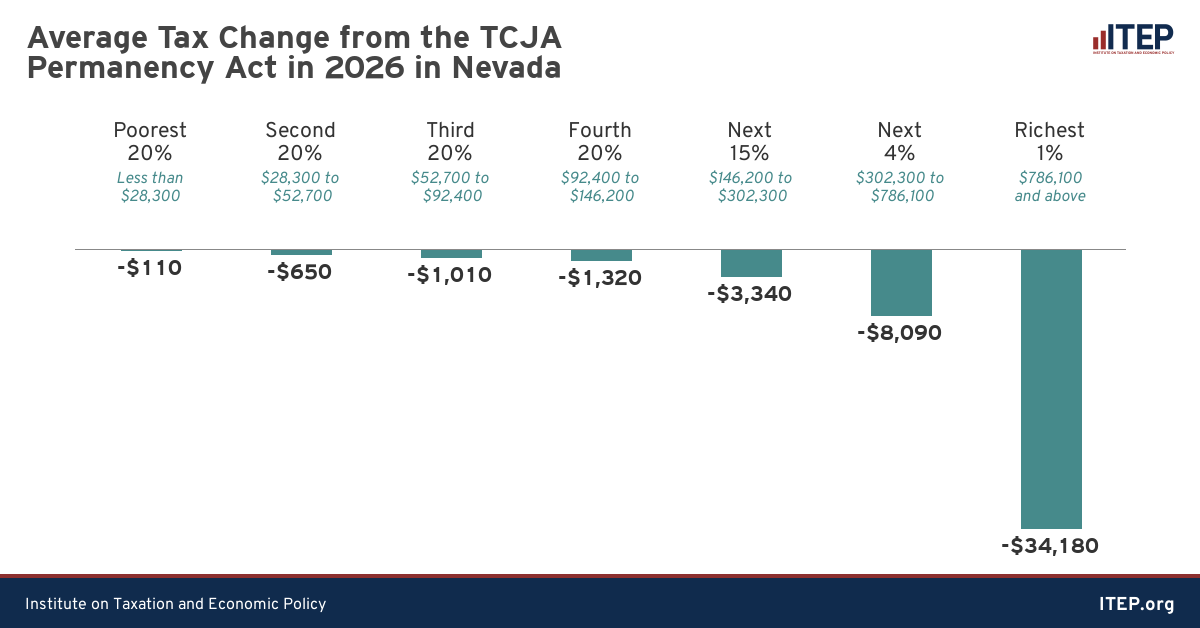
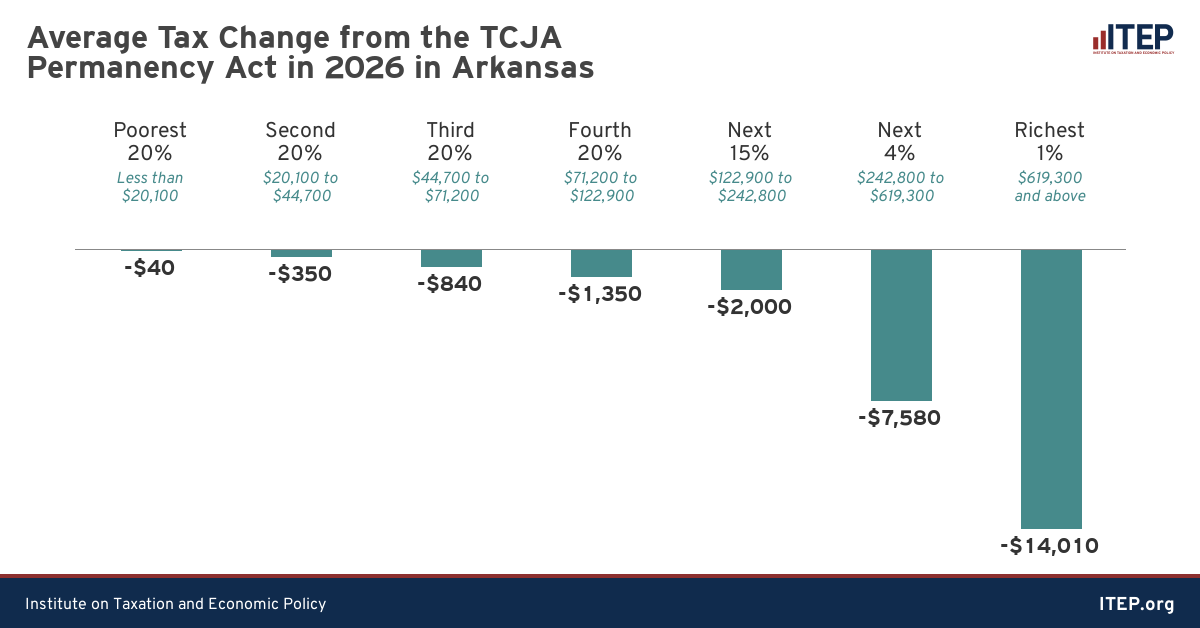
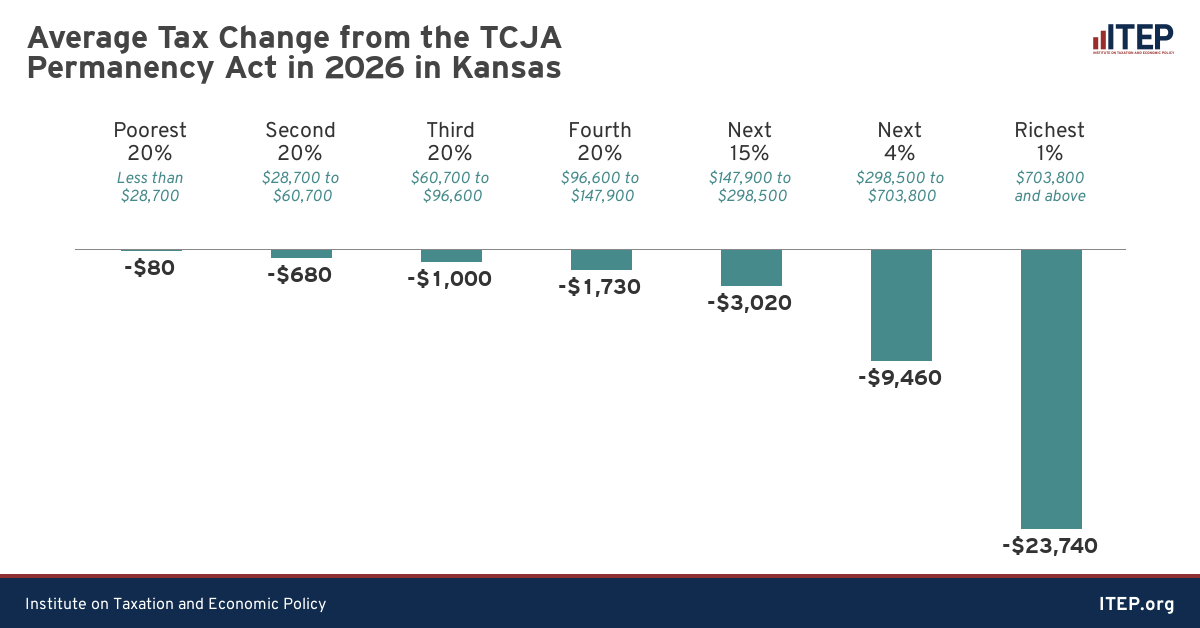
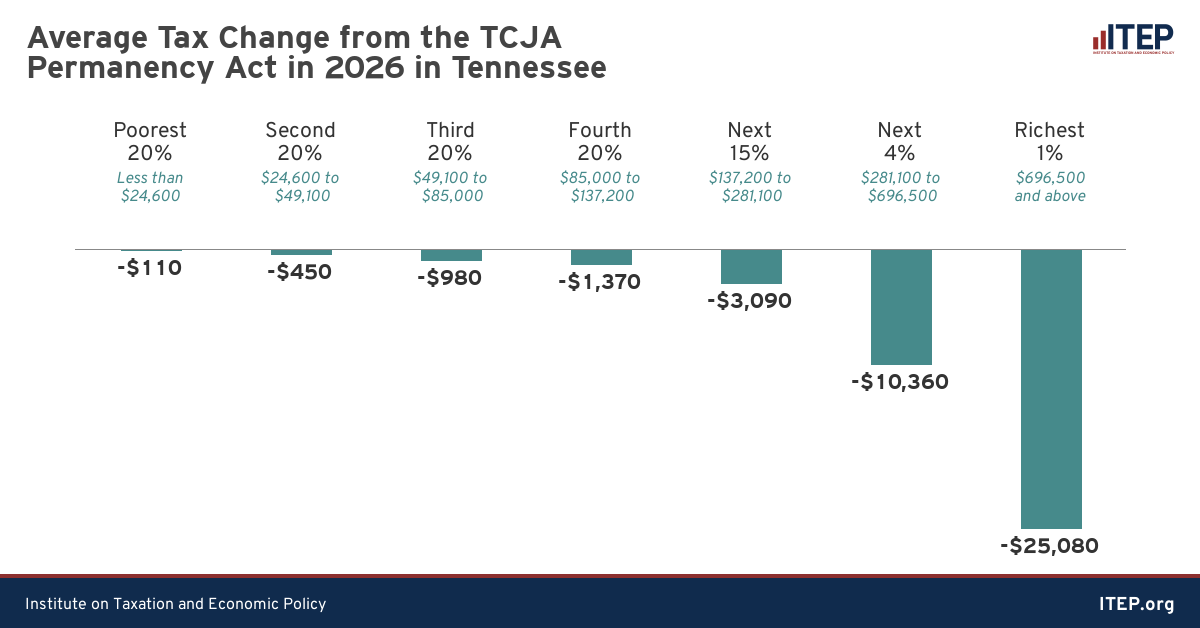
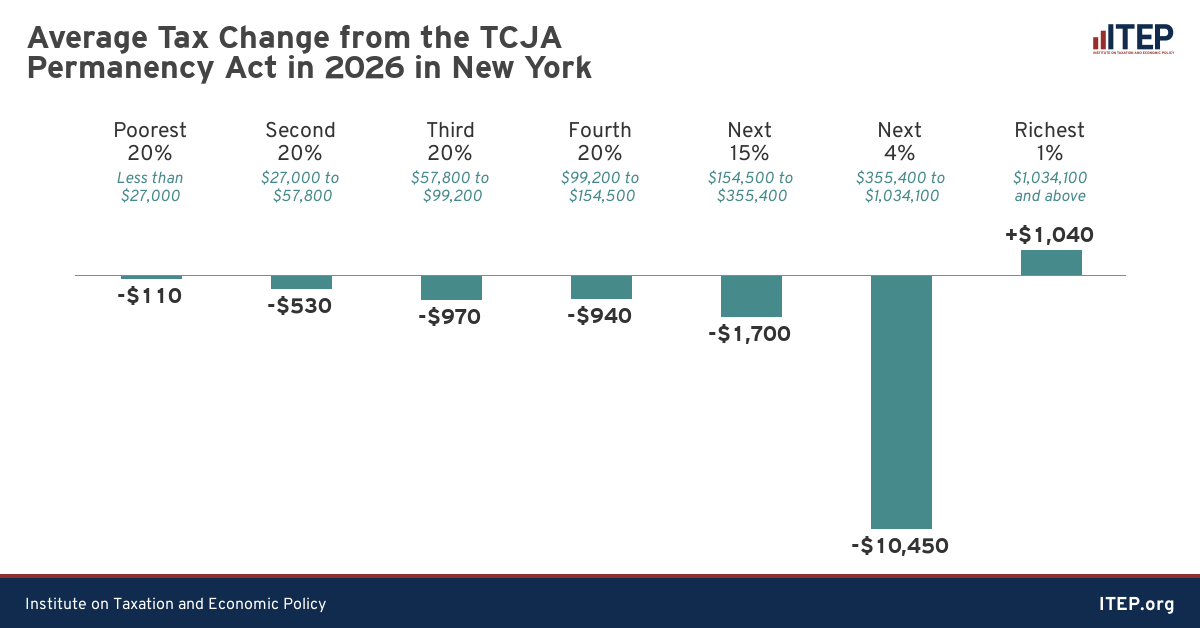
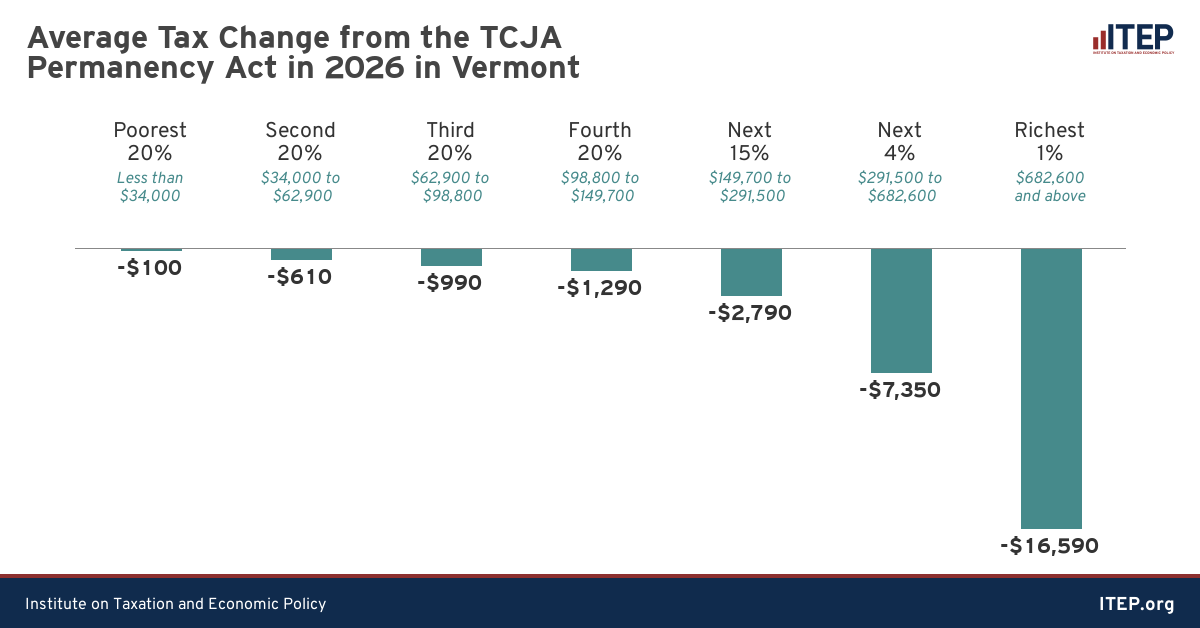
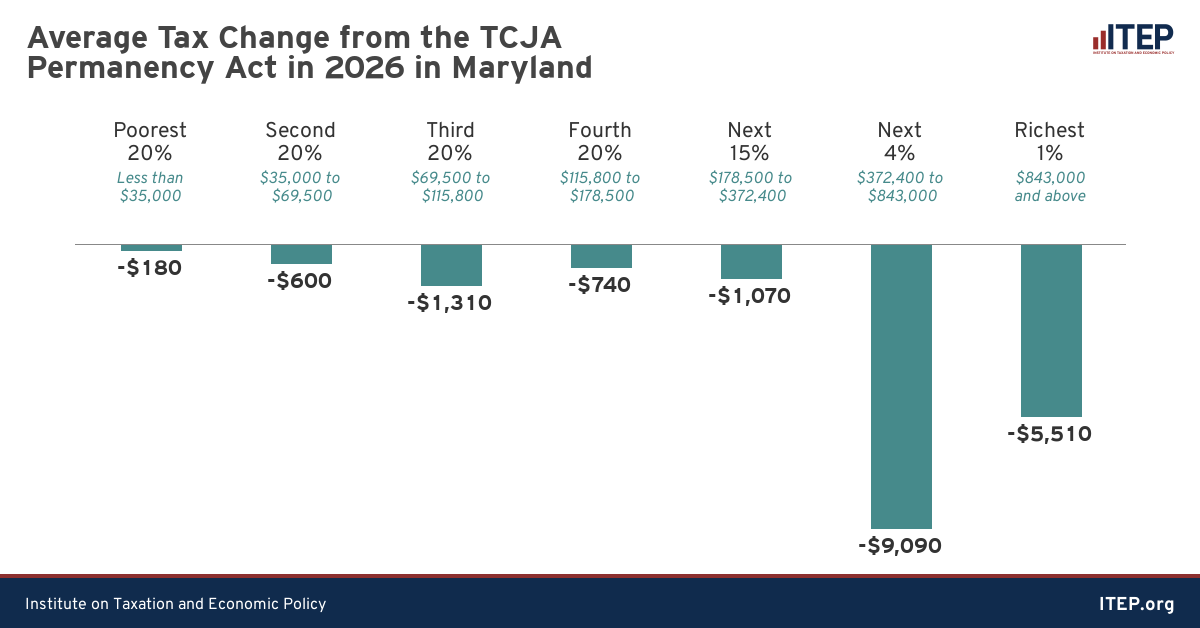
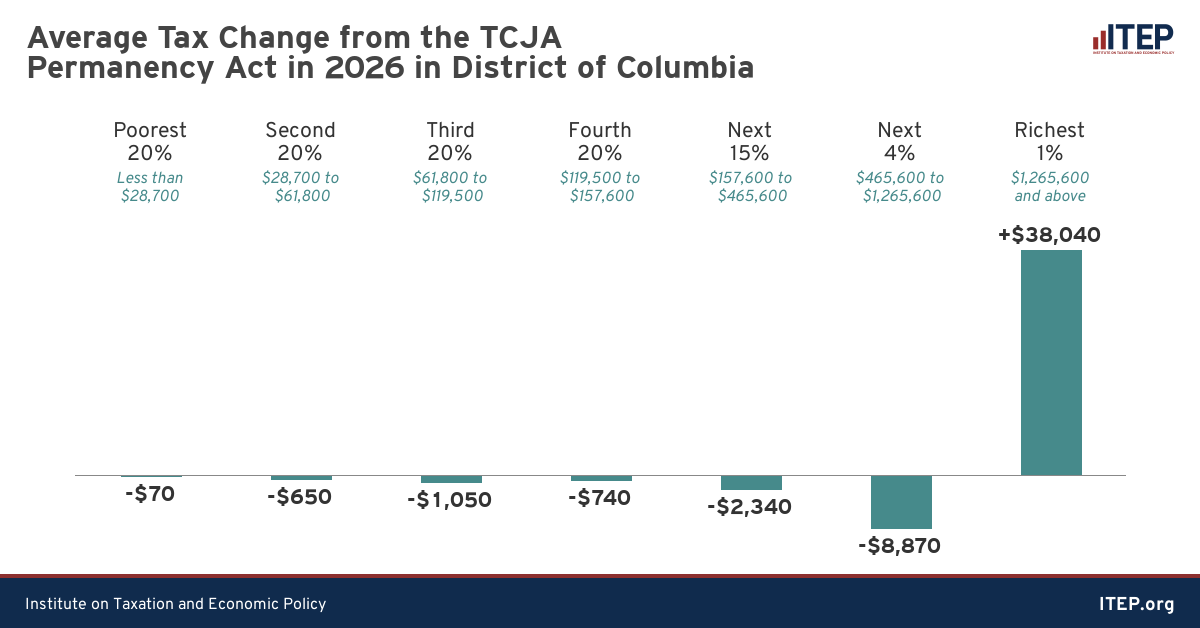
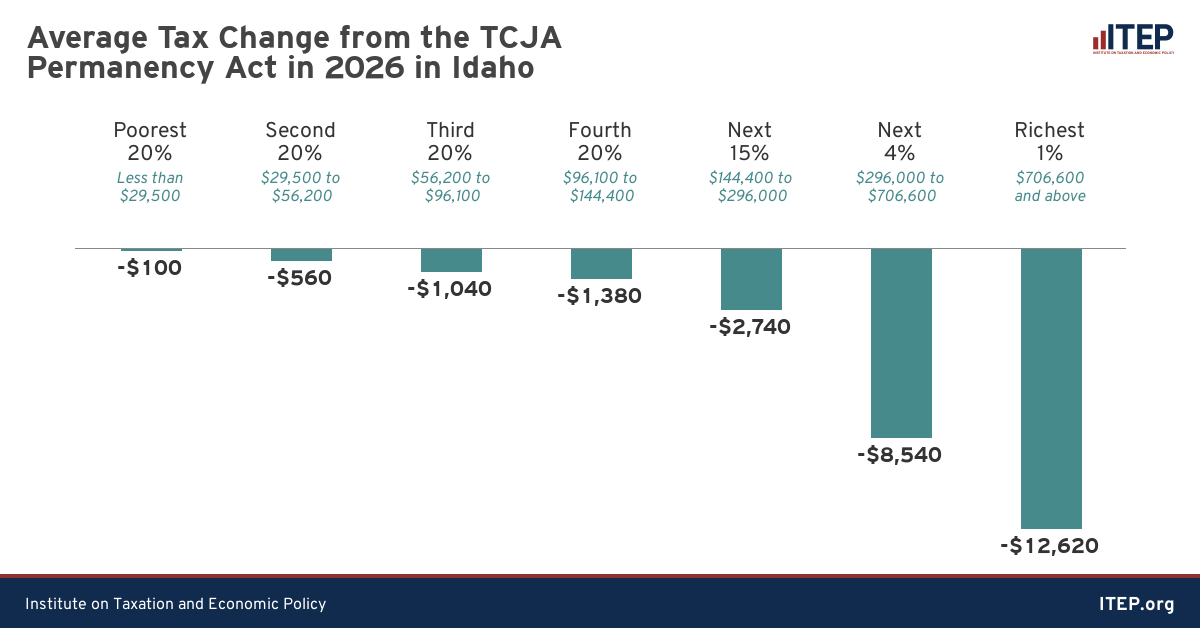
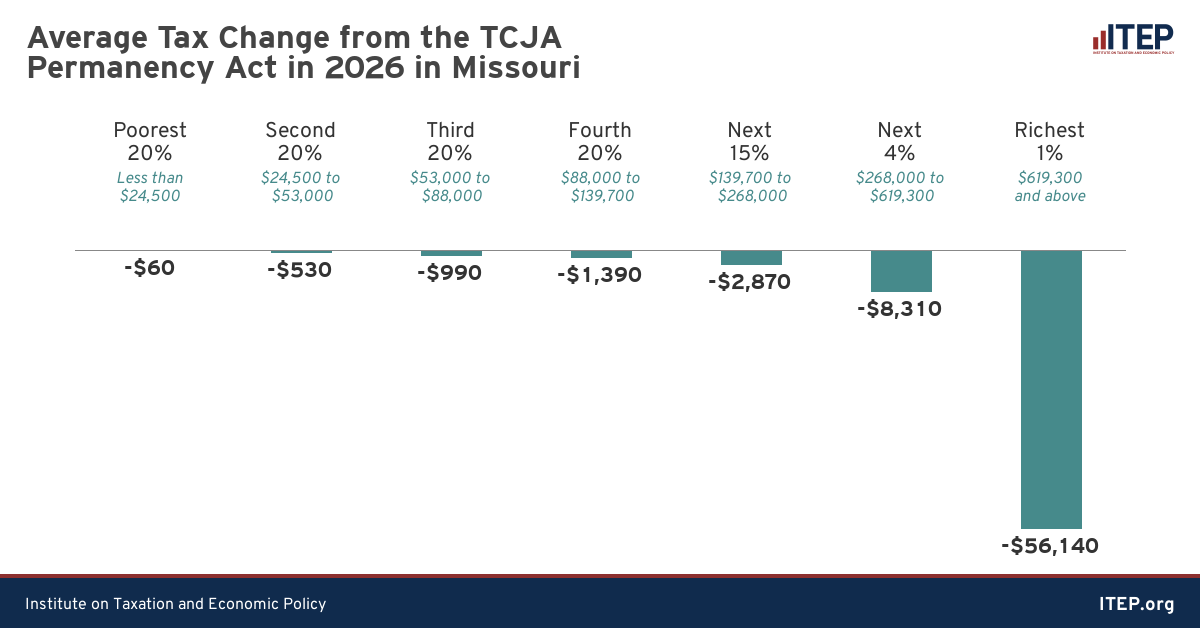
6) The typical tax impact varies dramatically from one state to another, partly because the 2017 tax law was designed to be less generous to residents of states with higher state and local taxes.
These state-by-state differences are illustrated in detail in the data available for download.
Estimates in this report were produced using ITEP’s tax microsimulation model and methods are discussed in more detail in the appendix.[2]
Temporary Provisions of the Tax Cuts and Jobs Act That Would Be Extended
Many of the changes enacted as part of the Tax Cut and Jobs Act, which was signed into law by former President Trump in 2017, are scheduled to expire at the end of 2025. The TCJA Permanency Act would make them permanent and would therefore affect taxpayers beginning in 2026. This report groups the most significant of these provisions into three categories.
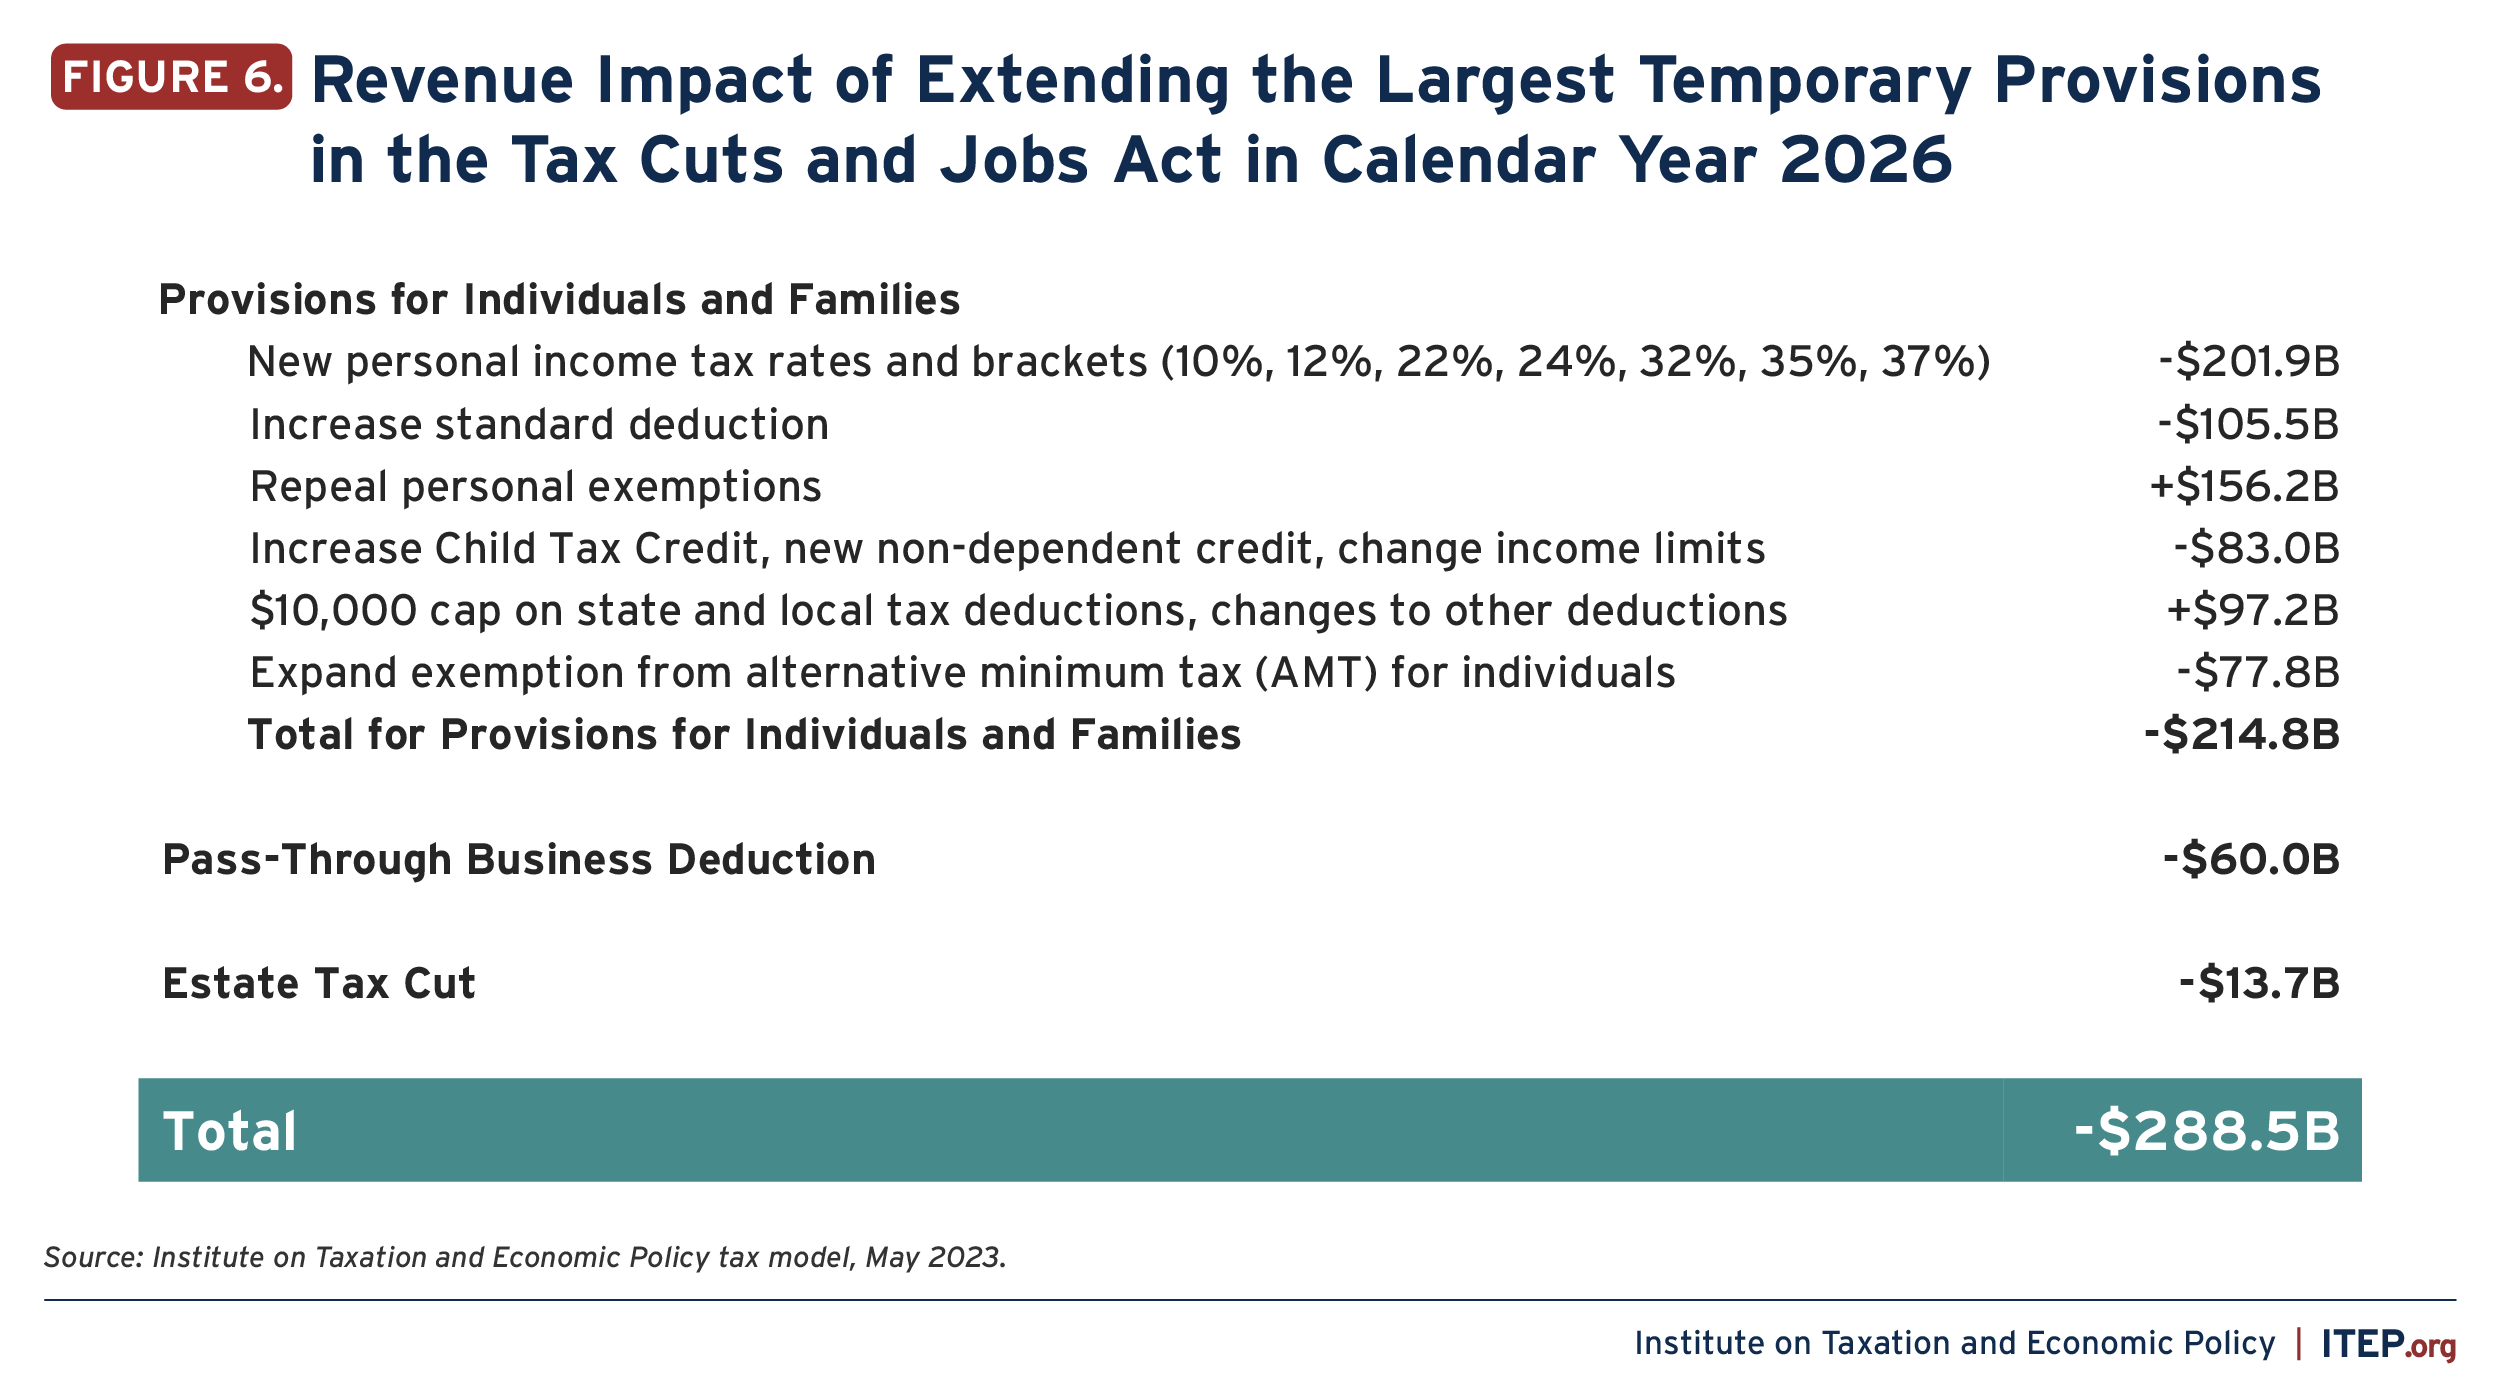
The first category includes provisions for individuals and families, the tax provisions that most Americans think about when they file their taxes. Most of these are tax cuts, including lower tax rates, increased standard deduction and child credits, and a larger exemption from the Alternative Minimum Tax. But some of these provisions raise revenue to partly offset the cost of the tax cuts, including the repeal of personal exemptions and the $10,000 cap on deductions for state and local taxes (SALT).
The second category includes the major provision affecting business owners: a 20 percent deduction for income from pass-through businesses. These businesses do not pay corporate income tax and instead their profits are “passed through” to the individual owners and reported on their personal income tax returns.
The third category includes the 2017 law’s cut in the estate tax. Even before the law was enacted, only 0.2 percent of people could expect that their estates would be large enough to be subject to the tax.[3] Nonetheless, Congress decided to further shrink the estate tax in the 2017 law, doubling the amount of assets exempt from the tax so that today the basic exemption is nearly $13 million for unmarried individuals and nearly $26 million for married couples.
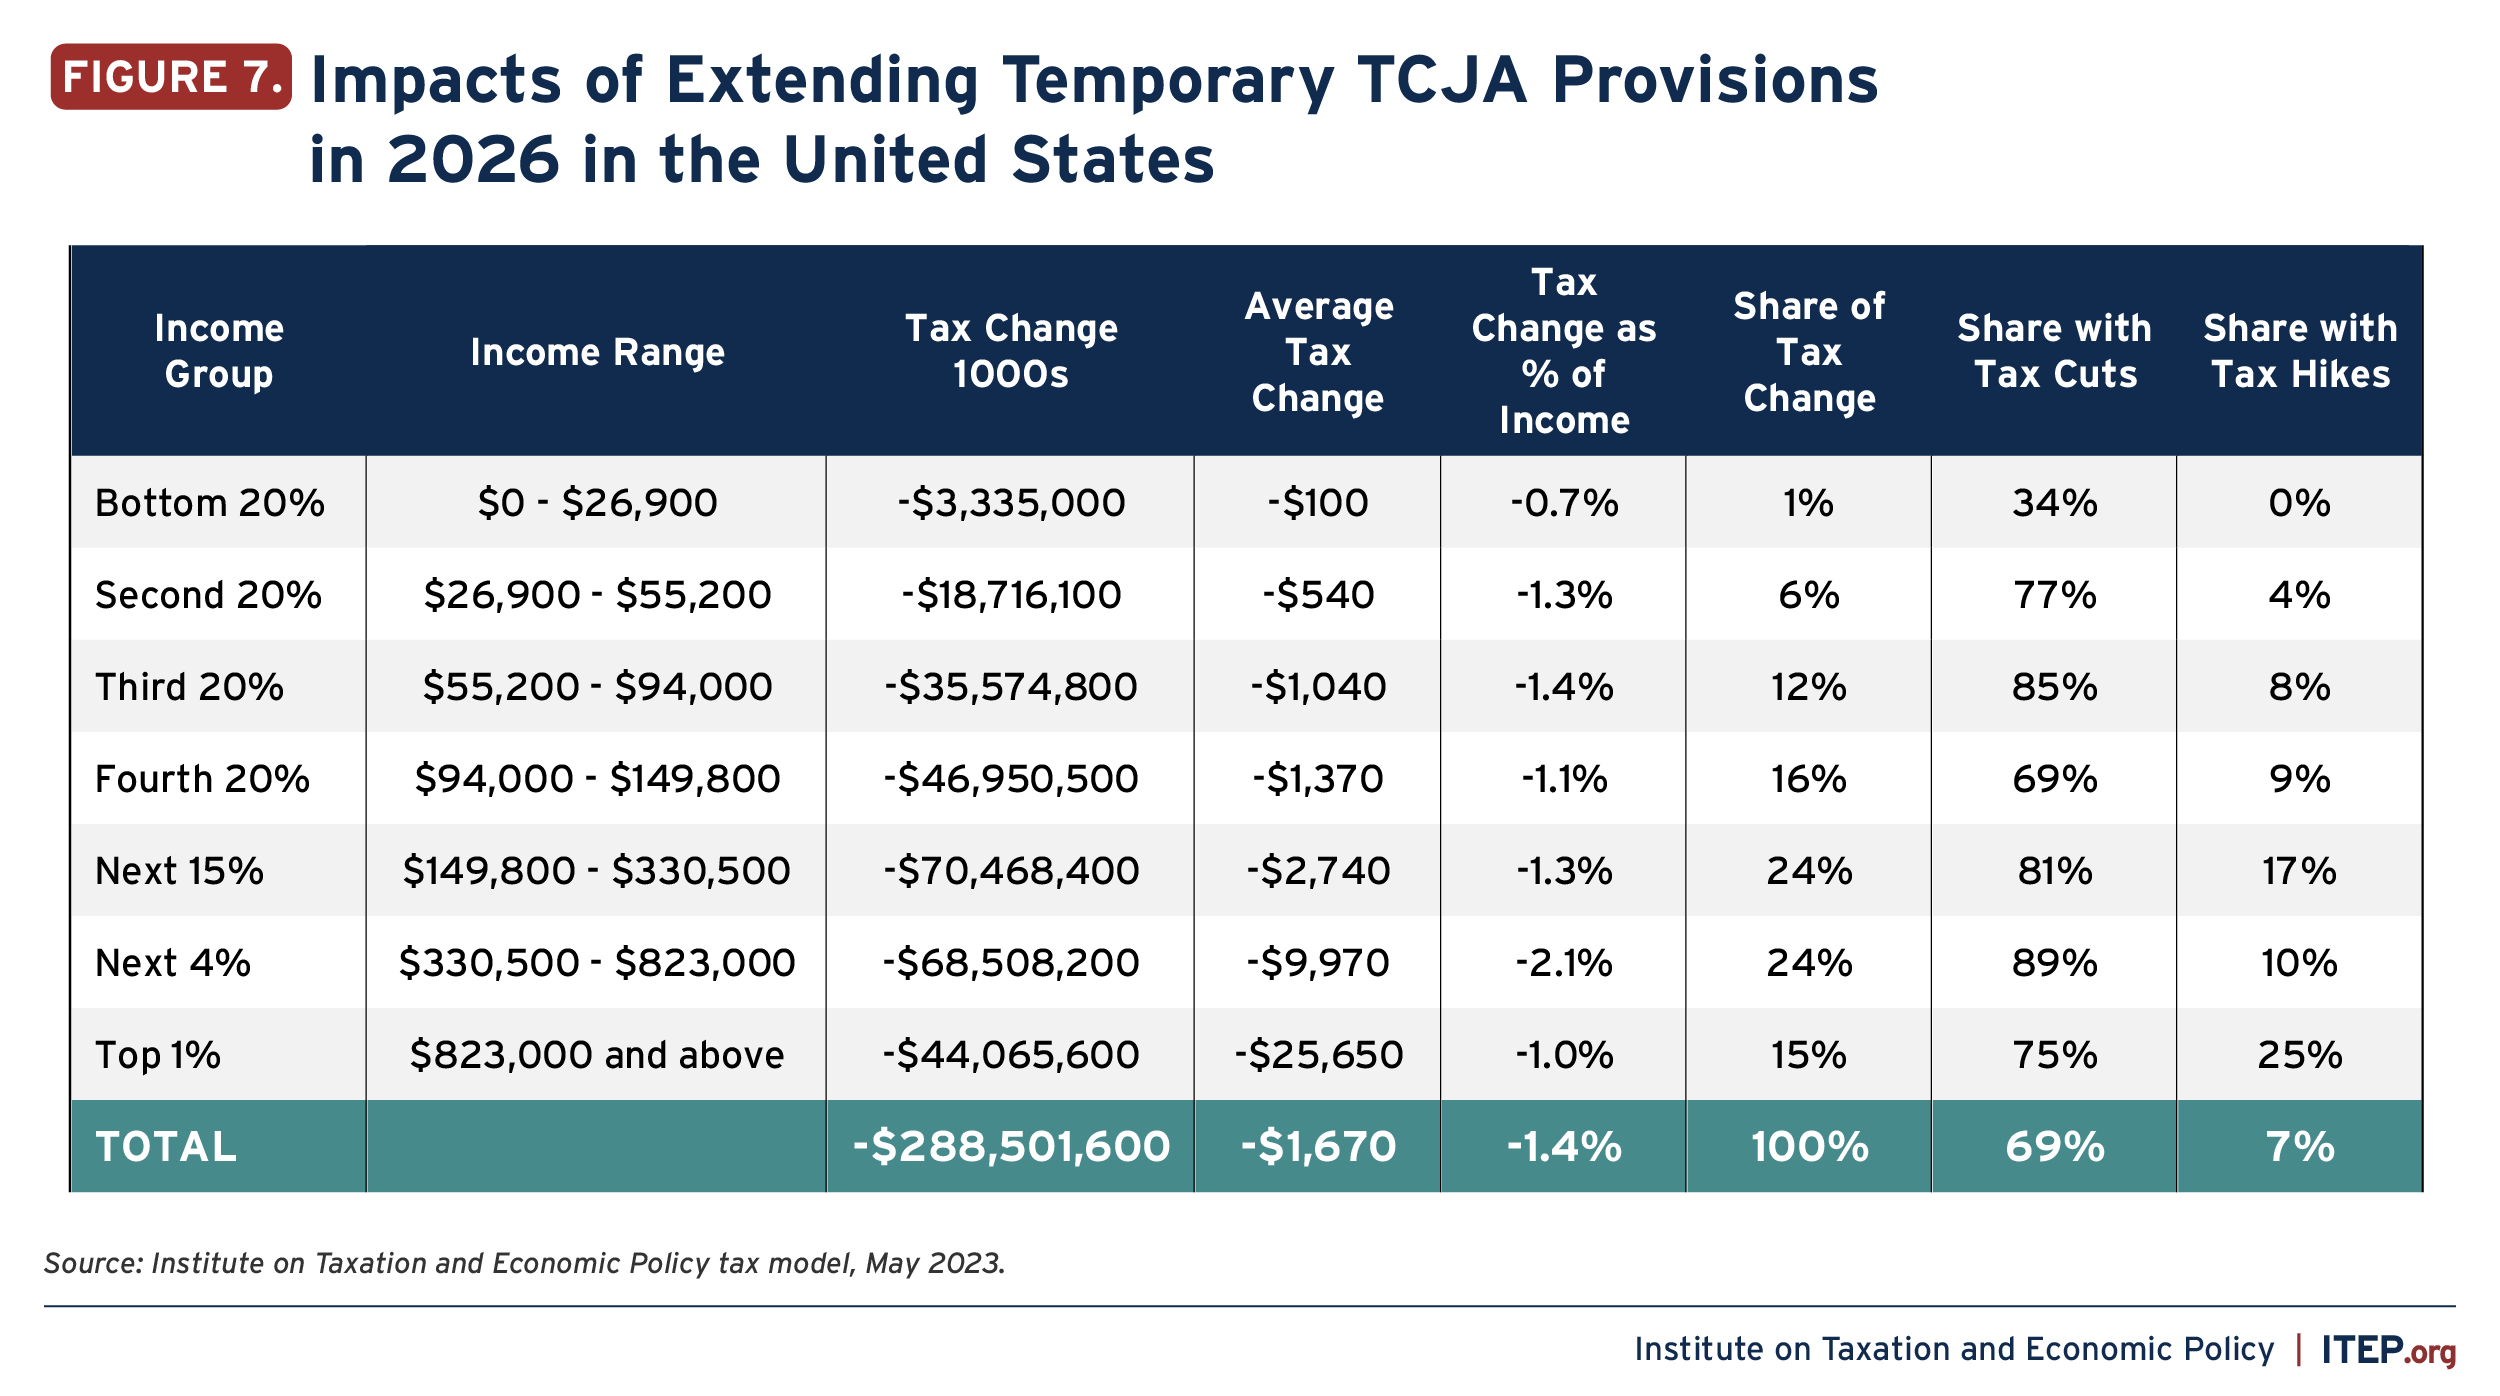
On average, making these expiring provisions permanent would provide the greatest benefit to the richest Americans. As shown in Figure 7, the poorest 20 percent of Americans would receive $3.3 billion in tax breaks in 2026, which would be just 1 percent of the total $288.5 billion in tax breaks that year. This group would receive an average tax break of just $100. Meanwhile, the richest 1 percent of Americans would receive $44.1 billion in tax cuts, 15 percent of the total, and an average tax cut of nearly $26,000.
The precise effects for taxpayers in different situations would vary a great deal in ways that are difficult to convey using estimated averages. For example, low- and middle-income people would benefit more if they have children who qualify for the expanded Child Tax Credit.
And while most high-income taxpayers would pay lower taxes, not all would. As shown in Figure 7, 75 percent of taxpayers among the richest 1 percent would receive a tax cut, but the other 25 percent of this group would face a tax hike. This would happen mainly because of the extension of the $10,000 cap on state and local taxes (SALT), which particularly affects residents of high-tax states like California, Maryland, New Jersey, New York, and others.
Figure 8 breaks the tax changes into the three categories: individuals and families, pass-through businesses, and estate tax.
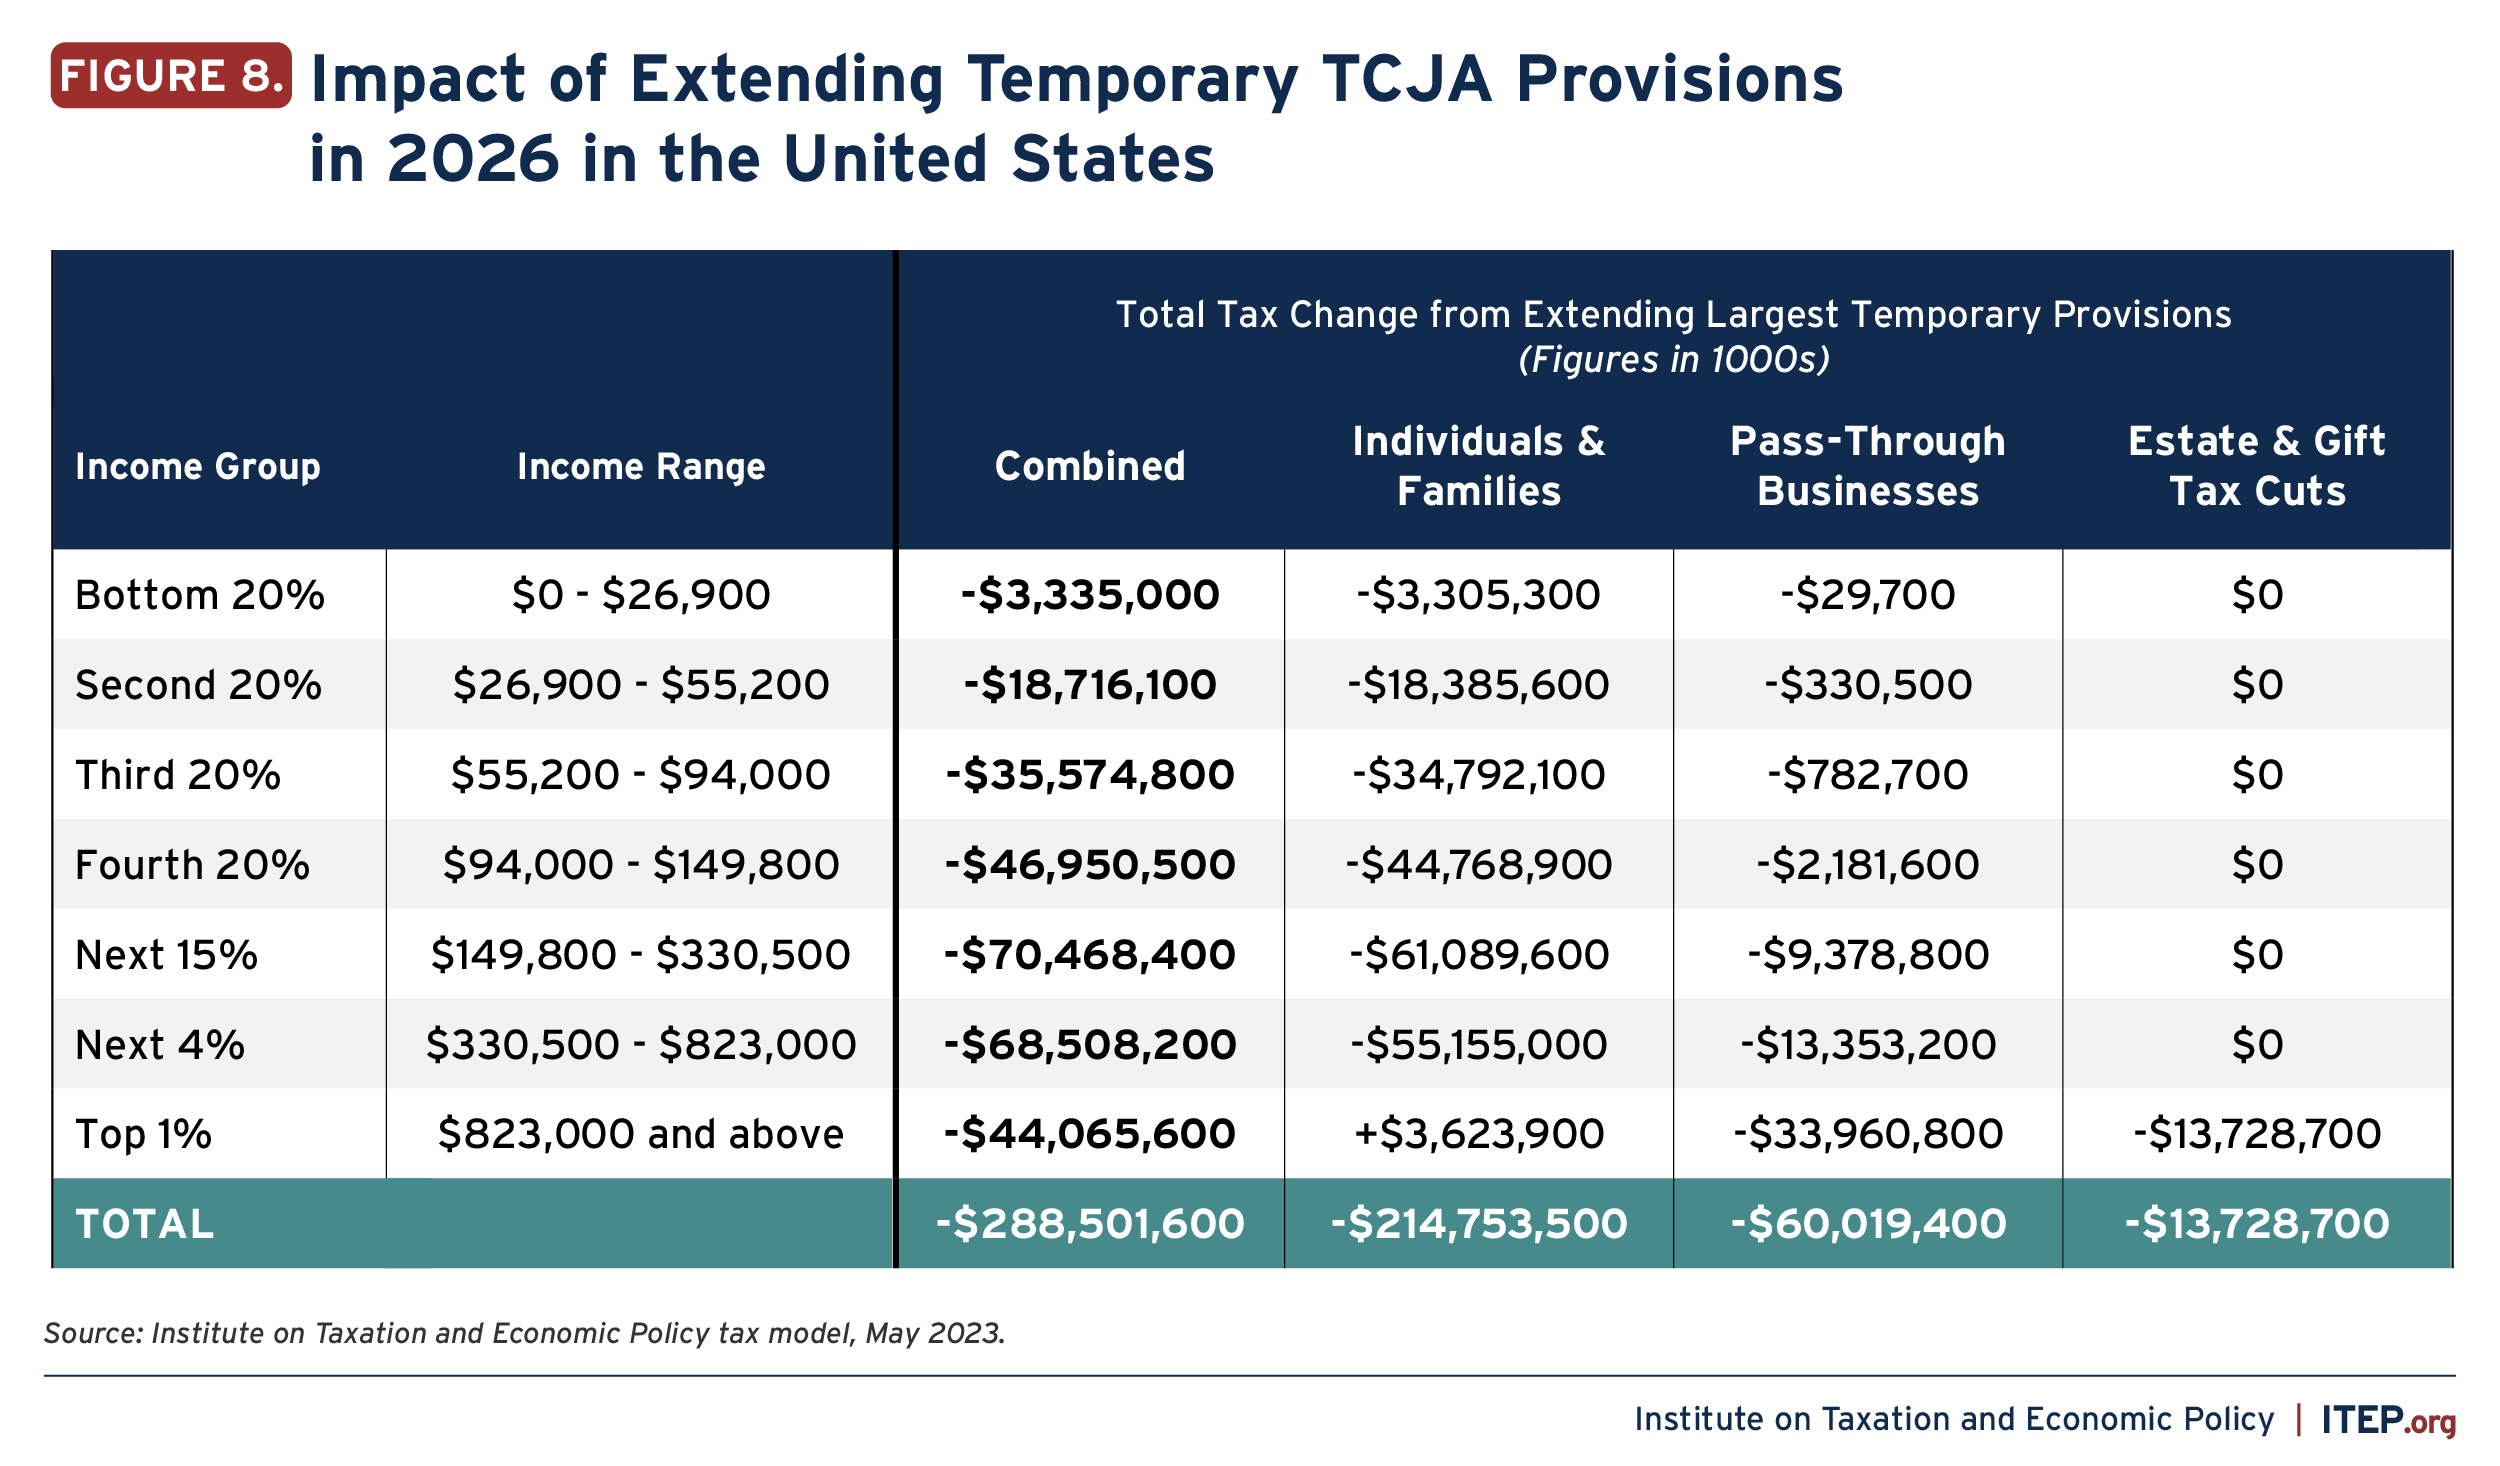
For the top one percent, the net effect of the individuals and families provisions would be a tax increase of $3.6 billion in 2026 because this category includes the cap on SALT deductions that restricts tax breaks for well-off taxpayers more than anyone else. However, the pass-through business deduction would reduce taxes for the richest 1 percent by $34 billion and the estate tax cut would reduce taxes for this group by another $13.7 billion. The TCJA Permanency Act would therefore have the net effect of lowering taxes by $44.1 billion for the richest one percent.
Provisions of the Tax Cut and Jobs Act That Are Already Permanent
Several tax changes in the 2017 law are permanent as enacted. Figure 9 illustrates the revenue impact of the major permanent TCJA provisions in 2026. This report groups the most significant of these permanent provisions into three categories.
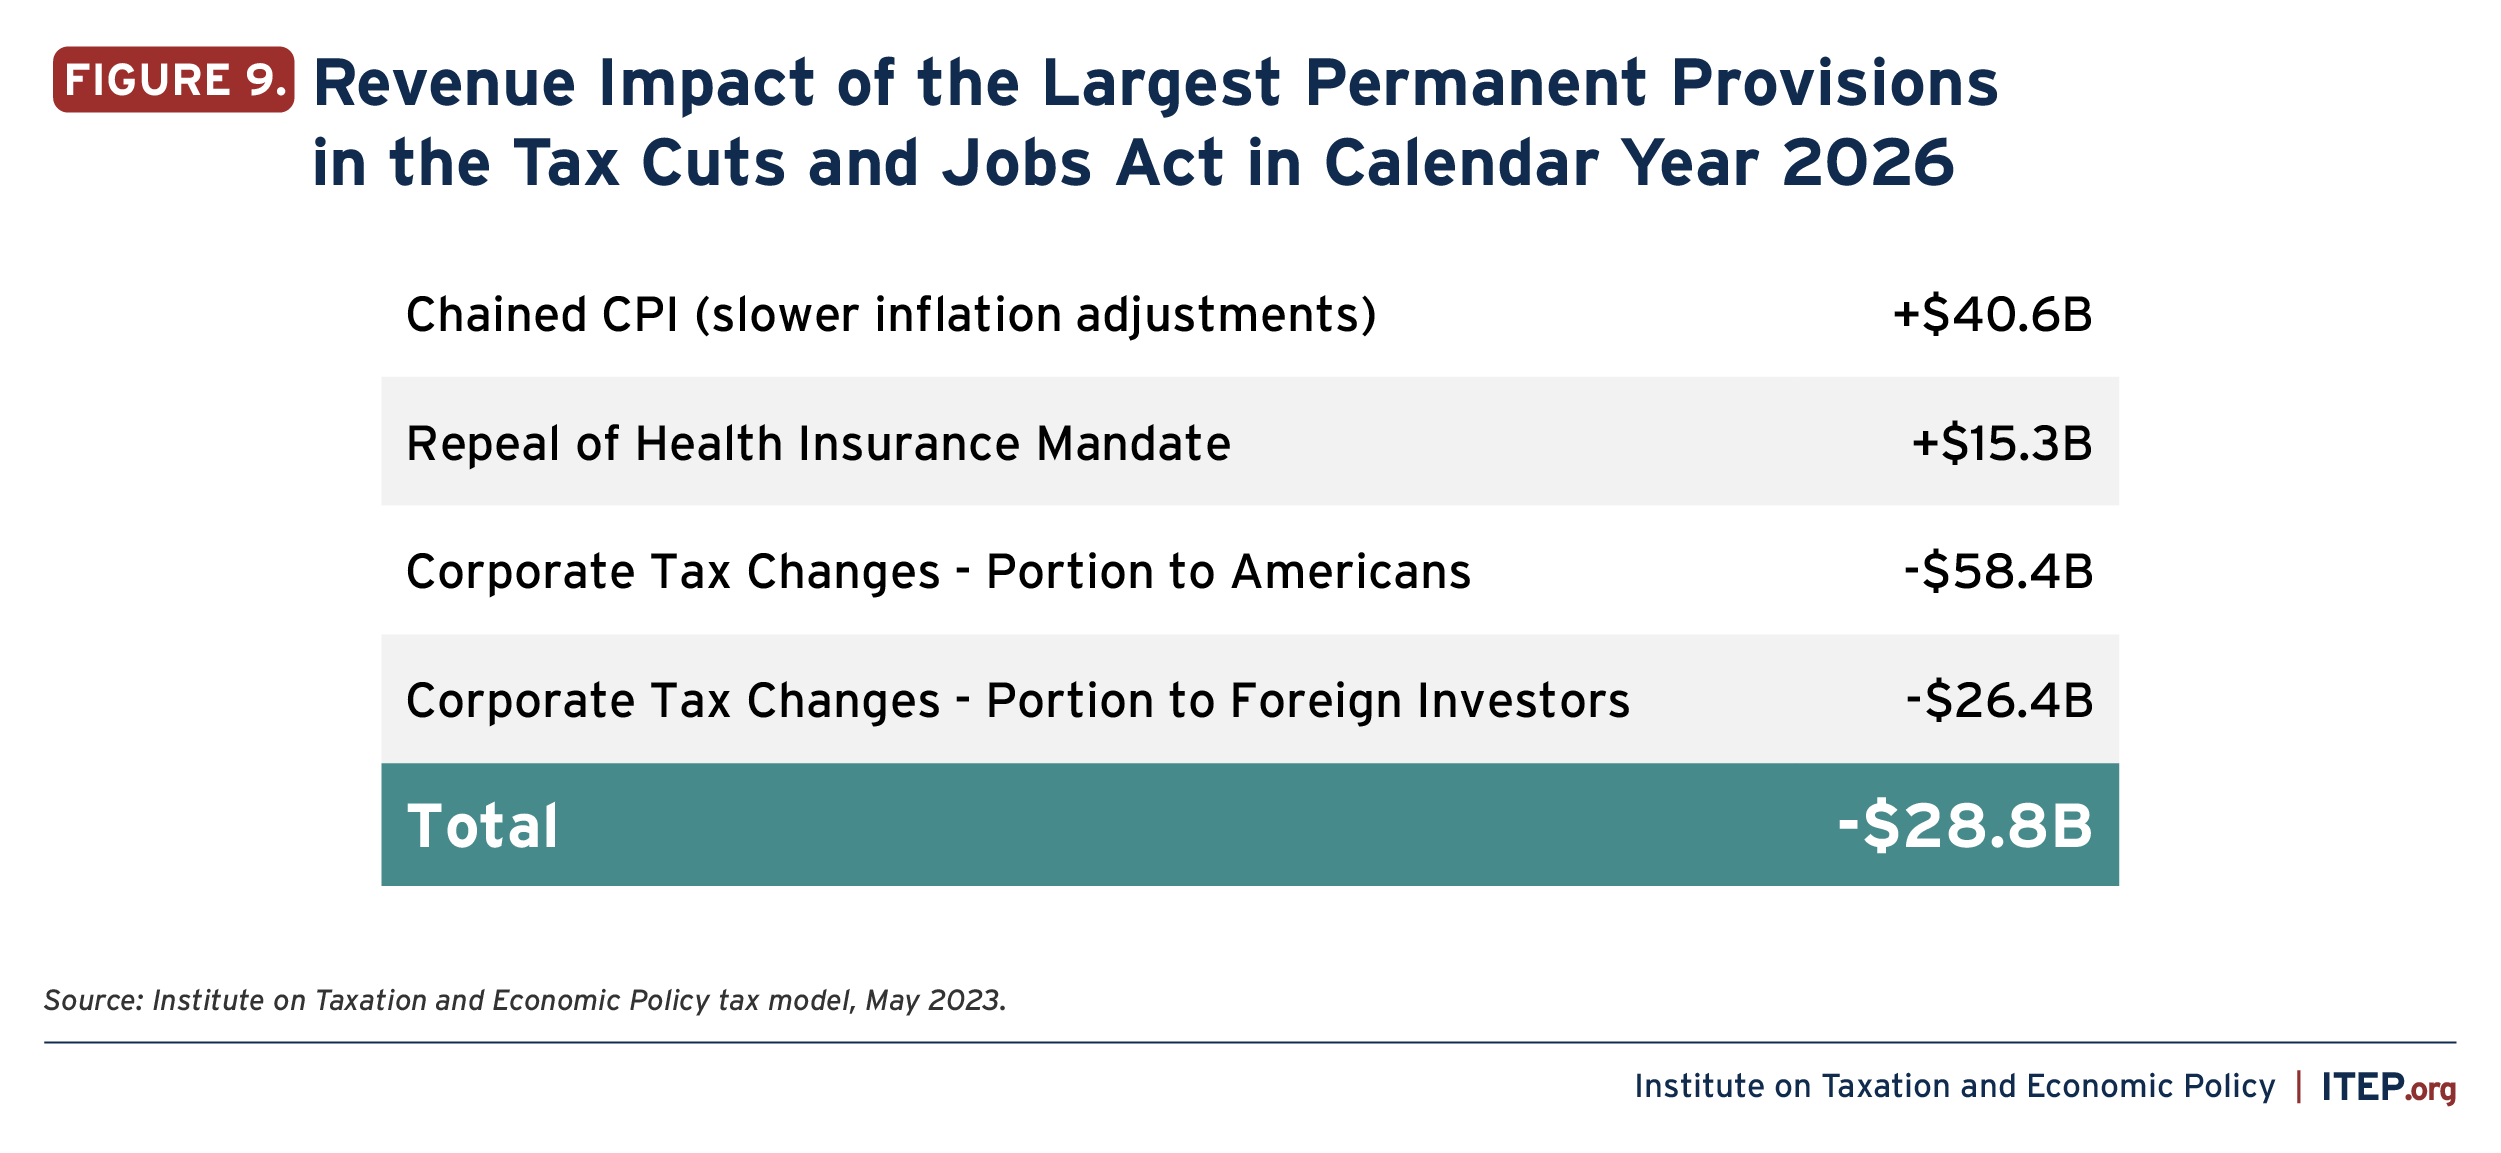
The first is the law’s adoption of a slower inflation adjustment to all the parameters in the tax code (such as tax brackets and the size of certain deductions, exemptions and credits) using what is called the Chained Consumer Price Index. Compared to the law in place before TCJA was enacted, this raises taxes on people in all income groups in 2026 because tax brackets do not rise as much as they would have under the previous inflation adjustment, and the same is true of deductions, exemptions and credits in the tax code that are indexed for inflation.
Second, the law repealed the penalty for individuals failing to obtain health insurance. This report incorporates Congressional Budget Office estimates on how this change would affect taxes. The penalty tax that was imposed on those who do not obtain health insurance was eliminated, which reduced taxes for some. But a larger group of people pay higher taxes because when they go without health insurance, they no longer collect the tax credits that help them pay premiums under the Affordable Care Act.
Third, the law changed corporate income taxes in many ways which have the net result of reducing corporate tax revenue substantially. Economists generally agree that the benefits of corporate tax cuts initially go to those who own stocks in American corporations. Recent research has concluded that foreign investors own 40 percent of stocks in American corporations and would therefore receive a significant share of the benefits from corporate tax cuts.[4] The 2017 law is projected to reduce corporate tax revenue by $84.8 billion in 2026, but $26.4 billion of that total would flow to foreign investors, which leaves a $58.4 billion corporate tax break benefiting Americans.
Many economists believe that some of the benefits of a corporate tax cut go, over time, to workers in the form of higher wages. It is very unclear when or if this would ever happen. But ITEP follows the approach of Congress’ official revenue estimator, the Joint Committee on Taxation, in assuming that a share of the benefits from a corporate tax cut will eventually go to workers, and that share will gradually grow to one-fourth of the total benefits in the tenth year after enactment.[5] But this does not change the fact that the corporate tax cuts provide the richest taxpayers with the greatest benefits.[6]
As shown in Figure 10, these changes result in a net tax hike for the bottom 80 percent of Americans. For these taxpayers, the tax increases from the slower inflation adjustment and the repeal of the health insurance penalty are not offset by the corporate tax cuts, which flow mostly to the richest 20 percent of Americans.
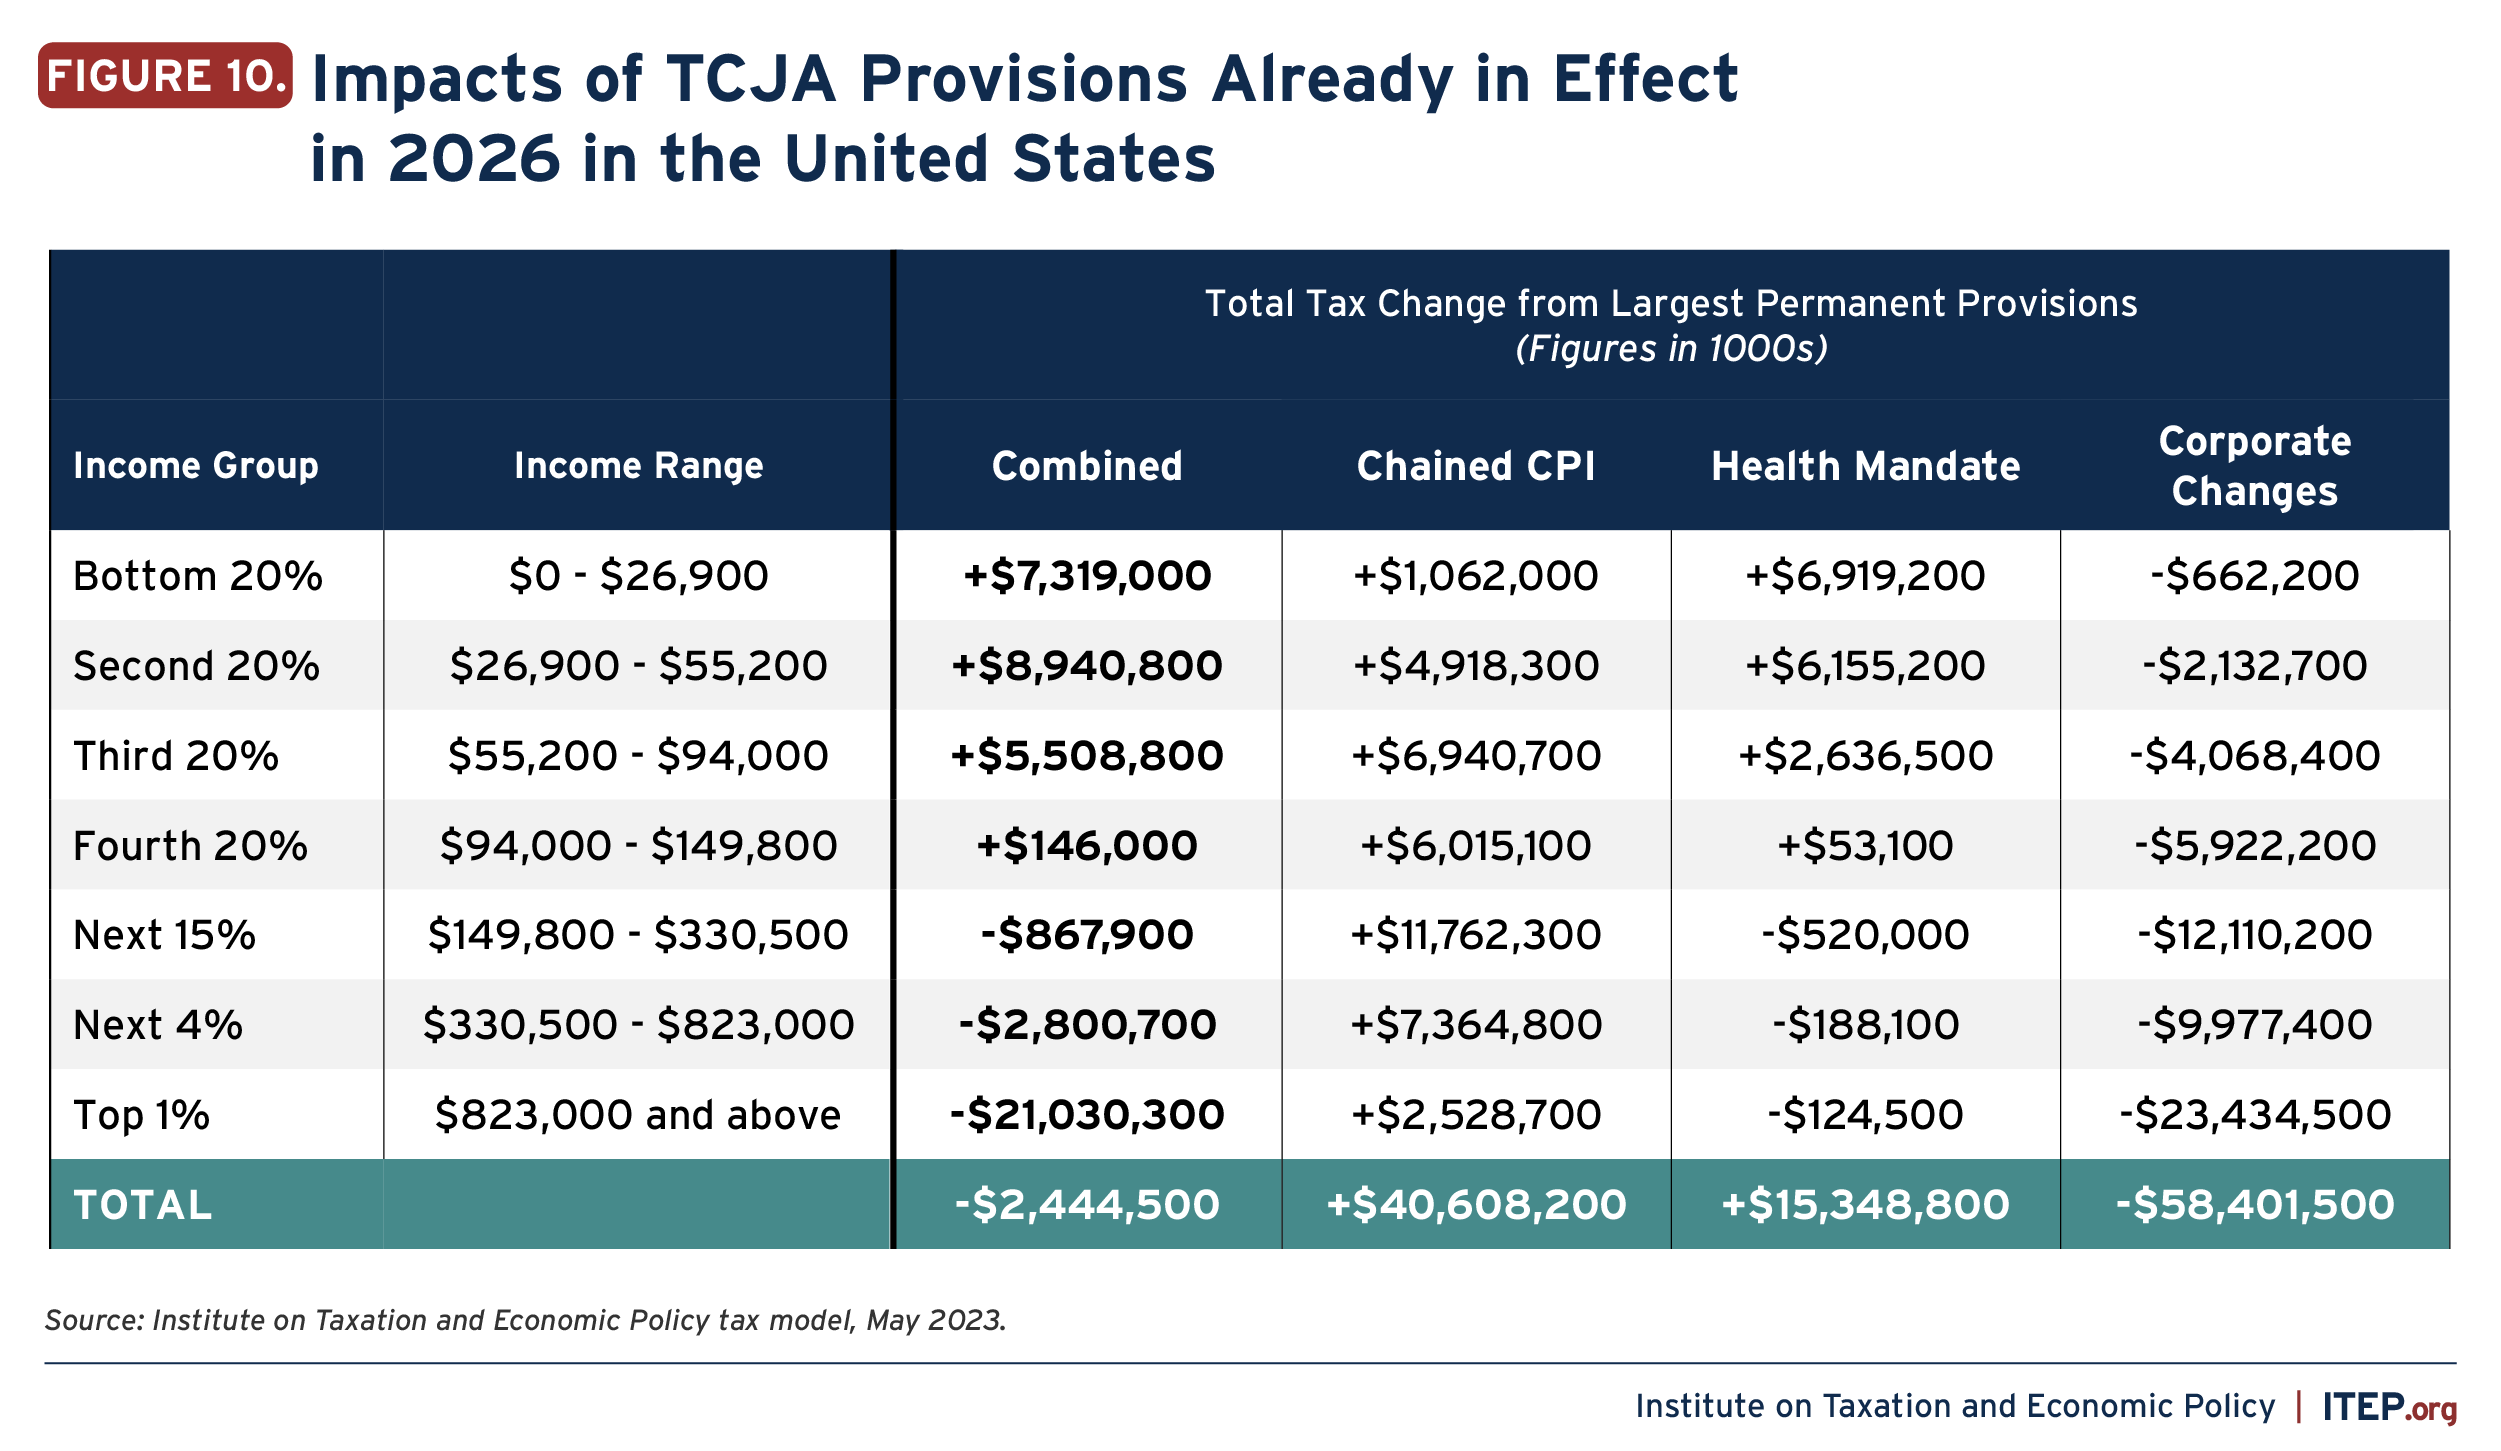
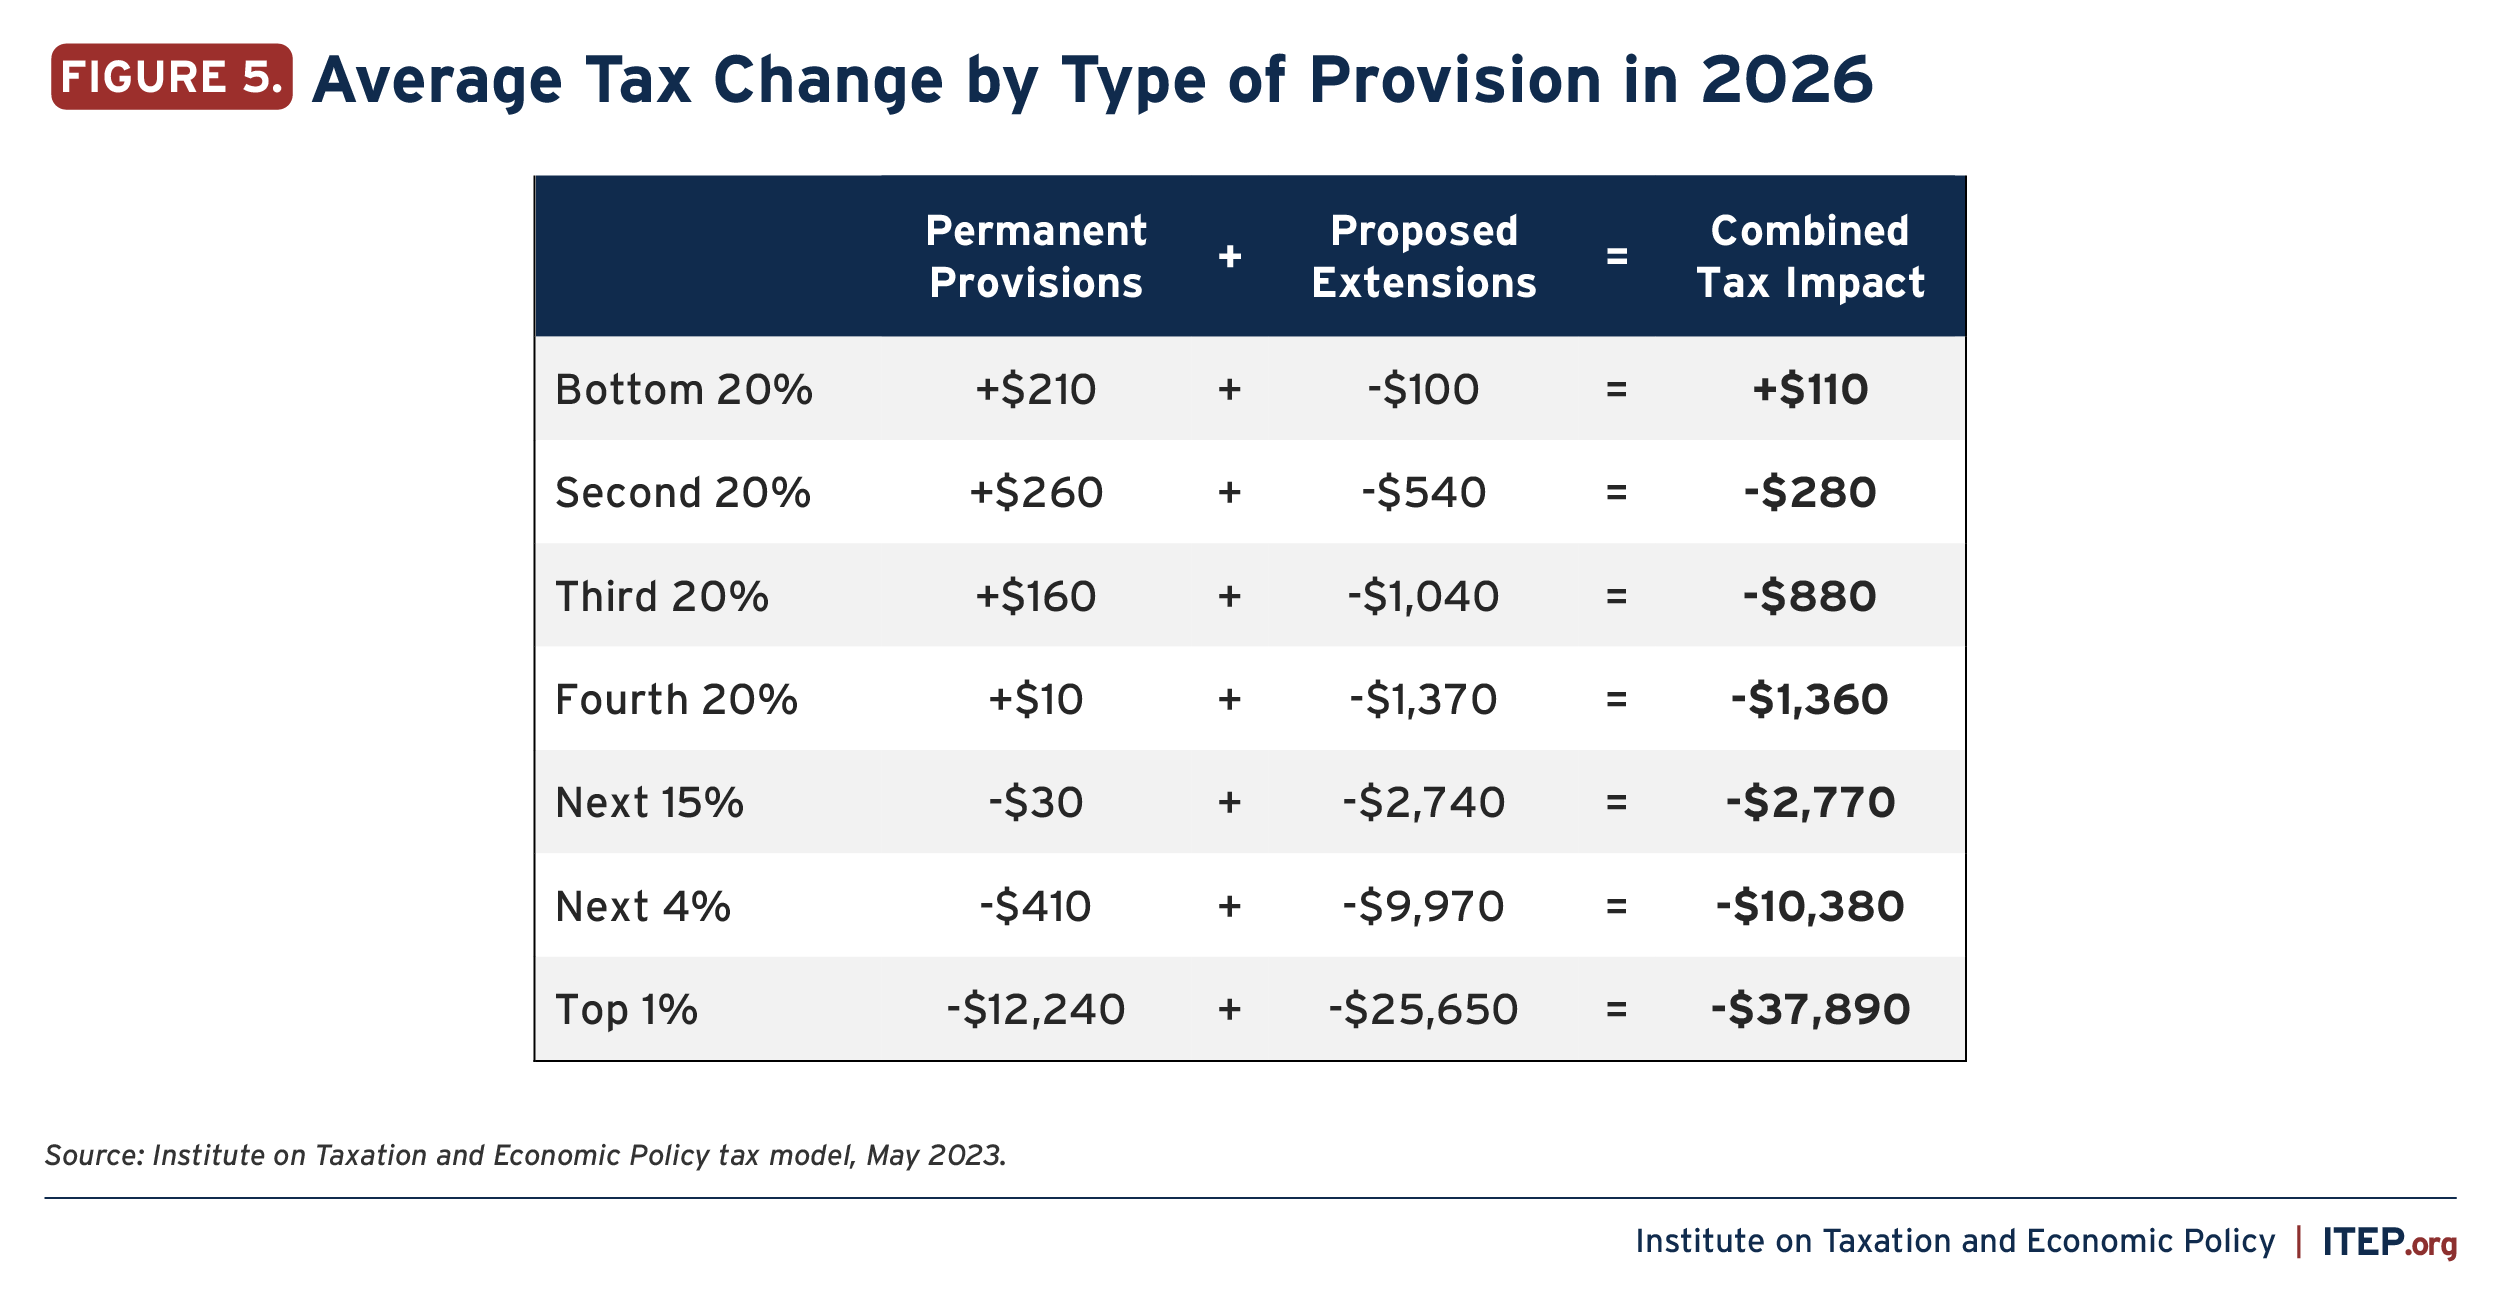
Figure 5 from earlier in this report is shown again below to illustrate the combined effects of the portions of the 2017 tax law that are already permanent and the proposed extensions of temporary changes. The poorest 20 percent of Americans will still receive a tax hike from TCJA even if the temporary provisions are extended. Extending the temporary provisions would benefit this group, but not enough to offset the tax hike that results from the permanent ones.
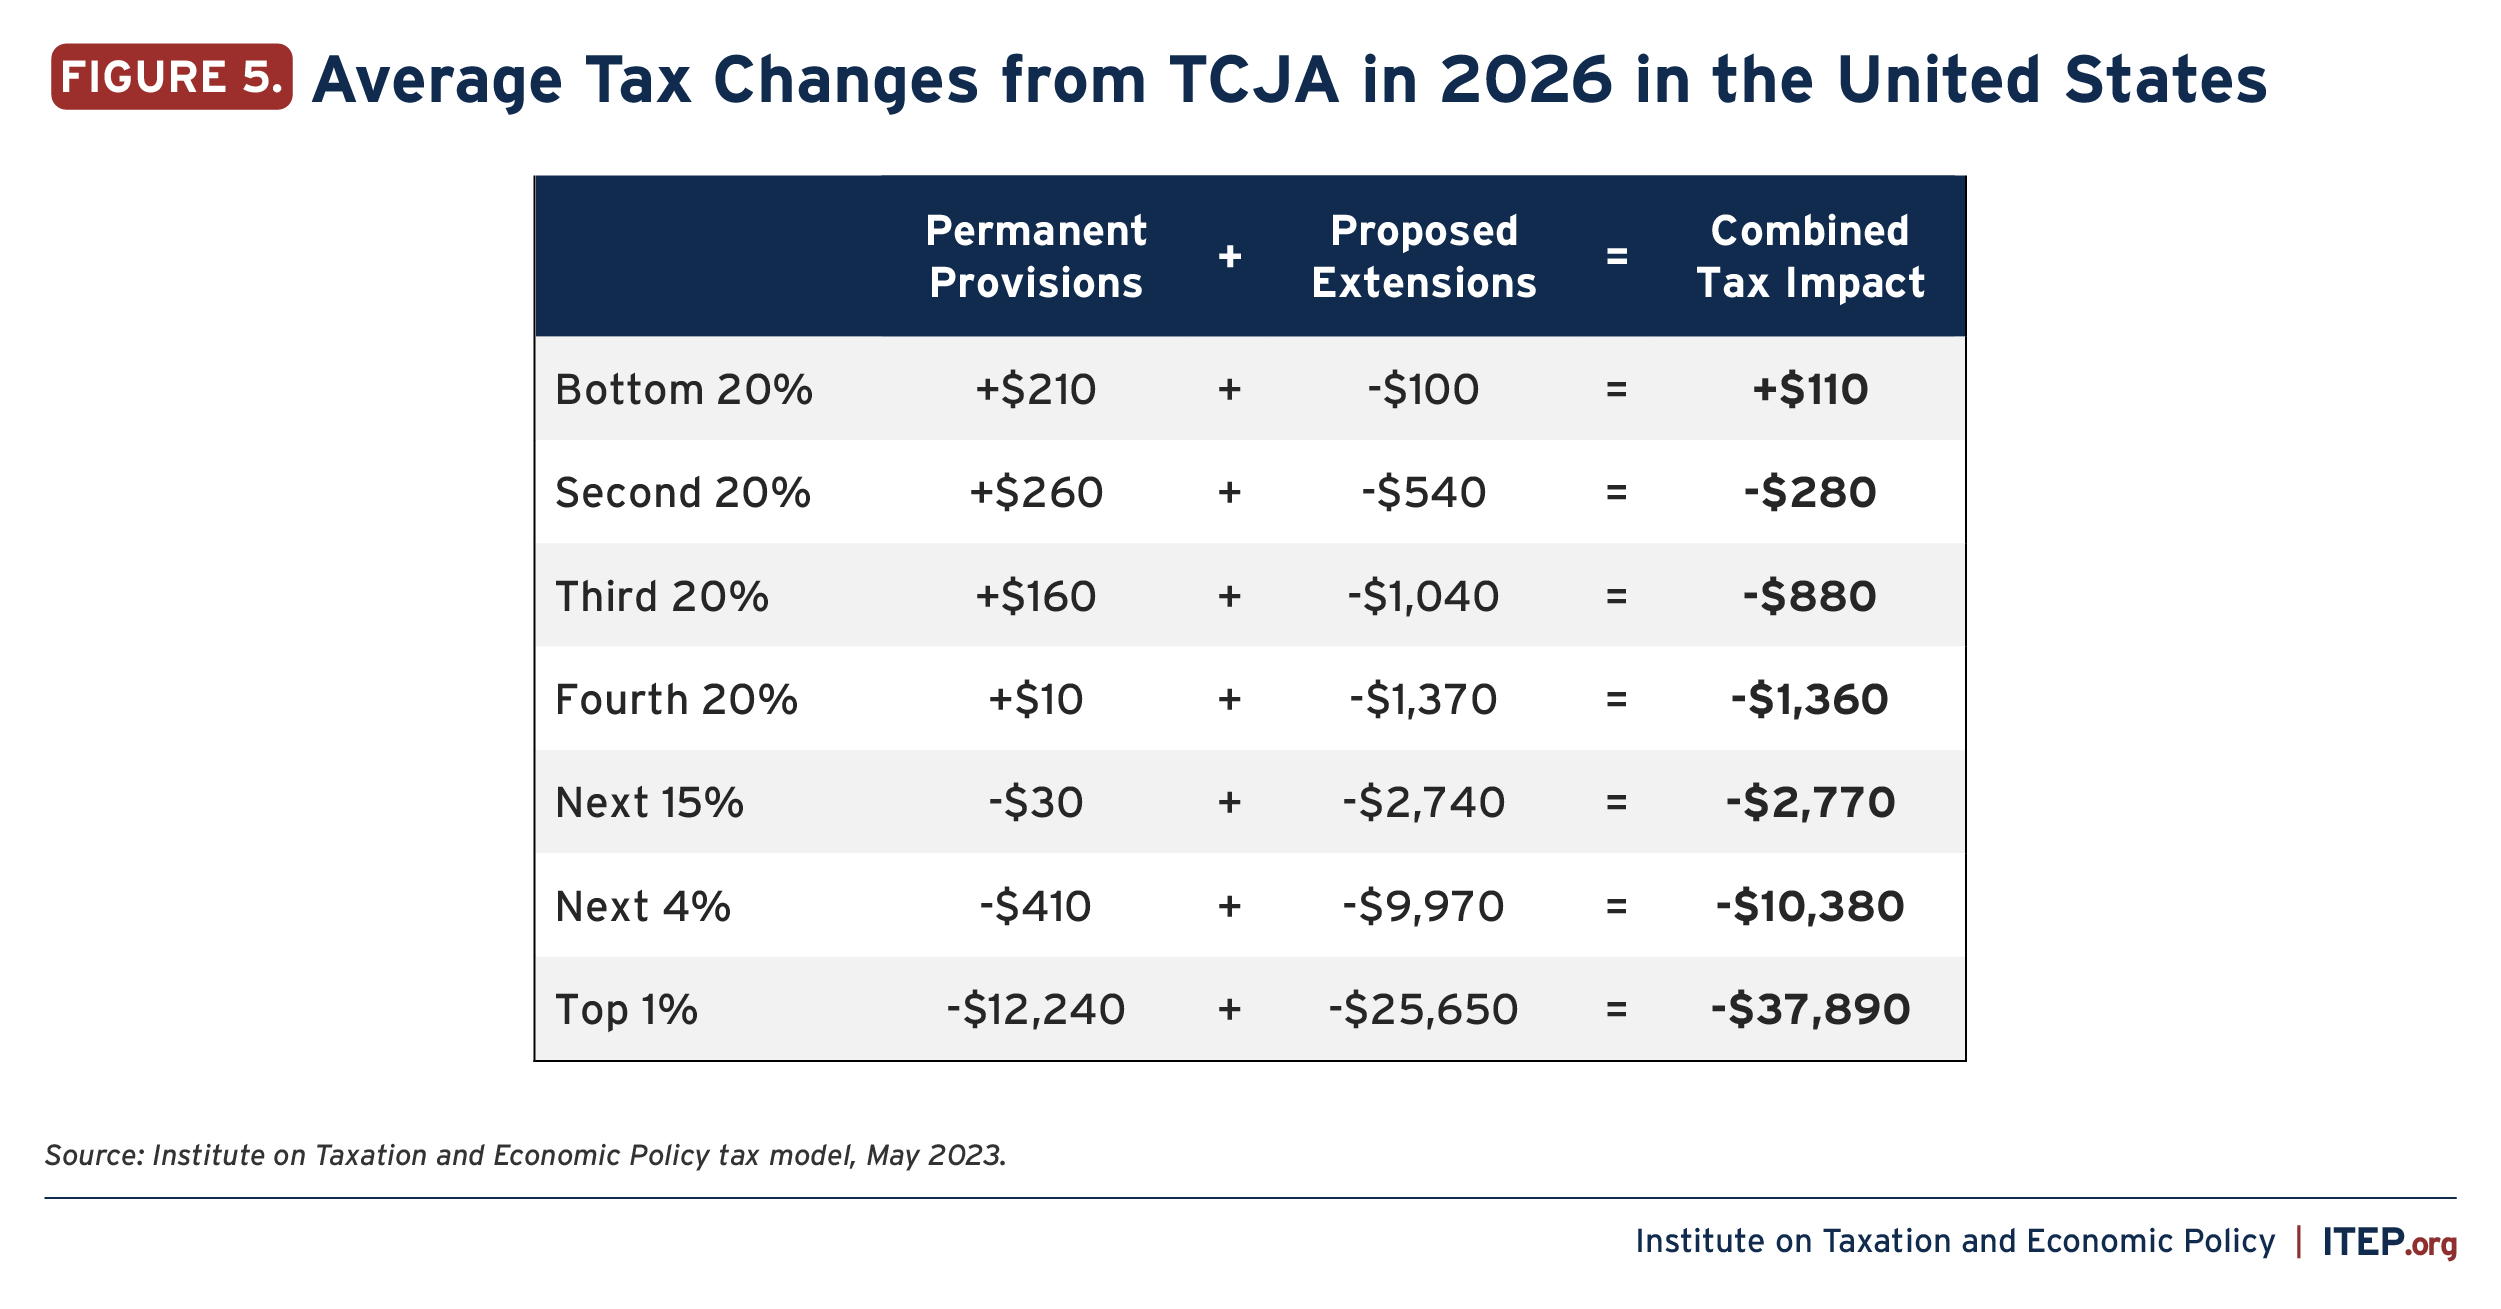
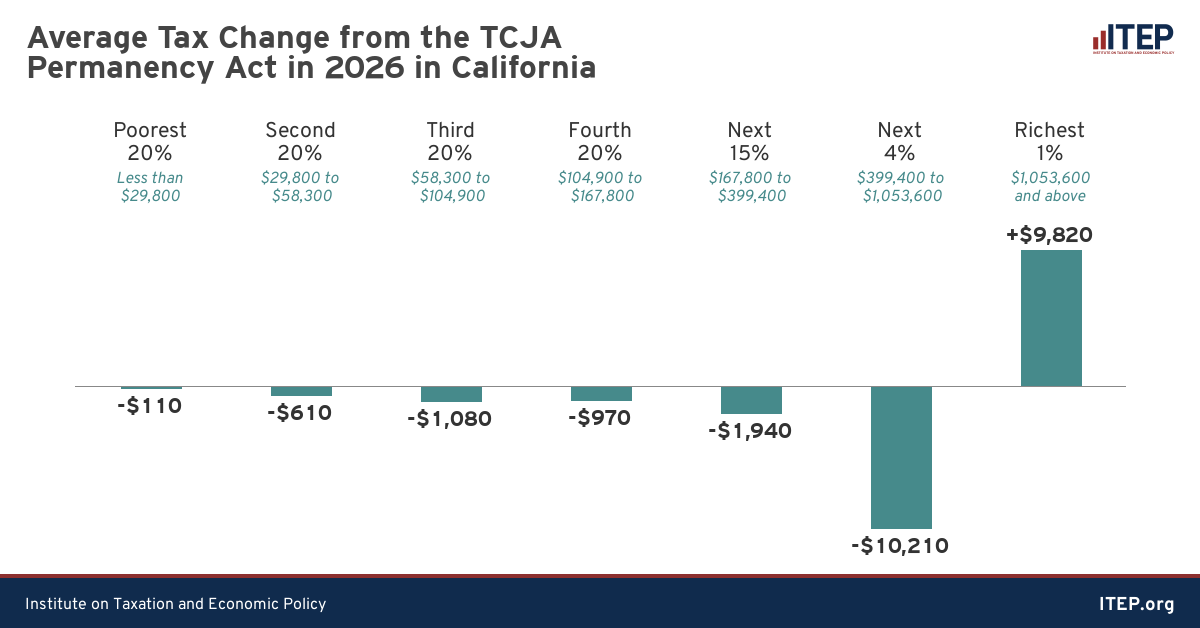
These numbers vary a great deal by state, as illustrated in the data available for download. For example, extending the temporary TCJA provisions would have the overall effect of raising taxes for the richest 1 percent of Californians. (This occurs because high-income Californians are particularly affected by the $10,000 cap on SALT deductions.) However, the corporate tax cuts that are part of the permanent TCJA provisions would more than offset these tax hikes for this group, meaning TCJA as a whole package is still beneficial to that state’s richest residents.
The 2017 tax law’s changes, both permanent and temporary provisions taken together, illustrate the vision that the drafters of the Tax Cuts and Jobs Act of 2017 had for America’s tax code.
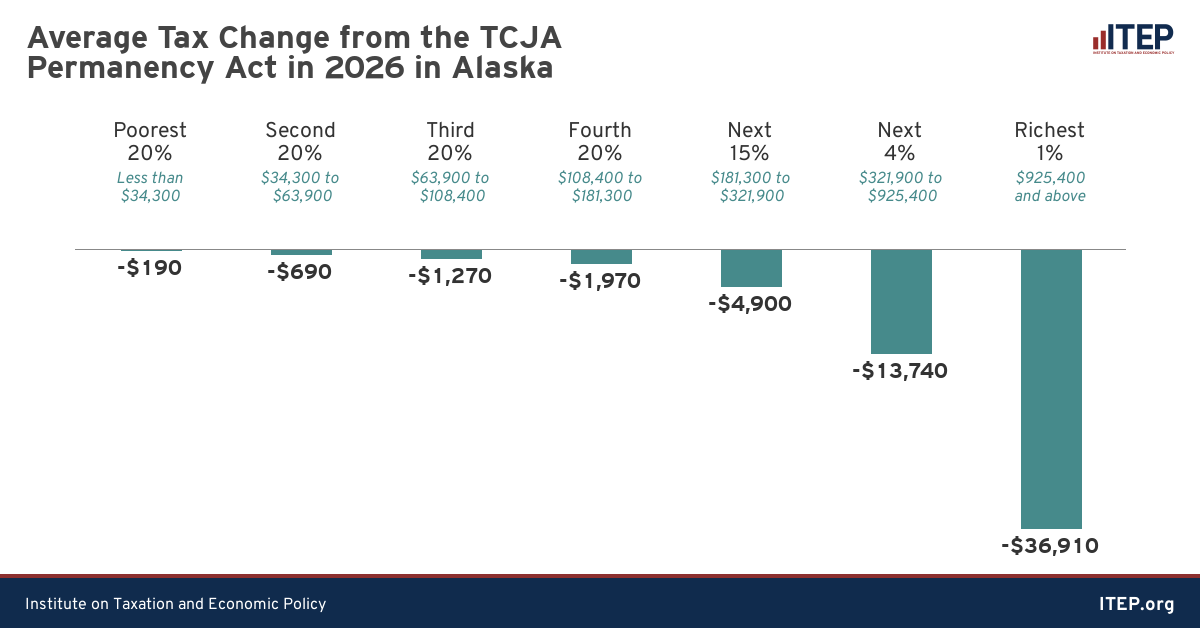
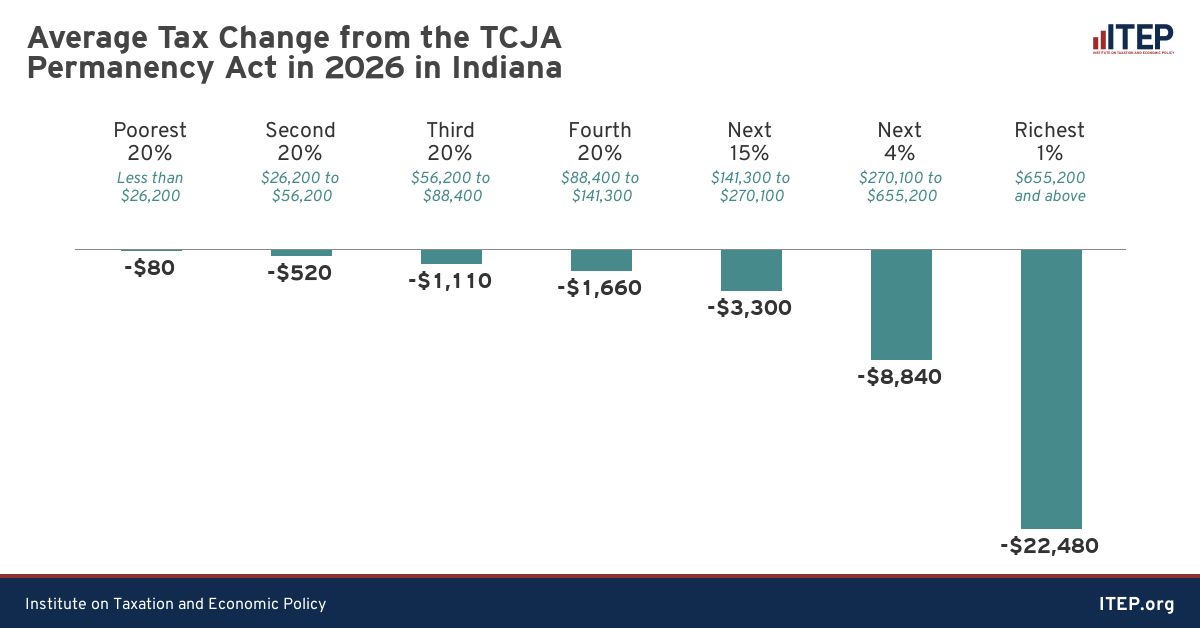
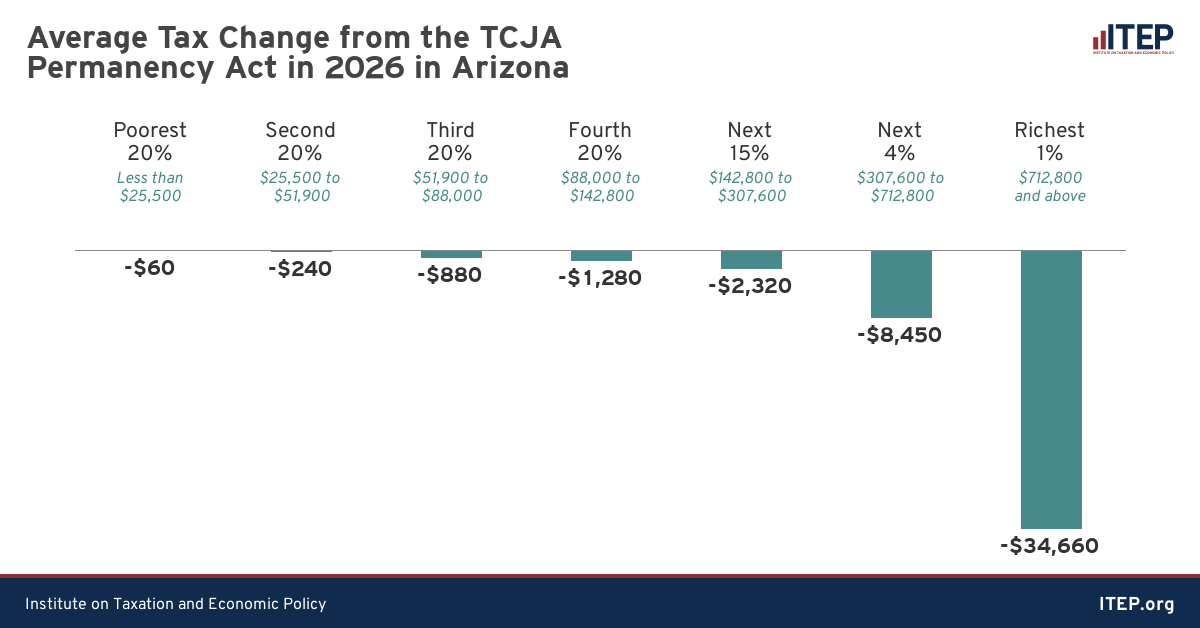
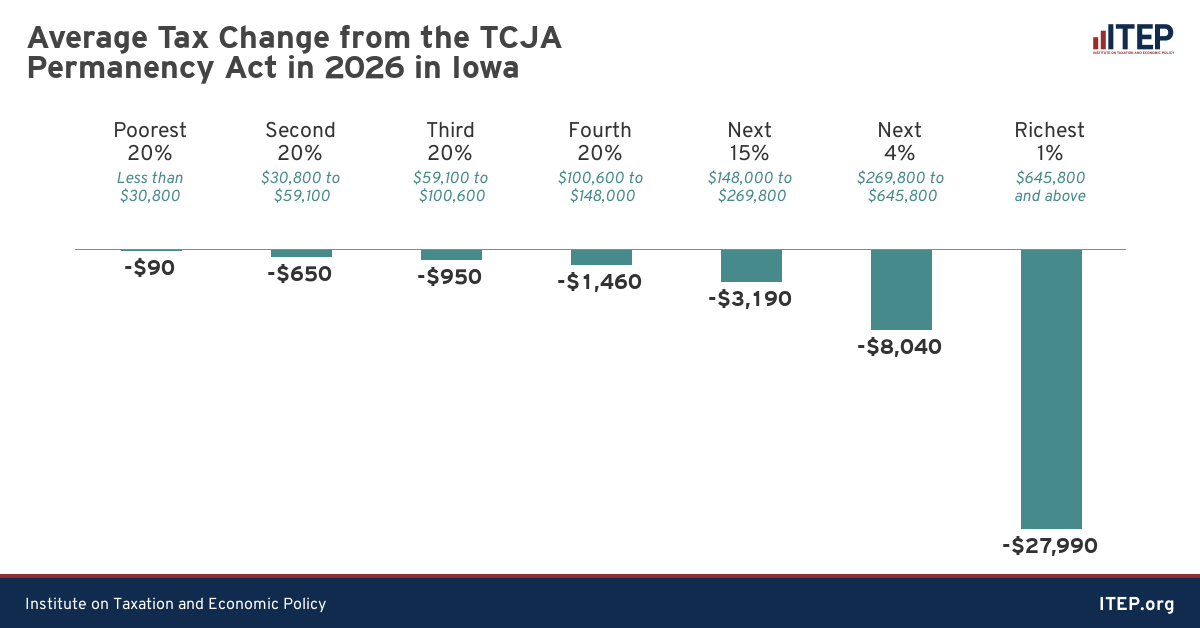
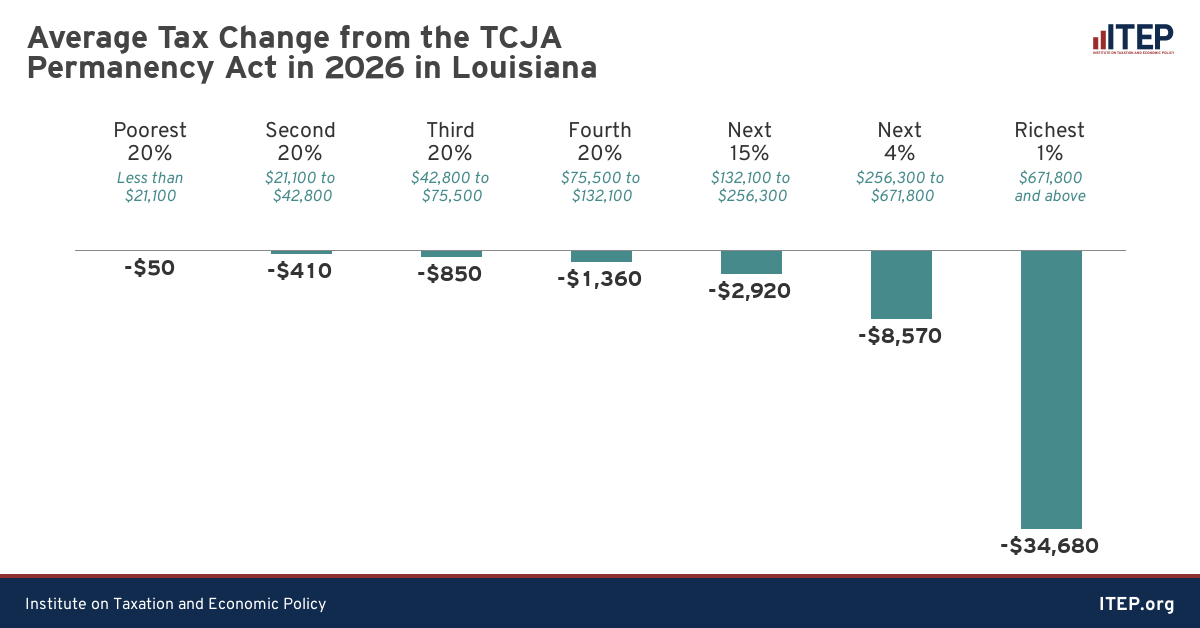
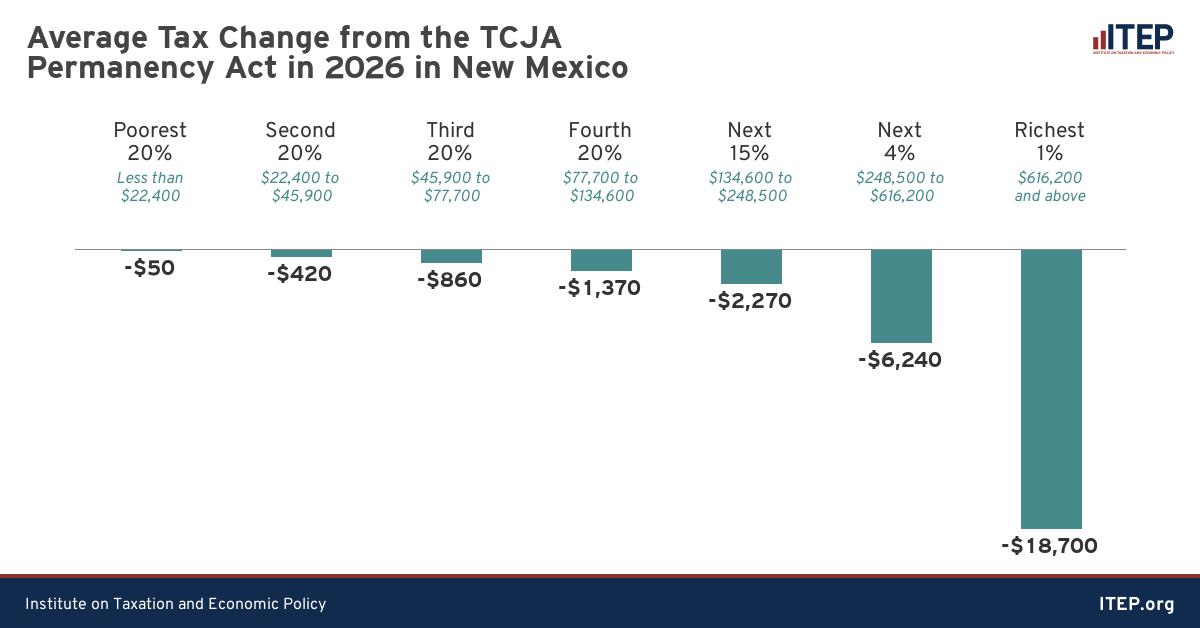
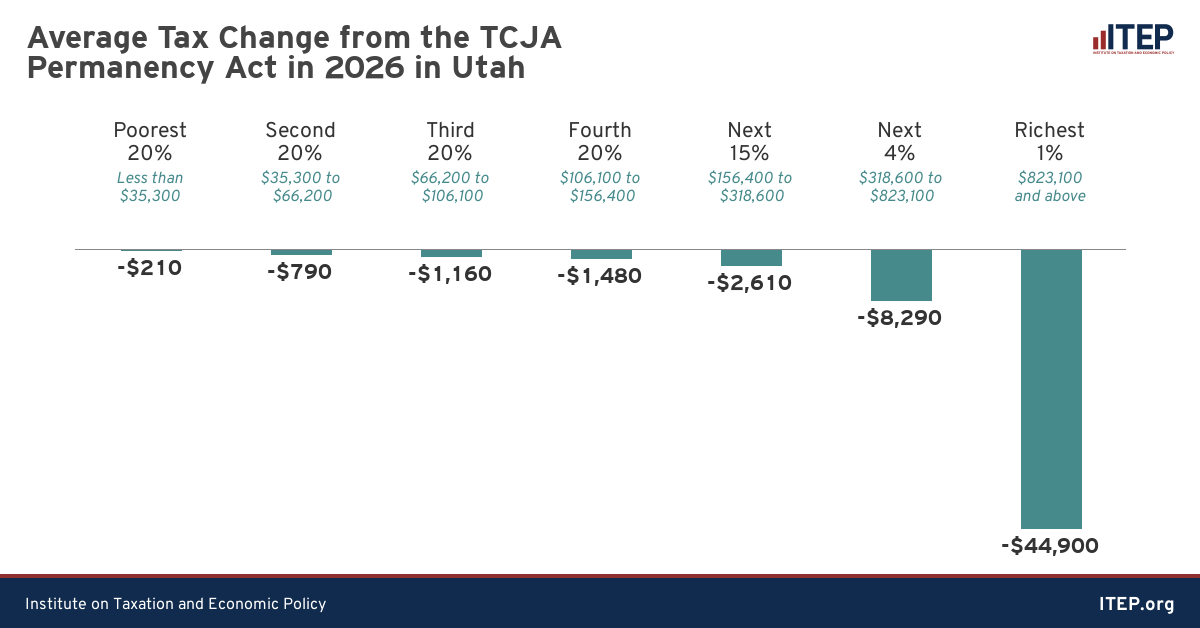
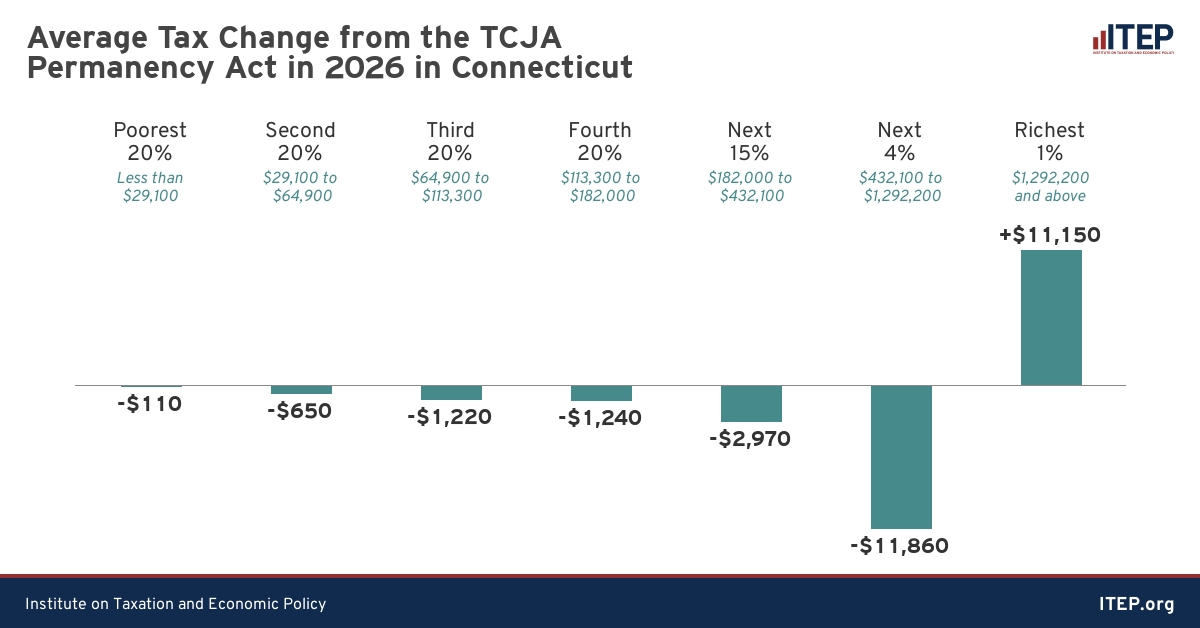
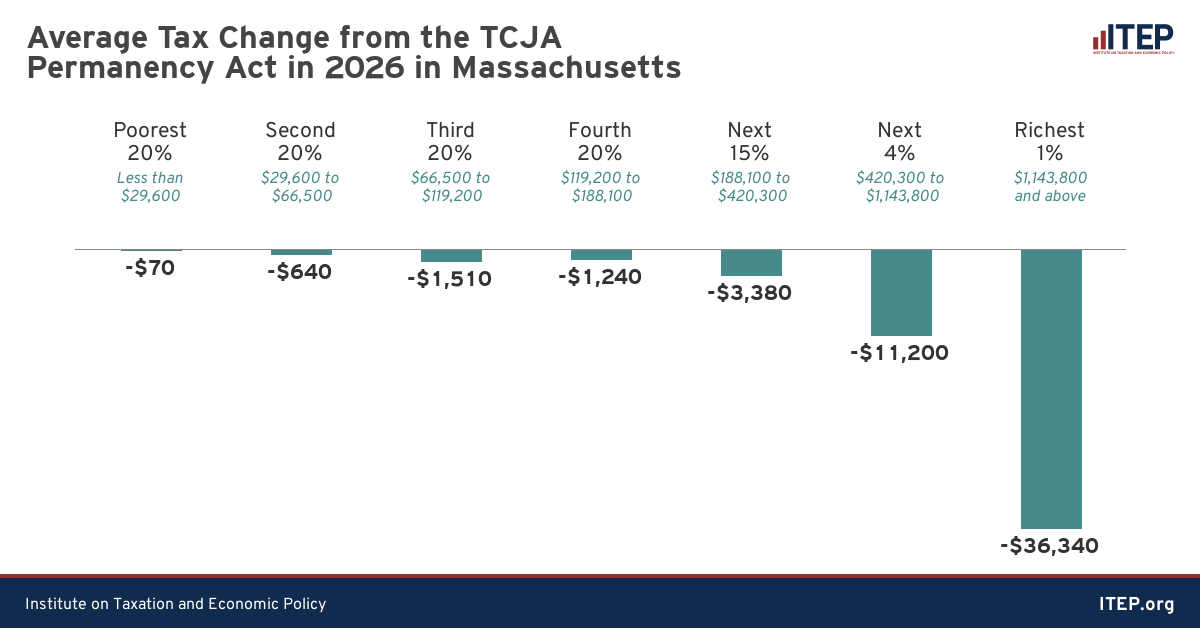
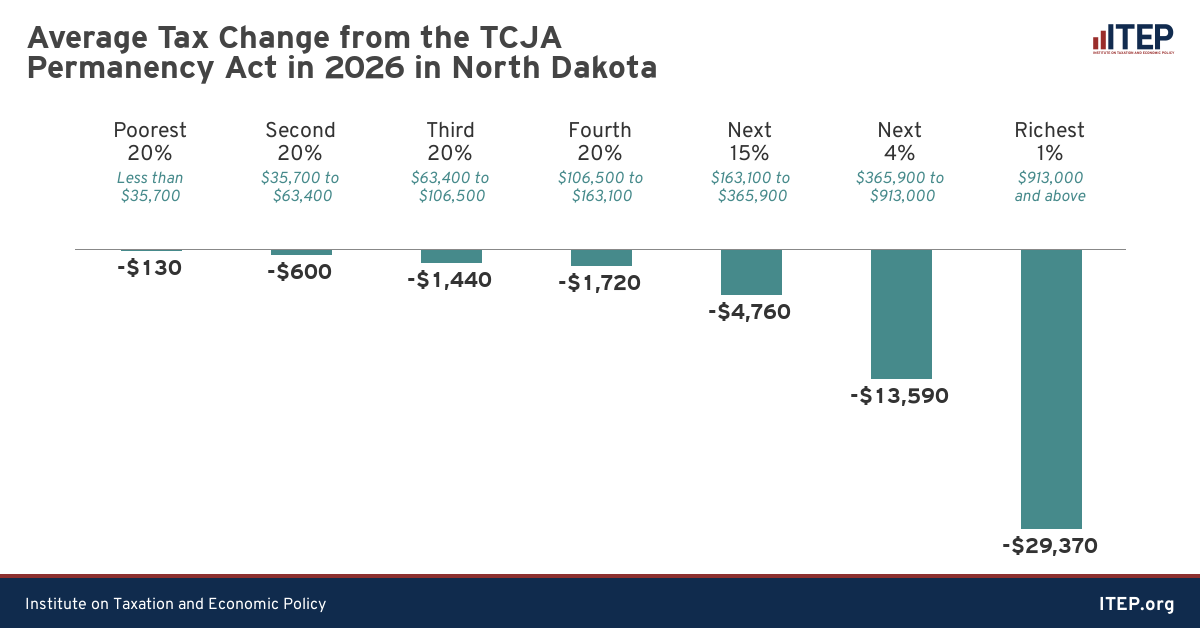
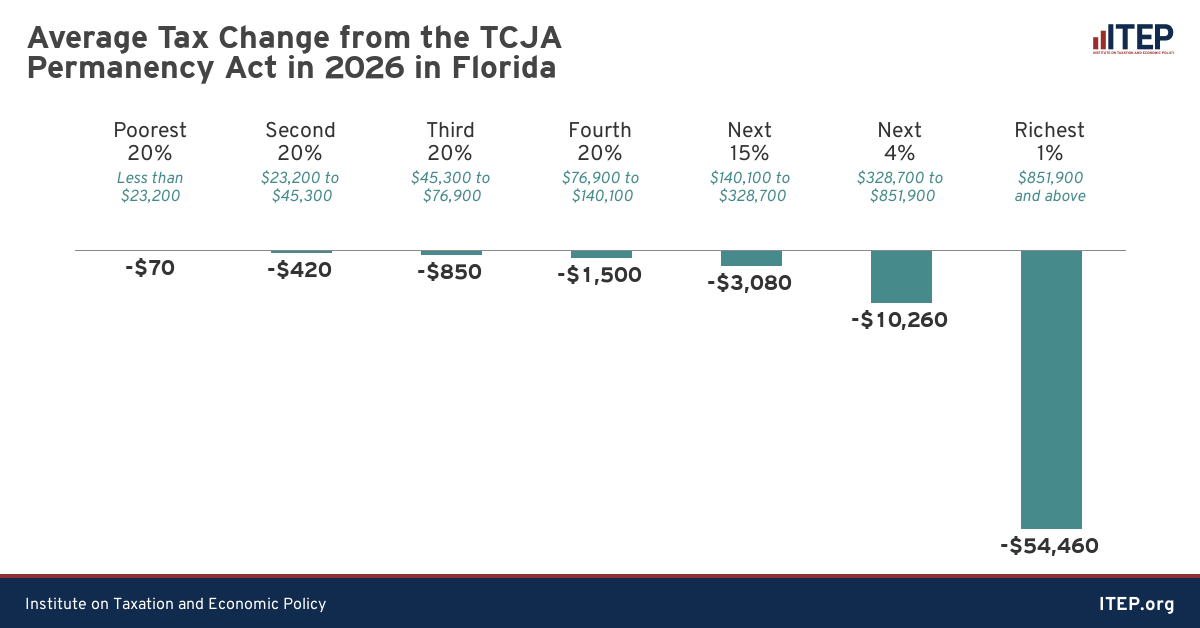
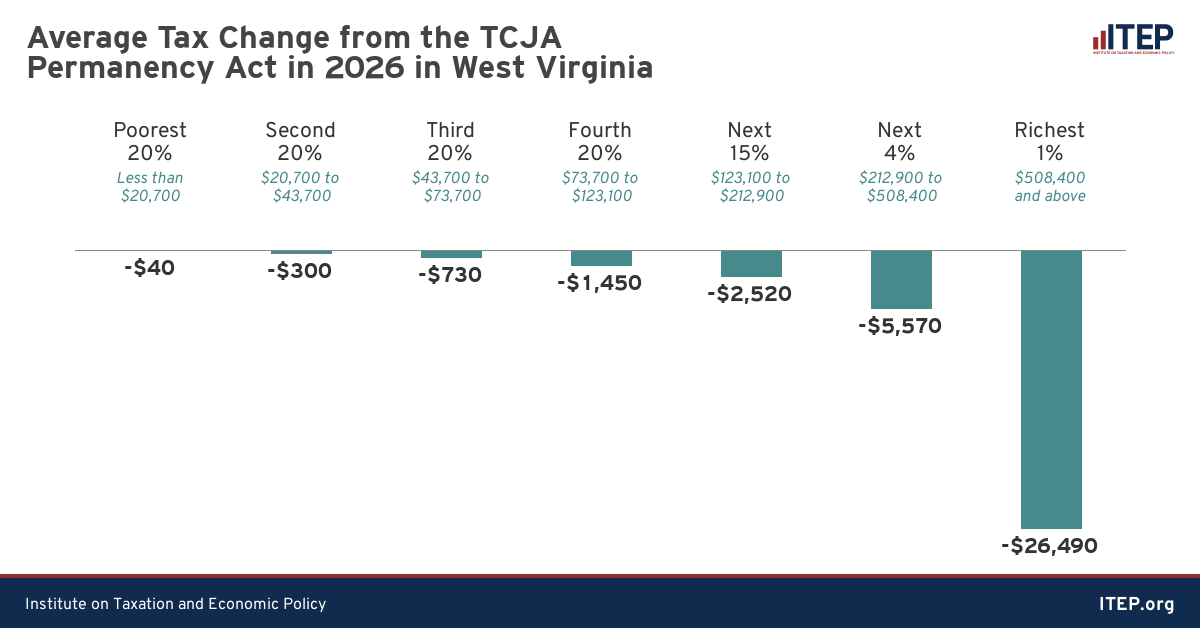
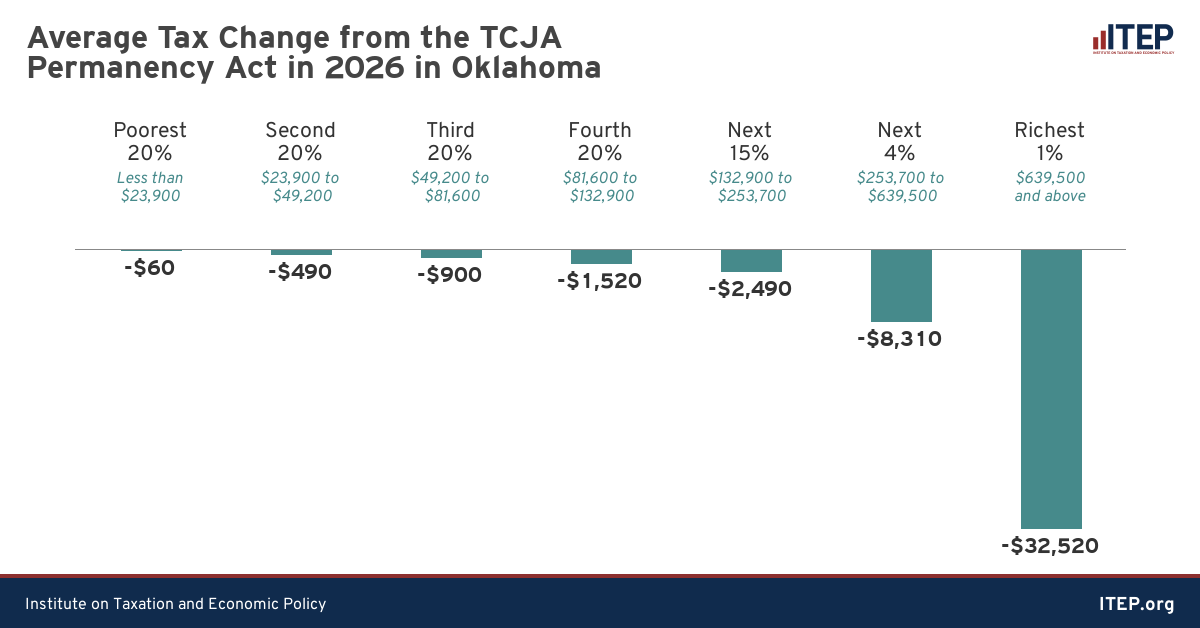
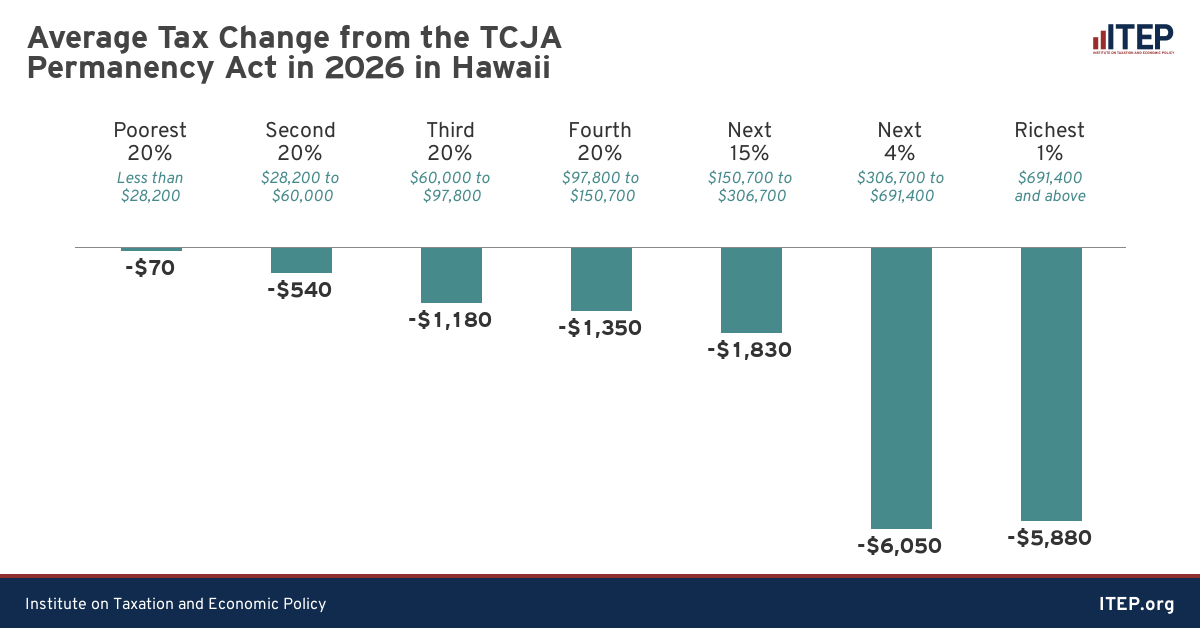
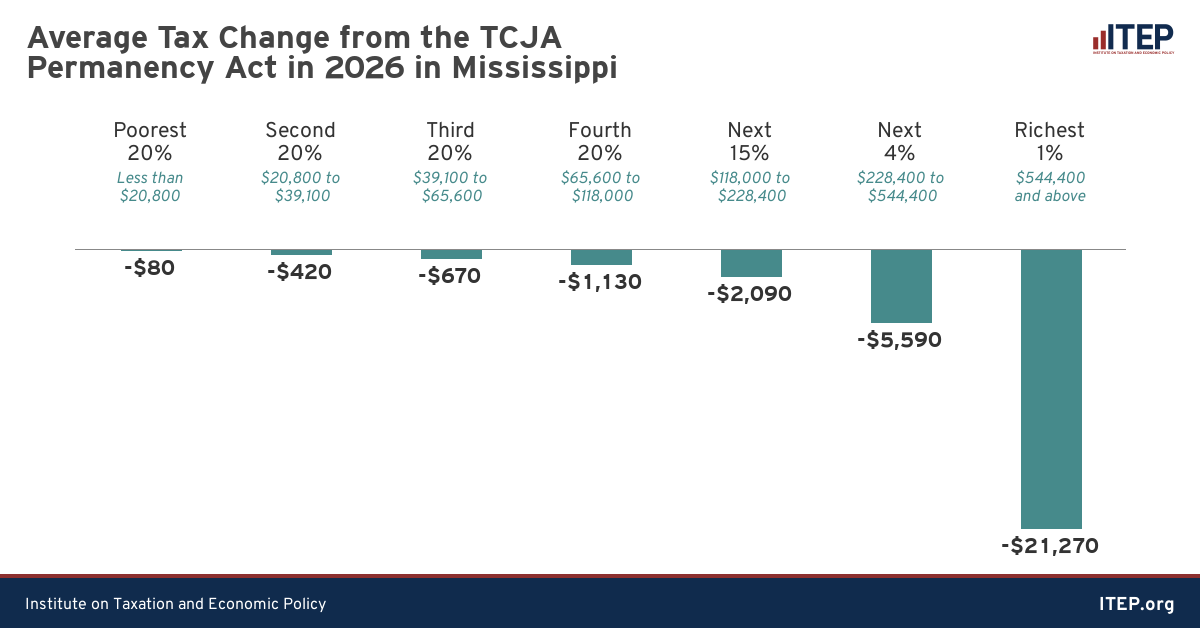
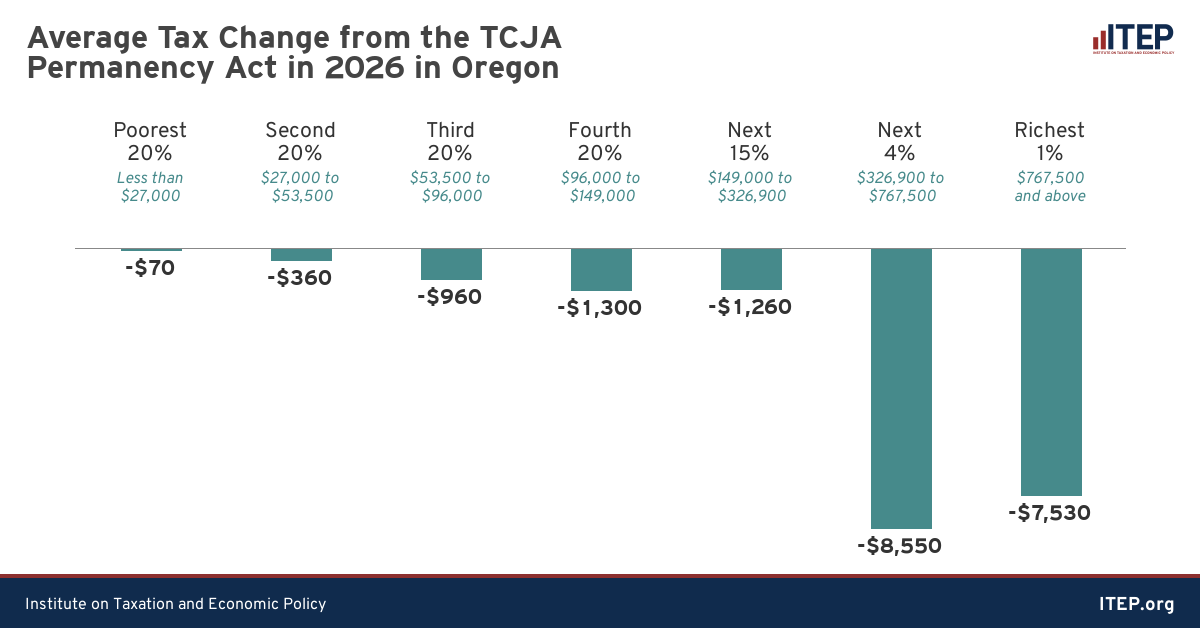
Download the State-by-State Graphics
Appendix: Methodology
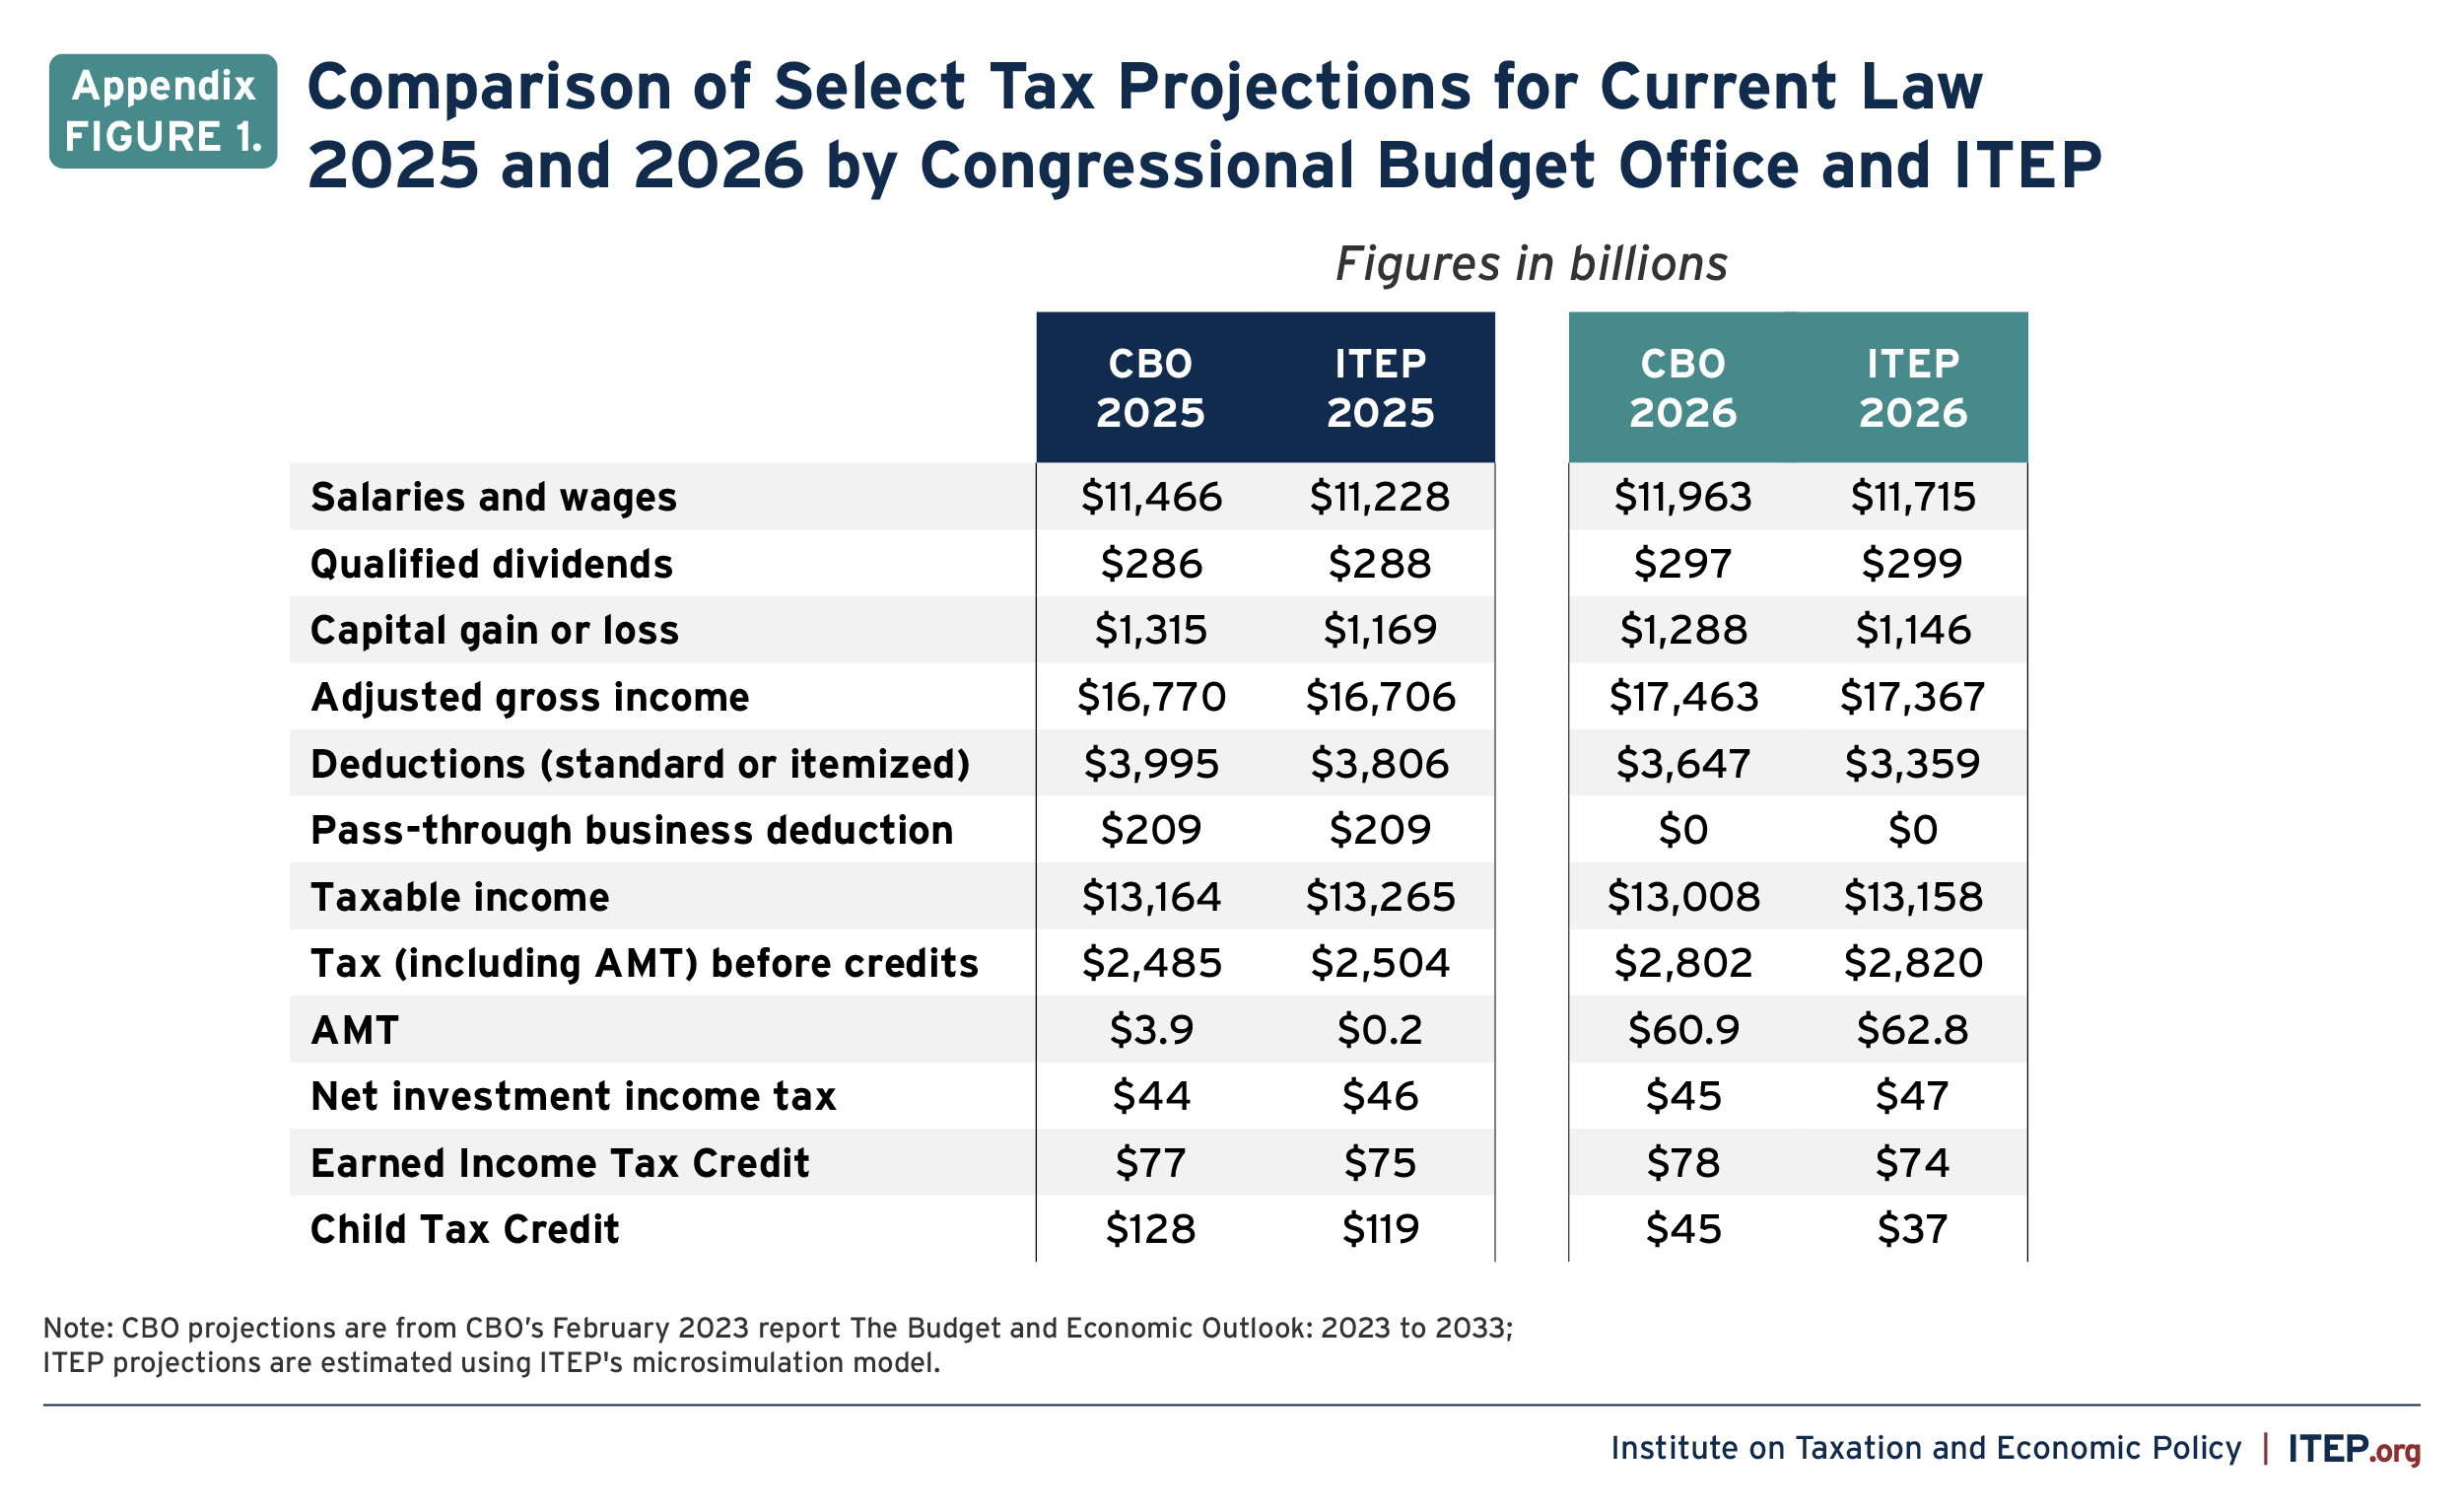
ITEP regularly updates the data used in its microsimulation model to include the most recent economic forecasts from the Congressional Budget Office (CBO) and ensures that that the overall shape of the current law tax code that it projects matches the one CBO projects. Appendix Figure 1 below compares some basic tax projections for 2025 and 2026 from the ITEP model with those of CBO.
ITEP ensures that the distribution of different types of income and tax items across income groups in each state is consistent with their distribution according to recent state-by-state data published by the IRS. For this purpose, ITEP is currently using IRS data from 2019. (The most recent state-by-state data from the IRS is for 2020, but that was an unusual year due to the pandemic and is less likely to represent the typical state of our economy and tax system.) How certain provisions were distributed in 2019 (the last year for which helpful data exists) combined with CBO’s projections of how certain types of income and certain tax items will grow in the future helps us estimate the impact of extending temporary TCJA provisions in 2026.
An example of a particularly complicated provision to estimate is the pass-through business deduction (the qualified business income deduction under section 199A). The deduction is limited (under a complicated set of rules) for the otherwise eligible income of taxpayers above certain taxable income thresholds. ITEP assumes that the amount of otherwise eligible income that is restricted under the rules is such that the resulting total deduction allowed is the total projected by the Congressional Budget Office. (ITEP’s total estimated QBI deduction in 2025, therefore, matches the total projected by CBO that year, the last year it is in effect under current law.)
ITEP also assumes that the fraction of income restricted for each income group in each state is such that the resulting distribution of the total deduction across income groups in each state matches the distribution reported recently by the IRS. In other words, ITEP’s estimates for extending the deduction in 2026 assume that it would be distributed across income groups in each state in 2026 roughly as it was in 2019 according to the IRS. Download this table to see how ITEP’s distribution of the deduction in 2026 compares to that reported by the IRS for 2019.
Note on State-Enacted Policies to Avoid the Cap on SALT Deductions
Regardless of what one thinks about the motivations of the law’s drafters in including a $10,000 cap on deductions for state and local taxes (SALT), it was initially very clear that the cap mostly restricted tax breaks for the richest taxpayers.[7]
However, since the 2017 law was enacted, many states have enacted policies that in effect allow some of their well-off residents to avoid the cap on SALT deductions. These SALT cap “workaround” policies benefit partners and owners of a pass-through business (and those who can arrange to become such). This means that many of the very richest taxpayers who were affected by the SALT cap when it first came into effect are now able to avoid it.
The details vary but the general idea is that partners and owners of these businesses pay a business tax to their state, which reduces the pass-through business income they report on their federal tax return and is therefore the equivalent of state tax that is fully deductible on federal tax returns.
States enact taxes to be paid by pass-through businesses, which until now have usually not been subject to taxes because their profits are instead reported on the personal income tax returns of their owners. The state also provides the owner of a pass-through business with a credit against their state personal income tax for their share of the tax paid by the pass-through business of which they are a partner or owner.
The state itself sees little or no change in revenue. The new pass-through entity tax revenue is offset by the credit that reduces personal income taxes paid to the state. But the business partners and owners benefit because they have replaced a tax that is not entirely deductible on the 1040 with one that (effectively) is.
Modeling the interaction of these state-enacted SALT cap workaround policies with the TCJA provisions is challenging. An analysis by the Wall Street Journal concluded that the workaround policies of 11 states would effectively convert $40 billion from state taxes that are limited under the SALT cap to state taxes that are not limited.[8] These 11 states are California, Connecticut, Illinois, Massachusetts, Michigan, Minnesota, New Jersey, New York, Rhode Island, South Carolina, and Wisconsin.
For this analysis, ITEP assumes that the pass-through entity taxes enacted by these 11 states are paid by all owners of pass-through businesses in those states, regardless of whether or not they are state residents. We assume that, of the pass-through entity tax collected by each state to help taxpayers avoid the SALT cap, half is paid by state residents and half is paid by those who live in other states.
We make this assumption based on data from California’s revenue agency demonstrating that roughly half the pass-through business income generated in the state goes to state residents and the other half goes to residents of other states.[9] To our knowledge, no other state provides such information about the resident/non-resident breakdown of business income. Lacking comparable information from other states, we assume the same 50/50 split of pass-through income in every state to residents and non-residents.
For each of the 11 states in the Wall Street Journal analysis, we assume that half of the pass-through entity tax collected is reflected as a reduction in pass-through income reported to the IRS by residents of the state enacting the tax. The other half is reflected as a reduction in pass-through income reported to the IRS by residents of all other states. In both cases, we assume that these taxpayers also reduce the state and local taxes that they could otherwise report to the IRS (before the $10,000 cap is applied) by the same amount.
We use these simplifying assumptions for now to model an area of tax law that is changing rapidly. Our assumptions are probably conservative in the sense that state pass-through entity taxes enacted to avoid the SALT cap will likely have a much greater impact than will be reflected in our modeling. While the 11 states included in the Wall Street Journal are likely the most significant (particularly California, New Jersey and New York) this list does not include 21 additional states that have recently enacted similar policies. By 2026 the effects of these state policies are likely to have grown substantially, which is not reflected in this report.
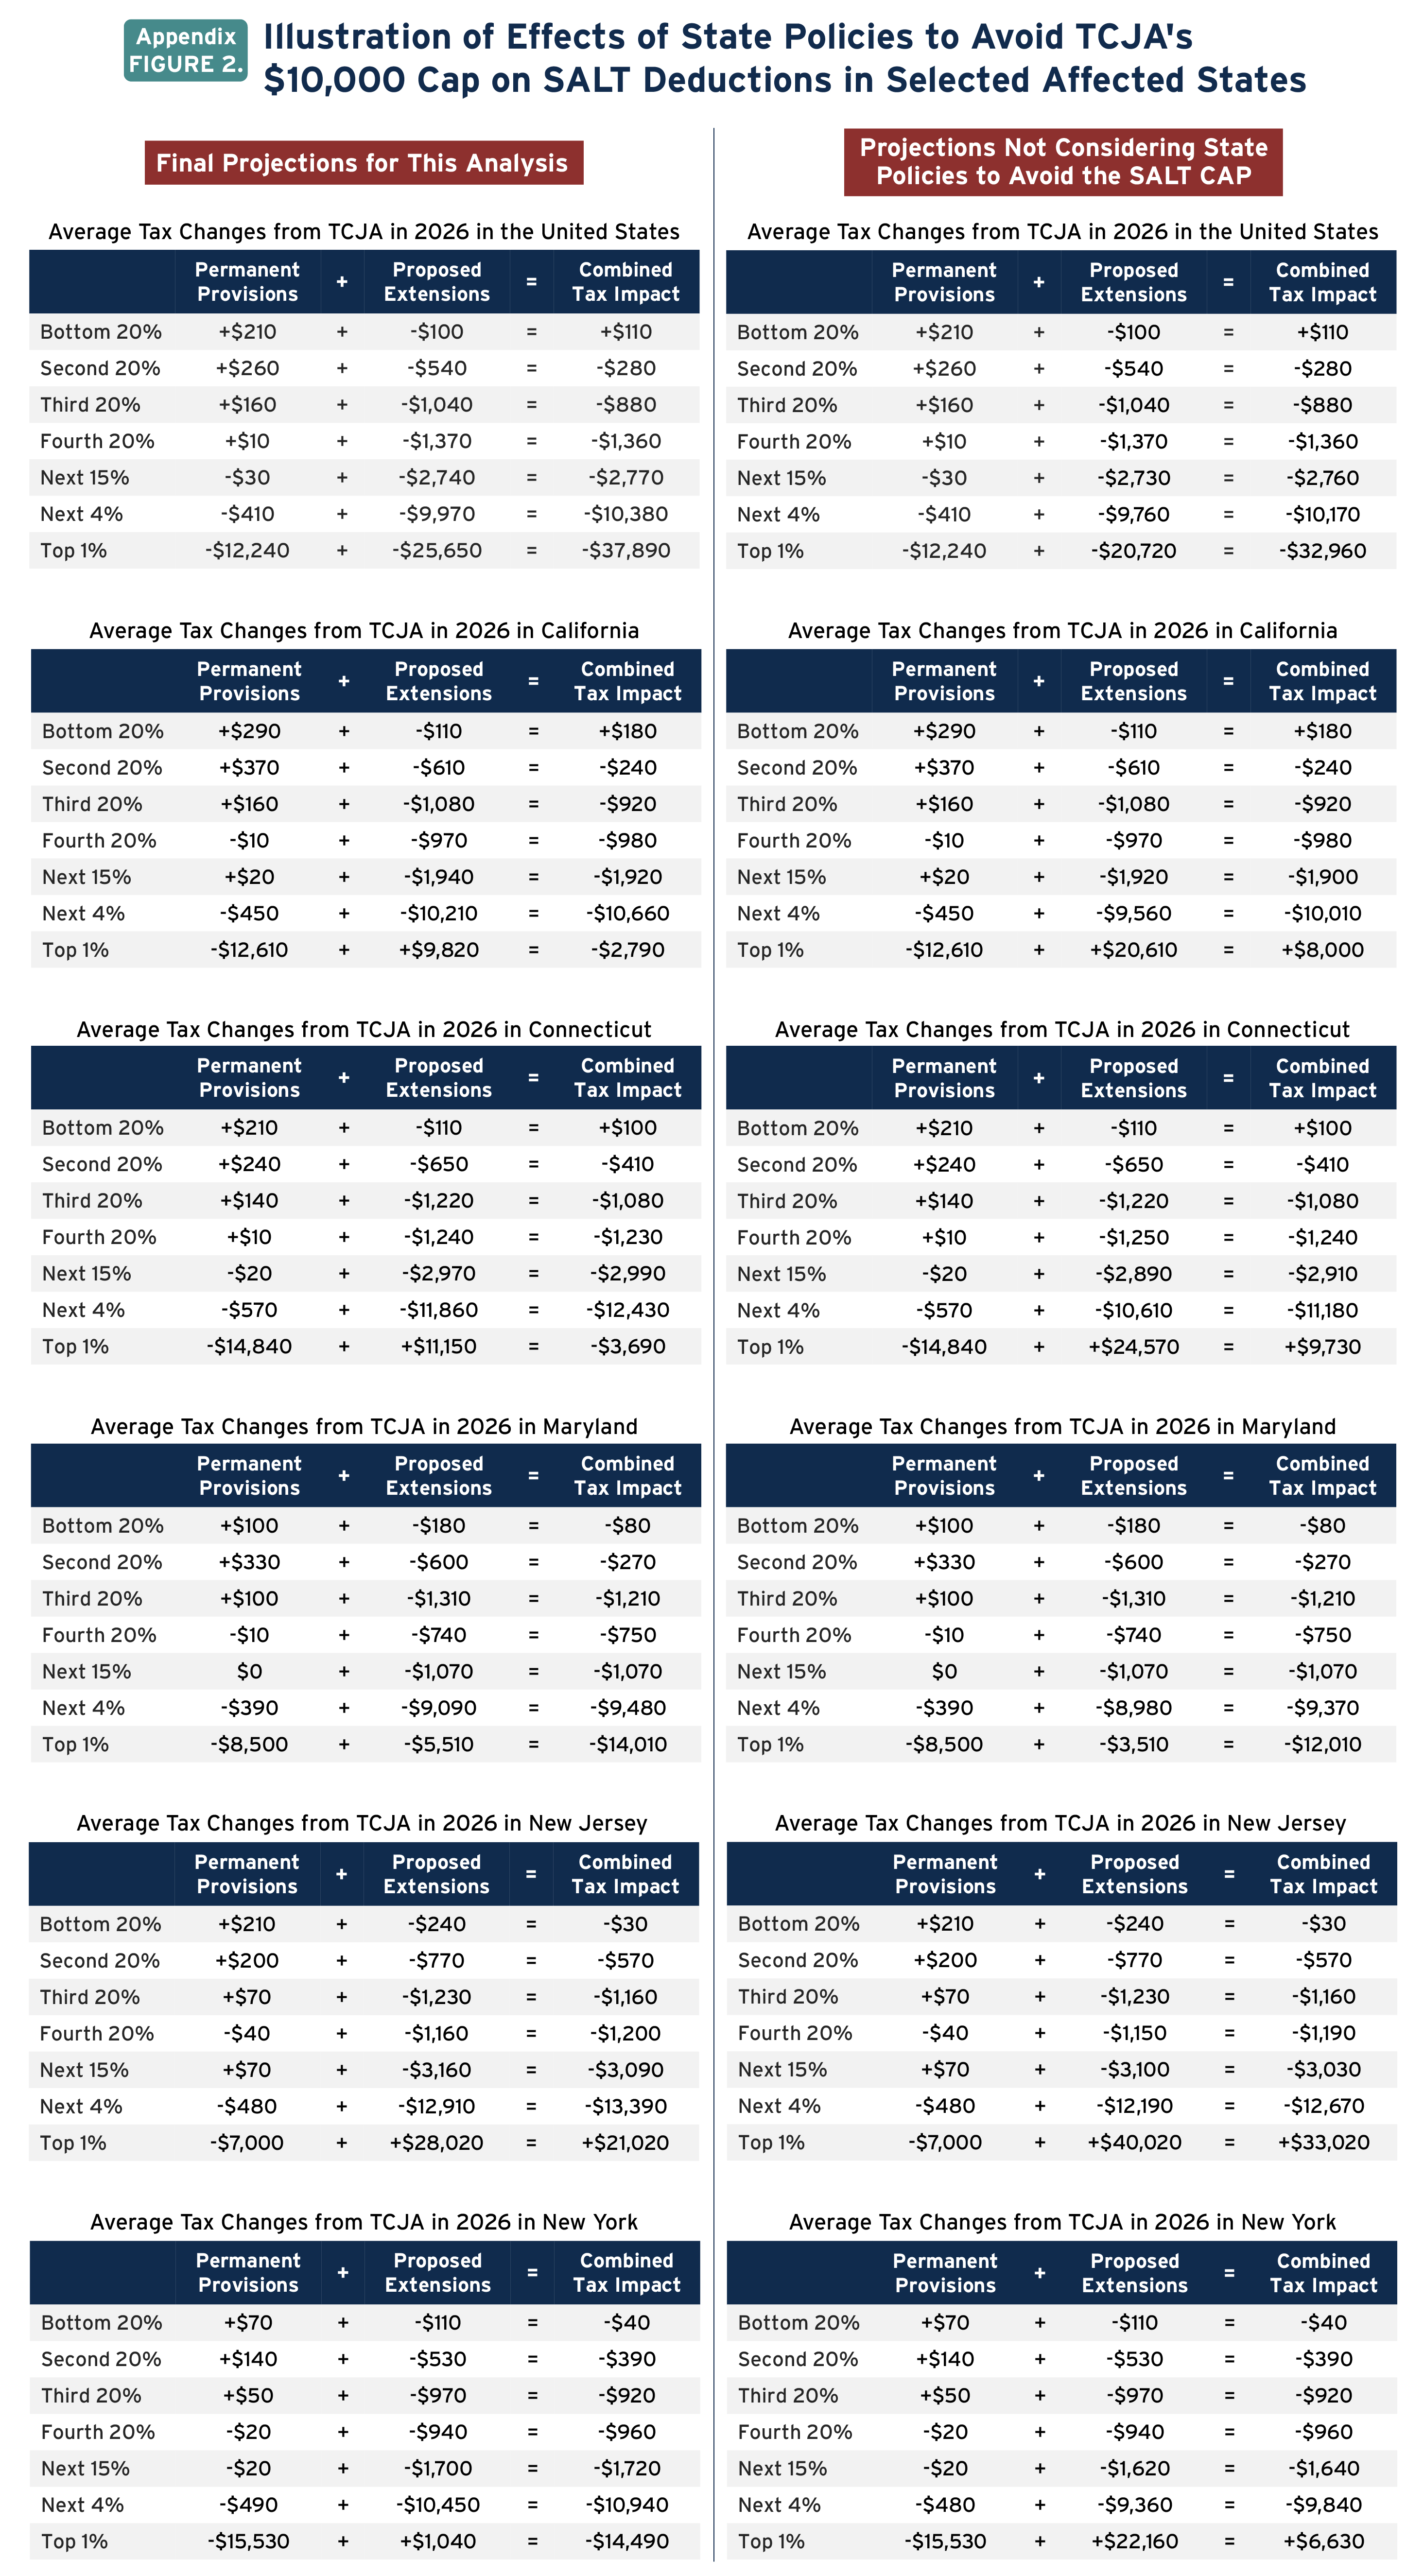
The state workaround policies make a substantial difference for the richest taxpayers in states that are heavily affected by the cap on SALT deductions. Appendix Figure 2 illustrates this in the most affected states. On the left side are examples of the tables found at the end of the data available for download, showing the average tax changes for each income group in the United States and in each state. On the right side is the comparable table estimated without using the method described above to take into account the state-enacted SALT cap workaround policies. In many of these selected states, the workaround policies change the overall impact of TCJA’s provisions from imposing a net tax hike on the richest one percent to providing a net tax cut for this group.
Endnotes
[1] Revenue estimates in this report are for calendar year 2026, which may differ from other analyses which provide revenue estimates for fiscal years.
[2] This analysis includes the provisions of the legislation that appear in Figure 6, which account for nearly all the revenue changes caused by the bill. Provisions not included in this analysis generally have a revenue impact of $2 billion or less each year.
[3] Richard Phillis and Steve Wamhoff, “The Federal Estate Tax: An Important Progressive Revenue Source,” Institute on Taxation and Economic Policy, December 6, 2018. https://itep.org/the-federal-estate-tax-an-important-progressive-revenue-source/
[4] Steve Rosenthal and Theo Burke, “Who’s Left to Tax? US Taxation of Corporations and Their Shareholders,” Tax Policy Center, October 27, 2020. https://www.law.nyu.edu/sites/default/files/Who%E2%80%99s%20Left%20to%20Tax%3F%20US%20Taxation%20of%20Corporations%20and%20Their%20Shareholders-%20Rosenthal%20and%20Burke.pdf
[5] Joint Committee on Taxation, “Modeling the Distribution of Taxes on Business Income,” October 16, 2013, JCX-14-13. https://www.jct.gov/publications/2013/jcx-14-13/
[6] Using JCT’s convention, ITEP assumes that labor receives none of the benefits of a corporate tax cut in the first year after enactment and then gradually receives a share of the benefits that grows to one-fourth of the total by the tenth year. While this convention is cautious – one could easily argue that less of a corporate tax cut really ever reaches workers – it provides a way to think about how eventually some of the corporate tax cuts could indirectly flow to workers, if such a thing ever happened. Under this approach, ITEP assumes that in 2026 labor receives about 22 percent of the corporate tax cut that flows to Americans (22 percent of the total excluding the portion flowing to foreign investors).
[7] Steve Wamhoff, Carl Davis and Matthew Gardner, “Options to Reduce the Revenue Loss from Adjusting the SALT Cap,” Institute on Taxation and Economic Policy, August 26, 2021. https://itep.org/options-to-reduce-the-revenue-loss-from-adjusting-the-salt-cap/
[8] Richard Rubin, “States Help Business Owners Save Big on Federal Taxes With SALT-Cap Workarounds,” May 31, 2022, Wall Street Journal. https://www.wsj.com/articles/states-help-business-owners-save-big-on-federal-taxes-with-salt-cap-workarounds-11653989400
[9] State of California Franchise Tax Board, 2020 Personal Income Tax Report. https://data.ftb.ca.gov/stories/s/Personal-Income-Tax/2it8-edzu/#annual-report Tab “B4A All” includes the profits and losses of the pass-through entities in question, which are S corporations and partnerships, in California that are owned by state residents. Tab “B4G Part Year & NR” includes the profits and losses of S corporations and partnerships in California that are not owned by full-time residents of the state.