Key Findings
- For families of modest means, California is not a high-tax state. California taxes are close to the national average for families in the bottom 80 percent of the income scale. For the bottom 40 percent of families, California taxes are lower than states like Florida and Texas.
- The highest earners usually pay higher taxes in California than elsewhere. But rich Californians’ tax rates are not much different from the tax rates that low-income families in many states have long been accustomed to paying. Sixteen states tax their poorest residents at rates higher than what California applies to its richest. Florida, Tennessee, and Texas are among those 16 states.
- California’s tax system is relatively flat overall, whereas most states have highly regressive taxes that ask less of the rich than of anyone else. California’s choice to have a less regressive system largely explains why California collects more tax revenue per capita than other states without especially high tax rates for low- and middle-income families.
Tax Rates Vary by Income Level
In January 2024, ITEP released the 7th edition of its Who Pays? report, which measures the impact of state and local taxes on families at every income level.[1] The report includes nearly all state and local tax collections, meaning it reflects the combined impact of income taxes, sales taxes, excise taxes, property taxes, estate taxes, and various other tax types. It is the only comprehensive analysis of its kind.
One finding from the report is that state and local taxes often have very different effects on families at different income levels. Very few states can be neatly categorized as “low tax” or “high tax” for families across the board.
While many states enjoy low-tax reputations, only one state, Alaska, ranks among the bottom 10 states for its tax rates at every income level. Alaska, of course, achieves this distinction only because of robust revenue collections from taxes on natural resource extraction that most states cannot emulate.
By the same token, although California is commonly thought of as a high-tax state, this characterization does not hold true for many low- and middle-income families. Figure 1 displays California’s tax rate, by income level, relative to the national average and to two other large states (Florida and Texas).
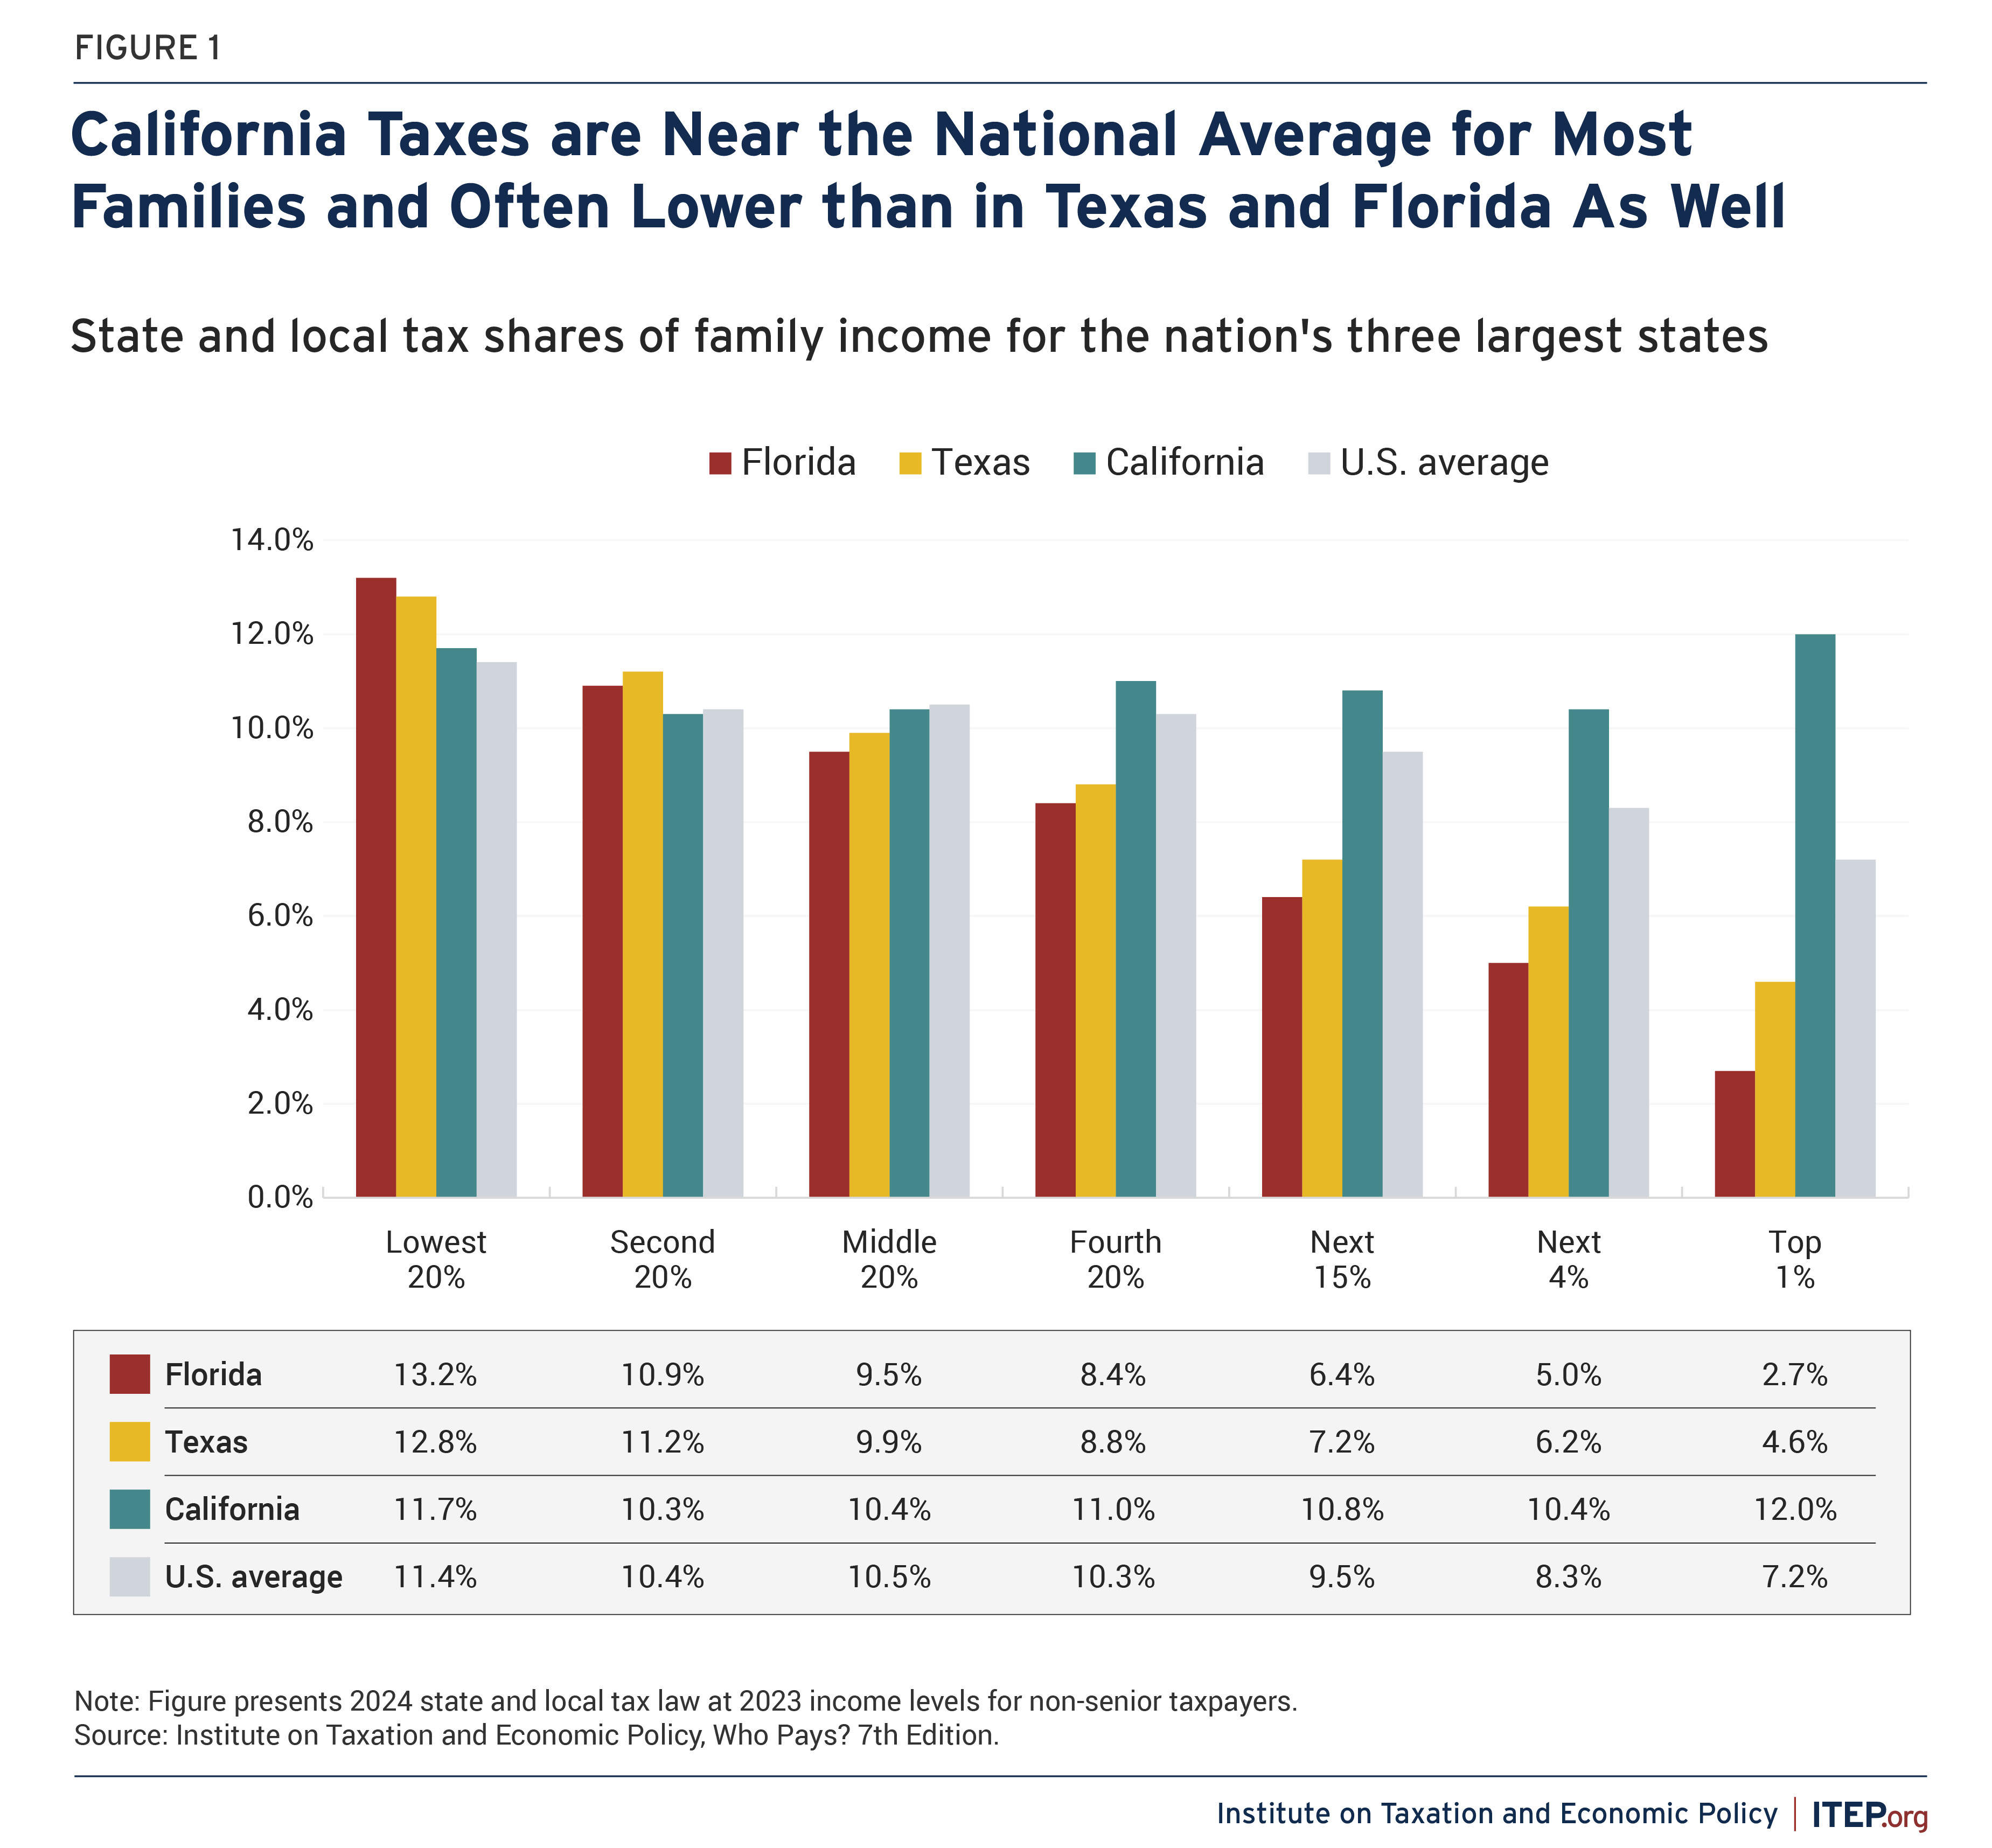
For families across the bottom 80 percent of the income scale, California’s overall tax rates are within 1 percentage point of the national average. The difference between California and other states is somewhat wider for upper-middle class families and is widest for families at the very top of the income scale. Only the top 5 percent of California families pay tax rates that are more than 2 percentage points higher than the national average.
A comparison to the nation’s second and third largest states—Texas and Florida—yields even more jarring results. Despite these states’ reputations for having low taxes, California has lower taxes for its bottom 40 percent of earners than either Texas or Florida. In the middle of the income scale, these three states’ overall tax rates are all within 1 percentage point of each other. The story is reversed at the top of the income scale: Texas and Florida are undoubtedly low tax for the rich.
While most other states tax their wealthiest families at lower rates than any other group, California has a flatter tax distribution where the rich are responsible for tax rates similar to those paid by other families. This policy choice—achieved through a mix of higher tax rates at the top and refundable credits for lower-wage workers, among other measures—largely explains why California has some of the most robust tax revenue collections in the nation.[2] Taxpayers at the top of the economic scale enjoy a large share of overall income and, as a result, taxing them at higher rates leads to comparatively higher revenue collections without requiring especially high tax rates on most families.
California Taxes on the Rich are Similar to Those that Other States Apply to the Working Class
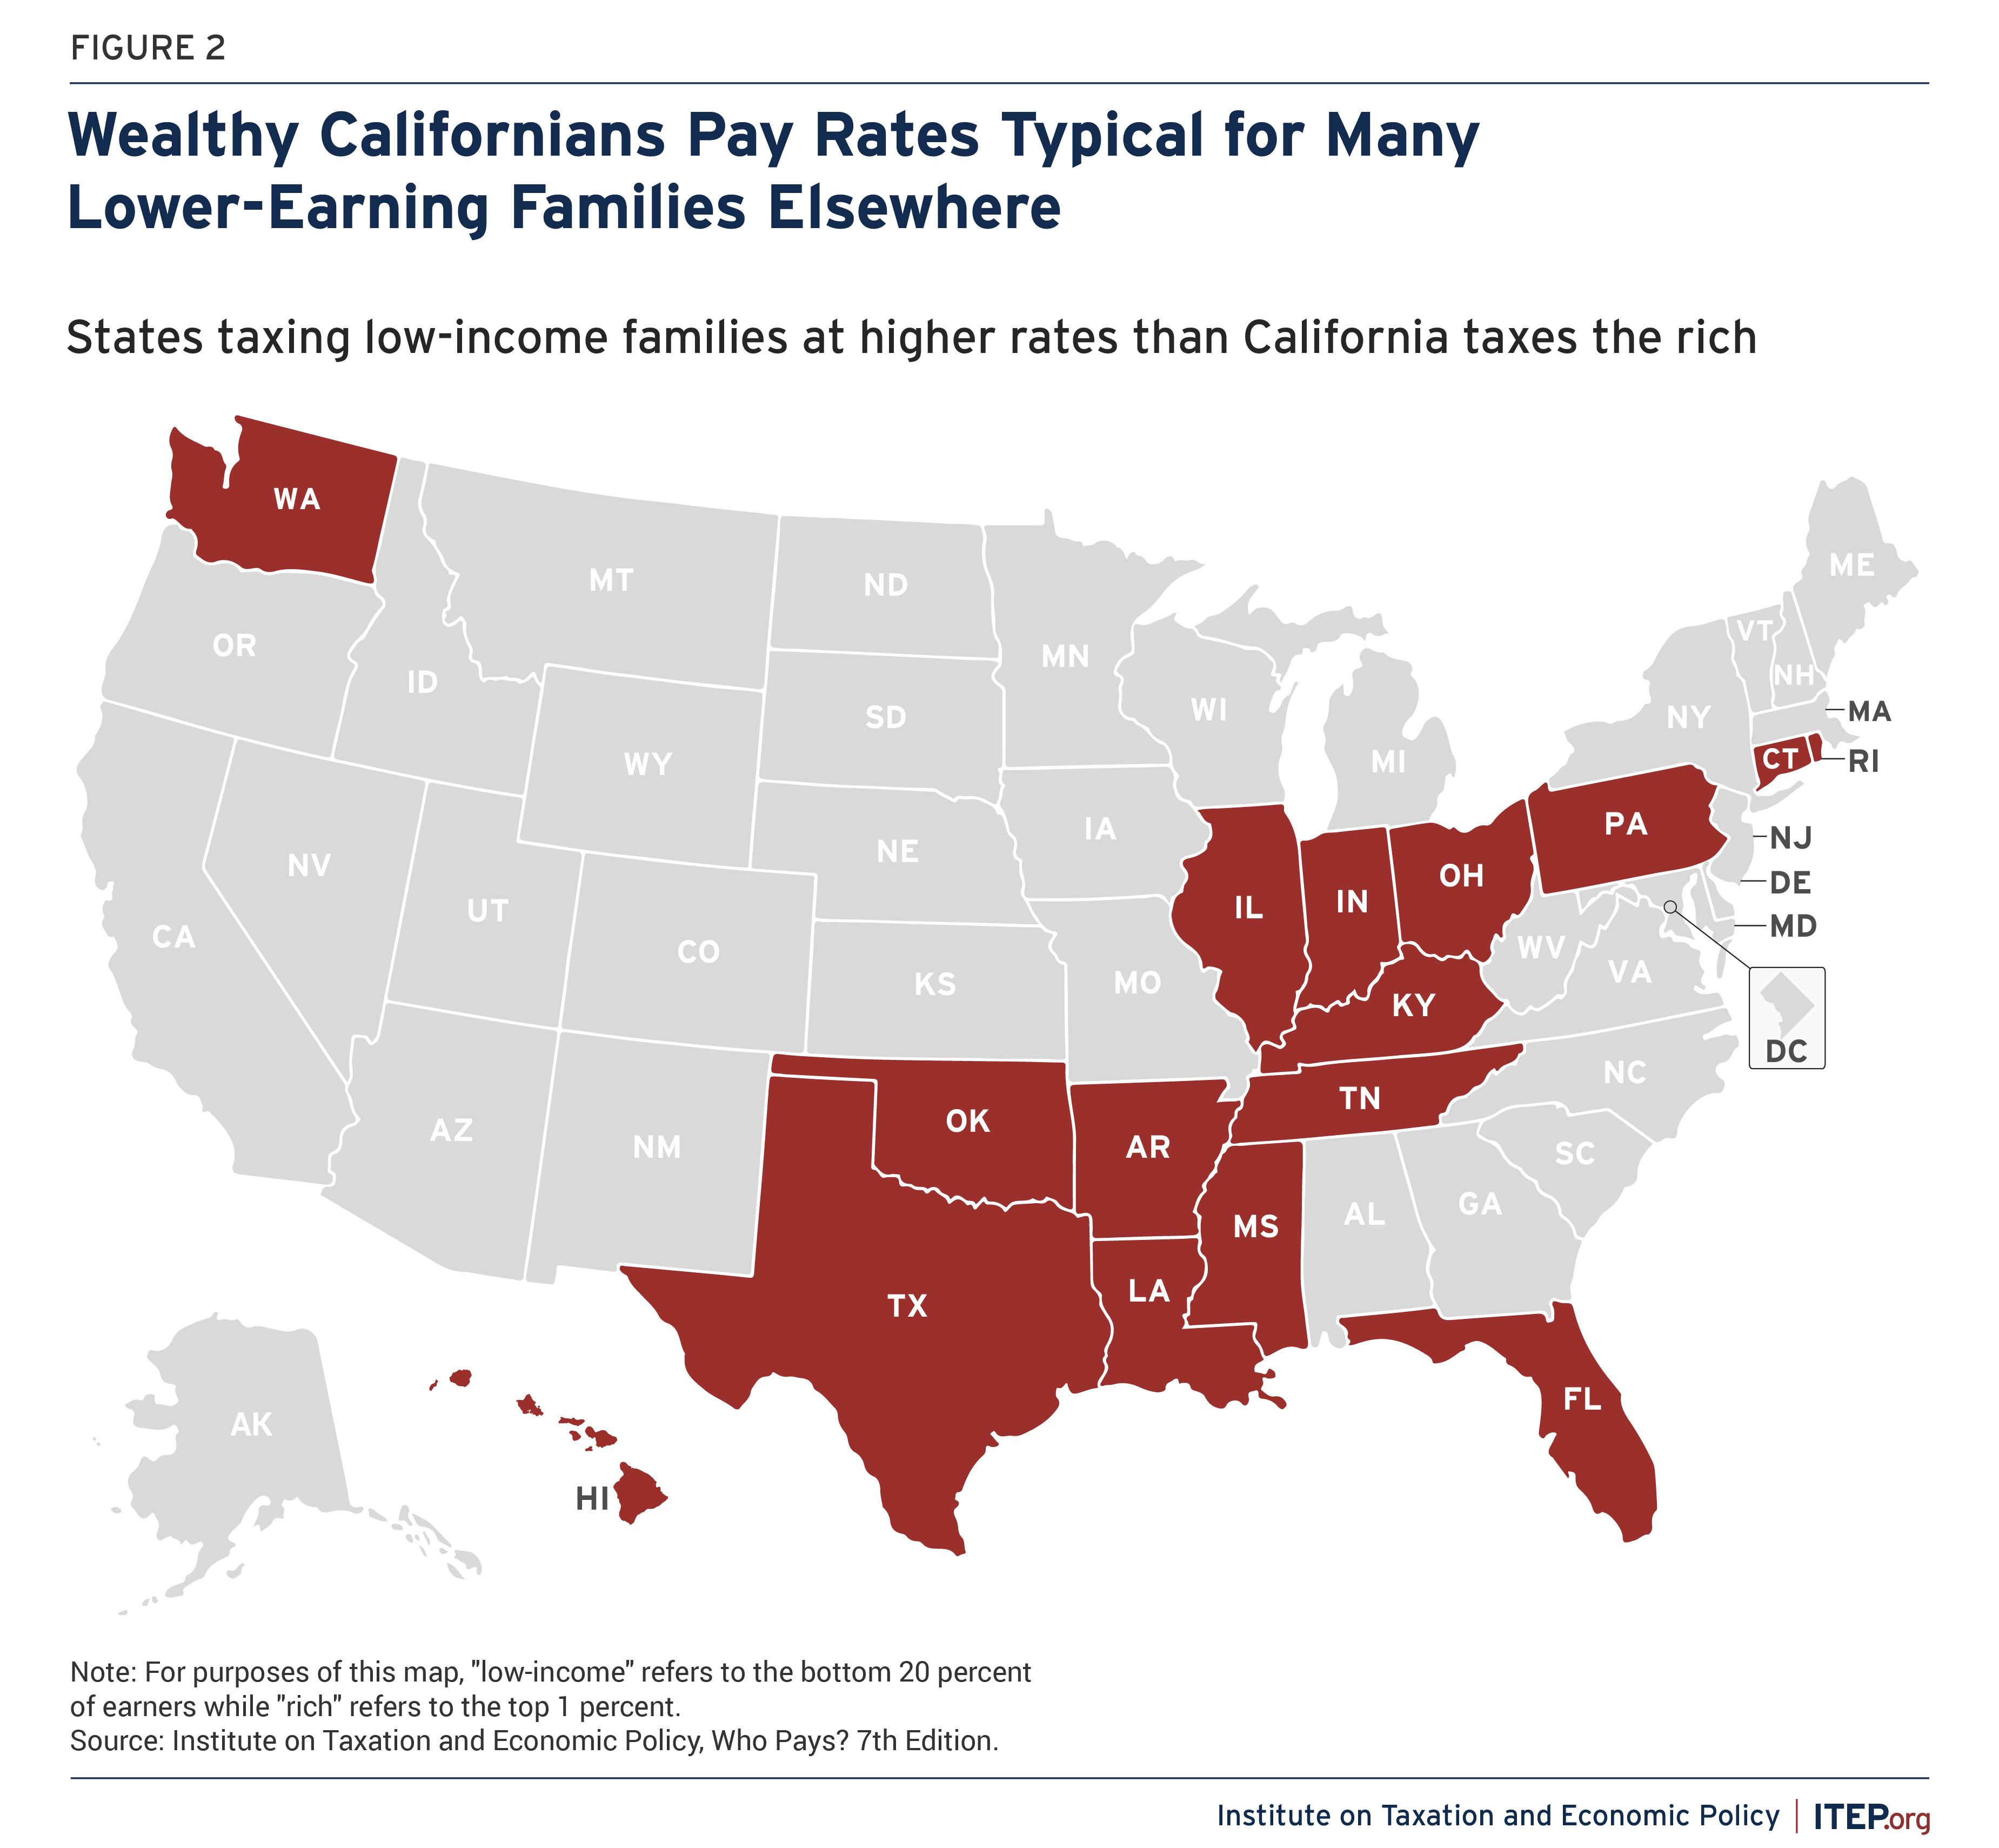
California is often described as levying high tax rates on wealthy families, and it is true that California taxes rich people at higher rates than other states. But California’s rates on wealthy families are not out of line with how many states tax families of more modest means.
Figure 2 identifies 16 states that charge higher overall tax rates to low-income families than what California charges its wealthiest residents. While California applies at 12.0 percent tax rate to its top 1 percent of earners, these states apply tax rates ranging from 12.2 to 15.1 percent to their bottom 20 percent of earners.
Of course, the types of taxes being paid vary considerably between high- and low-income earners. For families outside of the top 20 percent of earners nationally—those earning less than $138,000 per year—the largest category of state and local taxes are consumption taxes, followed by property taxes on their homes and motor vehicles, and only then followed by income taxes. Meanwhile, for the highest-earning families, personal income taxes are the largest category.
As seen in Figure 3, low-income Texans and Floridians devote sizeable portions of their income toward sales, excise, and property taxes. For rich Californias, only a small share of their income goes toward these taxes while the income tax comprises the bulk of their overall state and local tax payments.
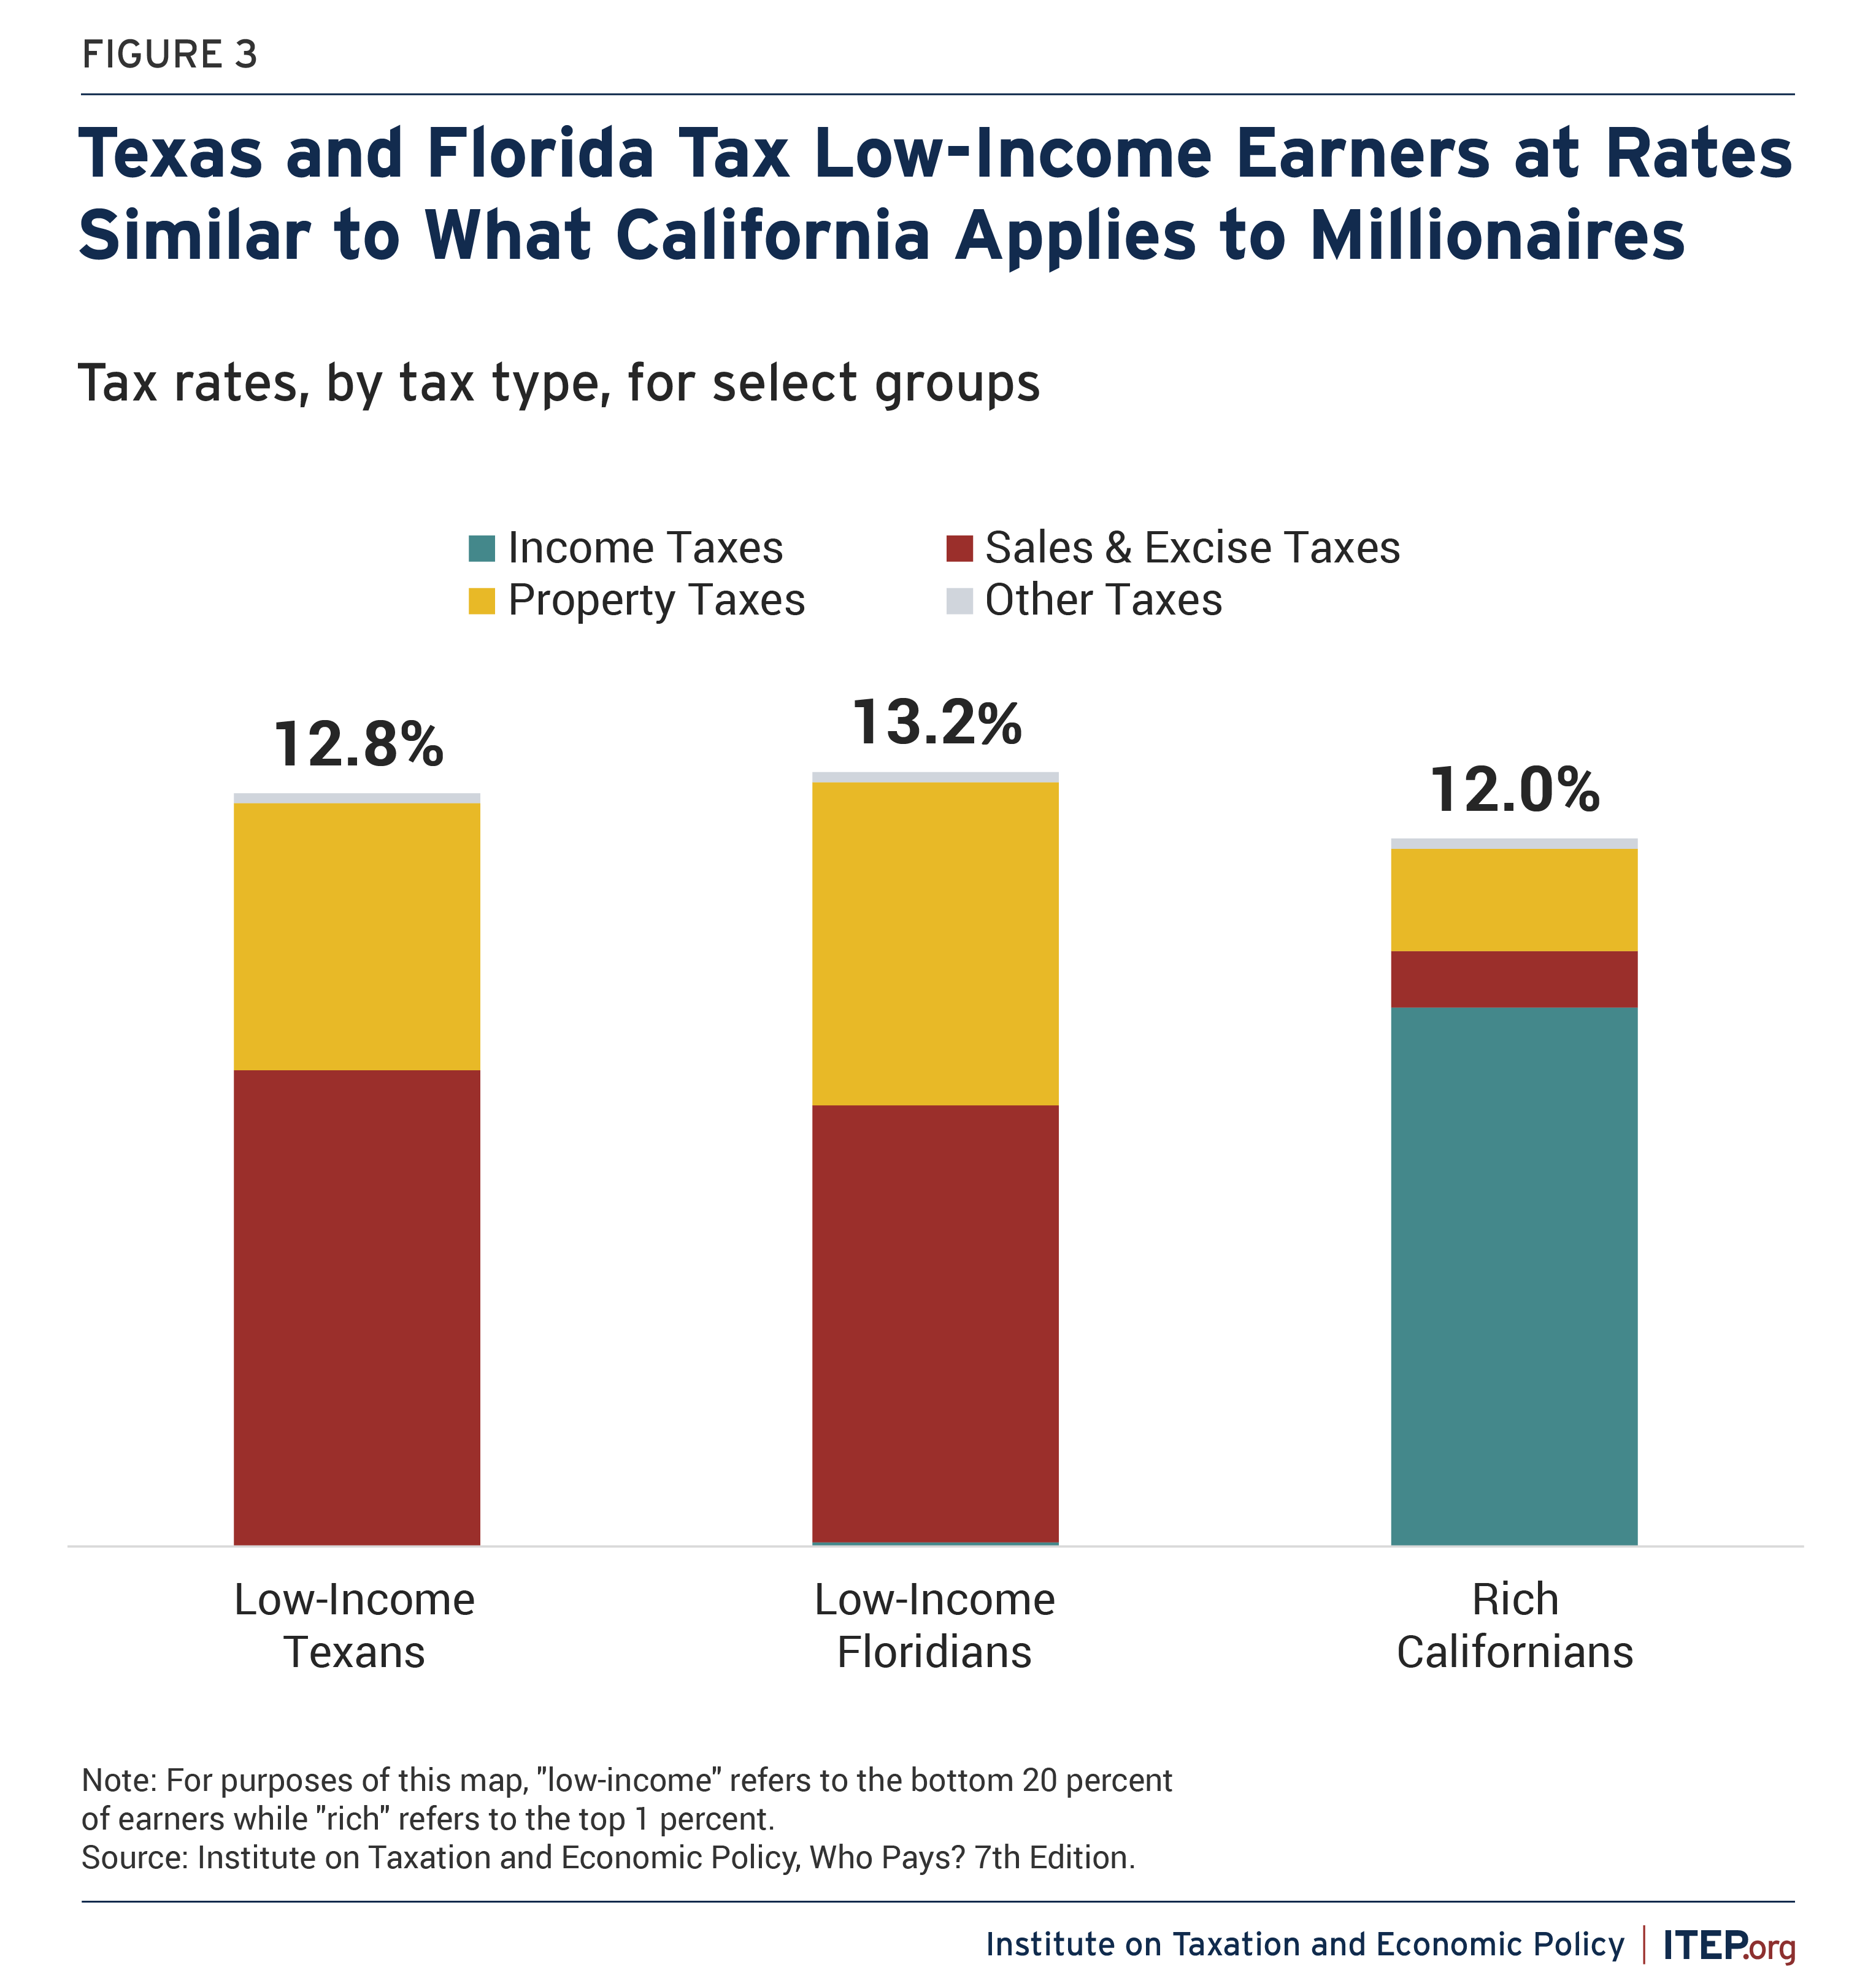
As shown in Figure 3, Texans earning less than $21,700 and Floridians earning less than $19,600 pay a larger share of their income in state and local taxes than the 1 percent of Californians with incomes over $862,100 per year.
Most Californians Pay Relatively Typical Tax Rates
While some states certainly collect more tax revenue than others, very few can be neatly categorized as “low tax” or “high tax” for families across the board. California offers a case in point. California taxes are near the national average for most families, and lower- and moderate-income Californians often pay less than in states like Florida and Texas. Meanwhile, the wealthiest Californians are responsible for funding a larger share of the state’s schools, roads, and public safety than wealthy people in most other states. They do pay more than Californians of more modest means, like the state’s teachers, truck drivers, and farmworkers. But as a share of income, the rates that rich Californians pay are not unusual for Americans.
Technical Notes
The data in this brief are taken from the 7th edition of ITEP’s Who Pays? report, which offers the only comprehensive analysis of state and local tax incidence across all 50 states plus D.C.[3] A detailed description of the methodology underlying these calculations is available in Appendix G of Who Pays?. In addition to that document, we also share a few comments below to help the reader better understand the findings in this brief.
Our analysis compares taxpayers by their relative position in their state’s income distribution because those families are in the most comparable economic and social position. Alongside their substantially higher cost of living, Californians earn more for doing the same work as Floridians and Texans.[4] Our approach uses actual economic data on earnings, spendings, and tax payments—a superior approach to comparing relative tax levels with hypothetical invented tax units.
Our analysis also takes a detailed look not just at statutory tax rates, but at state tax bases as well. This is significant in the context of the sales tax, for example, because while California has a higher statutory sales tax rate than either Florida or Texas, it also leaves more out of its sales tax base. In its most recent survey of state tax officials, the Federation of Tax Administrators found that California taxed just 21 of the 176 services being taxed in at least one state. Florida, by contrast, taxed 61 while Texas taxed 90 of those services.[5] Research by the tax compliance company Avalara reached a similar conclusion.[6] While some exemptions for services, like swimming pool cleaning, primarily benefit upper-income families, others like those for car repair services (exempted in California and Texas, but taxed in Florida) tend to make the sales tax less regressive.[7] California’s more generous sales tax exemptions also contributed to the late Professor John Mikesell’s finding that the state ranks among the lowest for sales tax breadth in the nation, measured relative to personal income.[8]
California’s narrower sales tax base also means that businesses are paying fewer sales tax dollars than would otherwise be the case. Because business-paid sales taxes are usually passed on to consumers as higher prices, this means that Californians are seeing less sales tax embedded in their purchases. Research by EY indicates that both Florida and Texas raise a larger share of their sales tax revenue from taxing business purchases than California does.[9] This finding is in line with our own research underlying the findings contained in Who Pays? and in this brief.
Differences in business tax structures across these states also lead to different effects on families across the income scale. Both California and Florida tax corporate profits and those taxes are largely borne by wealthy shareholders. Texas, on the other hand, levies a franchise tax on business purchases that tends to fall more heavily on final consumers. Both our analysis and one by the Texas Comptroller reveal the state’s franchise tax as having a meaningfully regressive impact across the income scale.[10]
California is also one of a large and growing group of states that use their personal income tax laws to provide tax rebates that partly offset the impact of other taxes on low- and moderate-income families. The bottom 20 percent of Californians see their incomes lifted by 1.8 percent through the state’s personal income tax law, largely because of a refundable Earned Income Tax Credit (EITC) and refundable Child Tax Credit (CTC) for young children. Texas and Florida lack both these credits.
Endnotes
[1] Institute on Taxation and Economic Policy, “Who Pays? A Distributional Analysis of the Tax Systems in All 50 States,” January 2024. https://itep.org/whopays-7th-edition/.
[2] Federation of Tax Administrators, “2022 State Revenues Per Capita & Percentage of Personal Income,” Accessed March 2024. https://taxadmin.org/2022-state-revenues-per-capita-percentage-of-personal-income/.
[3] Ibid., 1.
[4] See, for example, the Bureau of Labor Statistics’ Occupational Employment and Wage Statistics.
[5] Federation of Tax Administrators, “FTA Survey of Services – Update,” July-August 2017. https://taxadmin.org/wp-content/uploads/resources/sales-taxation-of-services/by_the_numbers_newsletter_july_august_2017.pdf.
[6] Avalara, “A state-by-state analysis of charging sales tax on services,” September 2015. https://www.avalara.com/us/en/learn/whitepapers/service-taxability-by-state.html.
[7] Minnesota House Research Department, “A Review of Selected Tax Expenditures,” November 2013. https://www.house.mn.gov/hrd/pubs/taxexpend.pdf.
[8] John L. Mikesell, “State Retail Sales Taxes in 2018,” Tax Notes State, July 2019.
[9] Andrew Phillips and Muath Ibaid, “The impact of imposing sales taxes on business inputs,” EY, State Tax Research Institute, and Council on State Taxation, May 2019. https://assets.ey.com/content/dam/ey-sites/ey-com/en_us/news/2019/06/ey-the-impact-of-imposing-sales-taxes-on-business-inputs.pdf.
[10] Texas Comptroller of Public Accounts, “Tax Exemptions & Tax Incidence,” February 2023. https://comptroller.texas.gov/transparency/reports/tax-exemptions-and-incidence/.