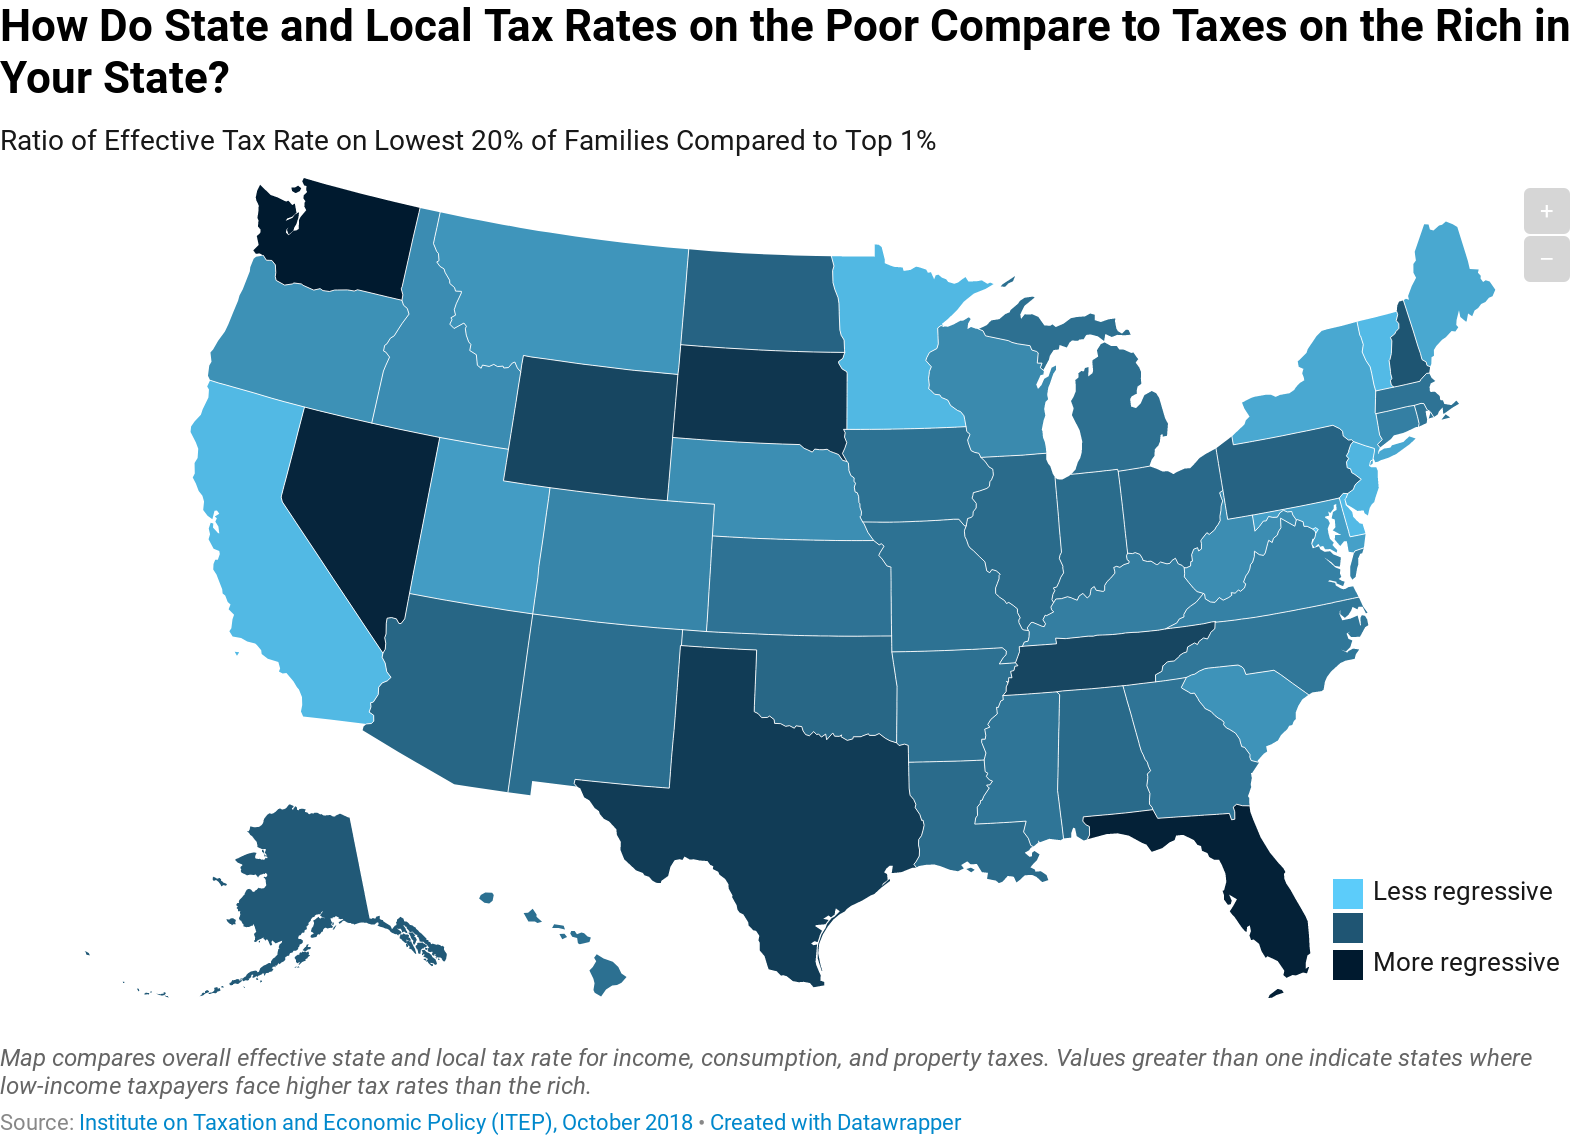
Taxpayers at different income levels experience state and local tax policy in very different ways. In Washington, for example, the lowest 20 percent of families have an average effective state and local tax rate (17.8 percent) that is nearly six times higher than the average rate paid by the top 1 percent of earners (3 percent). Forty-five states assess a higher tax rate on low-income families than the rich. This map shows the ratio of state and local tax rates paid by low-income families v. the top 1 percent. The mix of taxes used to raise revenue matters hugely under this measure. The nine states with the highest ratios (indicating much higher tax rates on the poor than on the rich) all lack broad-based personal income taxes.
Read More: Who Pays? A Distributional Analysis of the Tax Systems in All 50 States (Sixth Edition)

