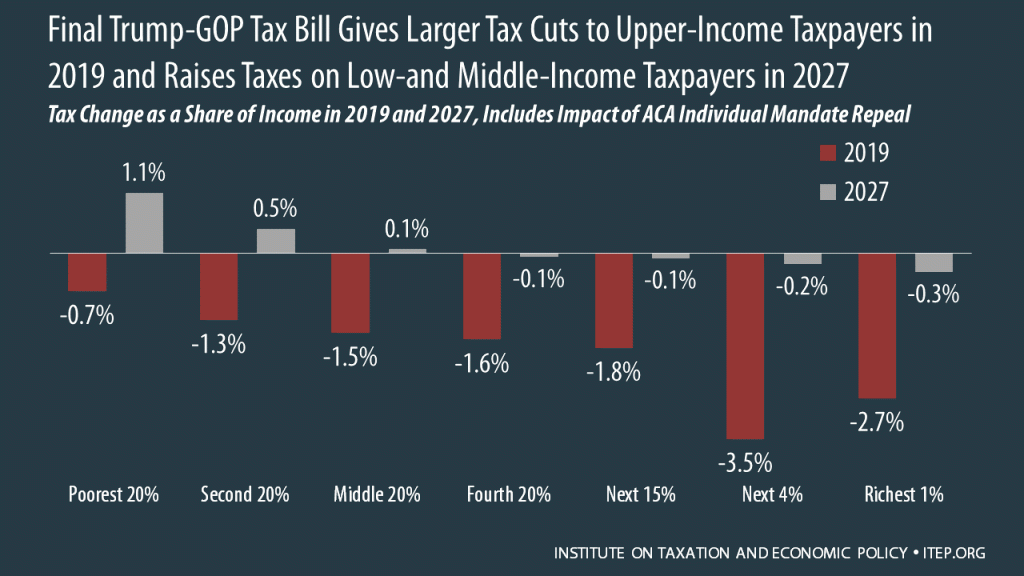
Like the initial House and Senate tax bills, the final tax legislation reserves the greatest share of the benefit for the wealthy and foreign investors and would hike taxes for average taxpayers in the lowest-earning three-fifths of households.
Overall, the final House-Senate bill is slightly more regressive than the plan that passed the Senate earlier this month.
“This ‘compromise’ tax bill contains a bit of window dressing to provide political cover for a handful of lawmakers, but it remains an egregious misuse of our tax code to redistribute wealth upward,” said Alan Essig, executive director of the Institute on Taxation and Economic Policy. “The wealthy and corporations make out like bandits while working people are tossed a few crumbs sprinkled with promises of eminent cuts to essential programs and services.”
National charts and graphs and tables that outline how this legislation would affect each of the 50 states are here: https://itep.org/finalgop-trumpbill/
Below are a few highlights with links to charts that visualize the data points:
- The richest households get the biggest tax cuts, both in dollars and as a share of income. In 2019, half of the tax cuts will go to the top 5 percent of taxpayers, and more than one-quarter will go to the top 1 percent.
- In the first year of the plan, the richest 1 percent will receive an average tax cut of $55,000—this is slightly more than the average annual income of taxpayers in the middle-income quintile.
- In the later years of the plan, the average taxpayer in the bottom 60 percent of nation’s income distribution will face a tax hike, while the richest taxpayers will continue to pay significantly lower federal taxes than they do today.
- Foreign investors are big beneficiaries of this plan. In fact, foreign investors get a bigger share of the tax cut in actual dollars than taxpayers in every income quintile except the top 20 percent.
- The share of taxpayers facing a hike increases substantially during the later years of the plan. For example, 7 percent of taxpayers in the middle-income quintile face a tax hike in 2019. By 2027, one-third of taxpayers in that group will pay more in taxes.
To view the entire report and details about what’s in the final bill, go to: https://itep.org/finalgop-trumpbill/


