Updated July 7, 2025
The centerpiece of the tax and spending bill that President Trump signed on July 4 is a significant tax cut for wealthy families, partly tacked onto the national debt and partly paid for with cuts to health care, climate investments, and other public services.
But just how large will the tax cuts for wealthy families be?
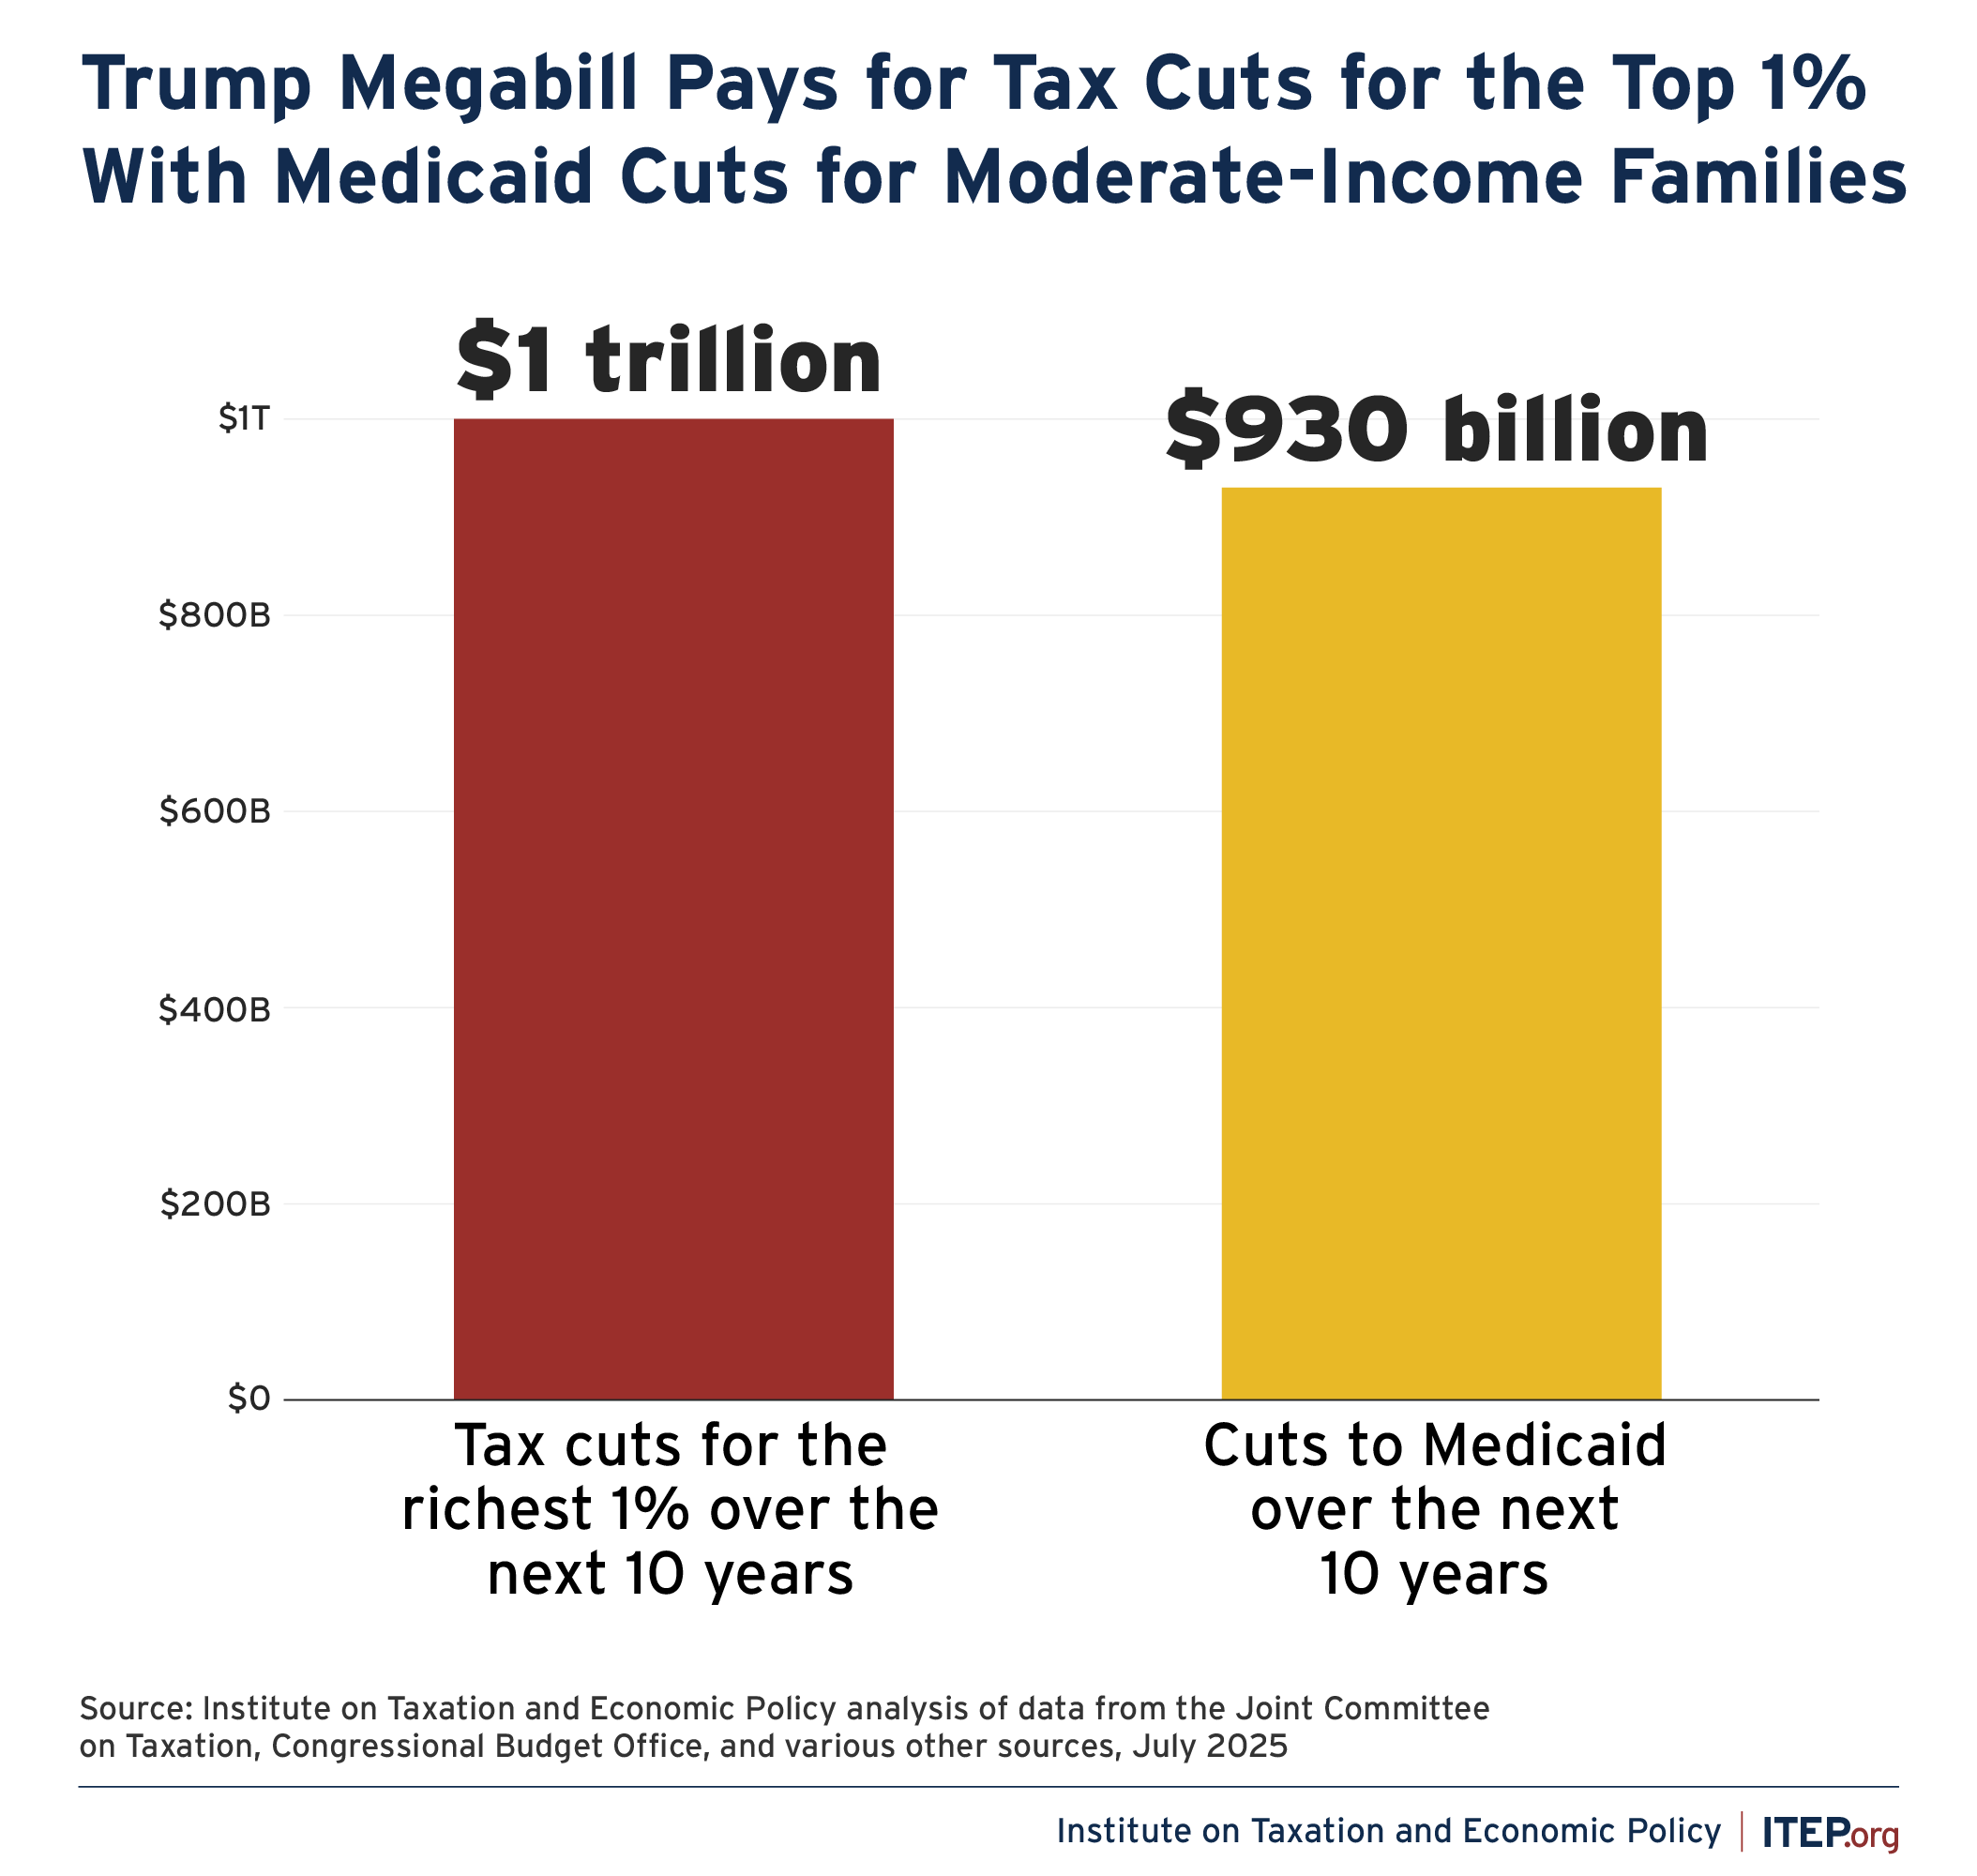
ITEP’s analysis of data from Congress’ Joint Committee on Taxation (JCT) and other sources suggests that a tiny sliver of affluent families—the top 1 percent by income—will receive tax cuts totaling $1.02 trillion over the next decade. For comparison, the bill’s cuts to the Medicaid health care program will total $930 billion over the same period.
Explanation of Calculation
The foundation of our calculation is JCT table JCX-33-25, published on July 1. This table includes tax distributional data by income level, including for the top 1 percent, for select years. While the bill underwent very minor changes after publication of this table, those changes added to the bill’s tax cuts overall and thus made the table a conservative starting point for estimating the tax cuts flowing to high-income people.
The JCT table reports that federal taxes paid by the top 1 percent of taxpayers will fall by $132 billion in 2027, $105 billion in 2029, $93 billion in 2031, and $93 billion in 2033. Taken together, this amounts to $422 billion in tax cuts for the top 1 percent during these years.
But this figure is incomplete in two important respects. First and most obviously, these data only cover 4 years out of the 9.25 years remaining in the 10-year budget window. And second, JCT excludes approximately 3 percent of the net tax cut from its distributional analysis because it lacks data to distribute certain provisions across the income scale.
To fill these gaps and obtain a comprehensive picture over the 10-year budget window, we first turn to JCX-35-25 which contains JCT’s detailed, line item revenue estimates for the population as a whole under the bill as passed by the Senate.
Partly this stage of the work involves going through the revenue score provision by provision to identify items phasing in or out that would not be fully captured in the years contained in JCT’s distributional data. And partly it involves identifying the overall arc of the tax cut trajectory over time for provisions impacting the top 1 percent and using that trend to fill in years missing from JCT’s distributional tables. For example, it is apparent in the JCT data that the trend around 2028 is toward slightly smaller tax cuts as the initial impact of certain business provisions wanes and the cancellation of green energy provisions begins to take a larger bite out of the overall tax cut. As a result, we forecast that the overall tax cut going to the top 1 percent in 2028 will be somewhat smaller than in 2027. For the beginning and end of the budget window where JCT’s revenue estimates are clouded by incomplete and partial year effects, we supplement the JCT data with information from the official Congressional Budget Office forecast of growth in income flowing to the top 1 percent and use that as an input in calibrating our tax cut totals.
The final stage of the calculation requires distributing the provisions that are omitted from JCT’s analysis. Some of those are provisions geared toward businesses that largely affect owners of capital while others are capital gains tax preferences. We determine the distributional impact of terminating the clean vehicle credit based on information from the Federal Highway Administration. The single largest provision omitted from the JCT distributional tables is the bill’s estate tax cut, which is heavily skewed toward high-income families and which we distribute using our estate tax model, which was constructed using data from the IRS and the Federal Reserve’s Survey of Consumer Finances.