As we approach the end of the year, we want to lift up the tax charts we published in 2022 that received the most engagement from readers. Covering federal, state, and corporate tax work, here are our top 5 charts of 2022. It’s worth noting that the biggest tax news of 2022 – the adoption of a federal 15 percent corporate minimum tax in the Inflation Reduction Act – should make charts 1 and 3 below look much better after the new law is implemented.
1. Amazon’s Tax Avoidance
Our first chart details how Amazon avoided about $5.2 billion in corporate federal income taxes in 2021 while reporting record profits. (From Amazon Avoids More Than $5 Billion in Corporate Income Taxes, Reports 6 Percent Tax Rate on $35 Billion of US Income)
Amazon’s 2021 federal income tax payment is comparatively significant for a profitable company that paid less than $0 in the first year of the Trump-GOP tax law. But the company’s continuous tax avoidance adds up over time. Over the past four years, Amazon reported a total federal tax rate of just 5.1 percent on over $78 billion of U.S. income.
2. Momentum for State Child Tax Credits and Earned Income Tax Credits
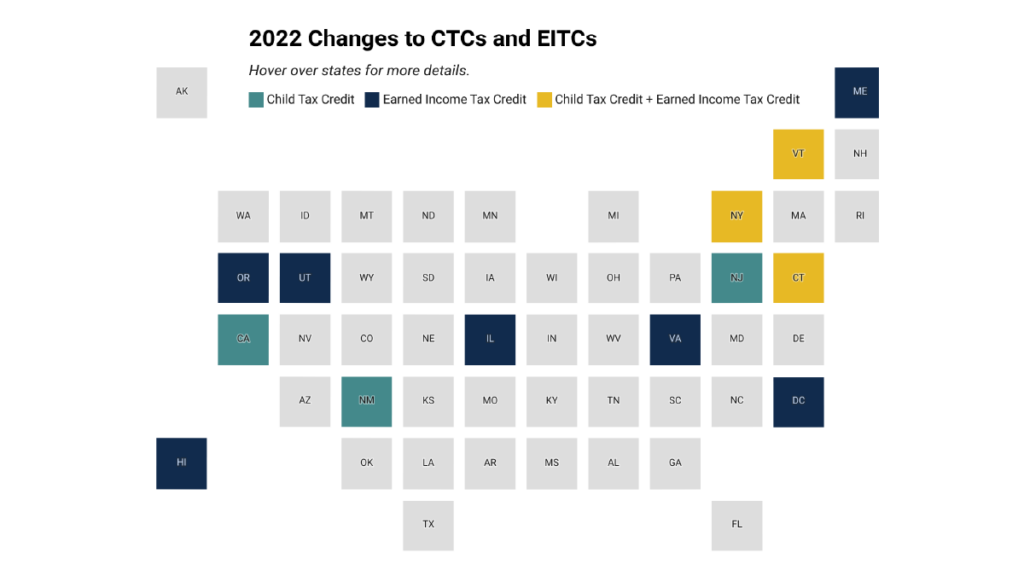
Meanwhile, in 2022 nearly two dozen states helped boost the economic security of low- and moderate-income families by creating or expanding Child Tax Credits or Earned Income Tax Credits (From Legislative Momentum in 2022: New and Expanded Child Tax Credits and EITCs) Note: this information has been updated in a series of briefs you can find here and here.
Some states pushed tax cuts for their wealthiest, disproportionately white residents this year. The states highlighted here took a more equitable path forward, one that targets assistance to families of all races and pushes back against economic and racial inequality.
3. Netflix’s Tax Avoidance
Our third chart focuses on another major corporate tax dodger: Netflix. It details how the streaming giant reported an effective federal corporate income tax rate of 1.1 percent in 2021 on $5.3 billion in profits, avoiding more than $1 billion in taxes that year alone. (From Netflix Posts a Record $5.3 Billion in Profits and a Federal Tax Rate of Just 1.1 percent)
At a time when many small businesses have faced pandemic-related challenges, Netflix is among the large corporations that has handsomely profit from changing consumer behavior. Its 2021 pre-tax U.S. income of $5.3 billion was almost twice the record-breaking $2.7 billion in profits it enjoyed in 2020. The company’s federal income tax bill for that year was $58 million, or just 1.1 percent of its pre-tax profits for the year and a pittance compared to the $1.1 billion it would have paid at the statutory federal rate of 21 percent. In other words, the company avoided more than $1 billion in taxes in 2021.
4. Rick Scott’s Proposed Tax Hike on Low-Income Americans
Our fourth chart shows how Sen. Rick Scott’s “skin in the game” proposal to require all Americans to pay federal personal income taxes would increase taxes by more than $1,000 on average for the poorest 40 percent of Americans. (From State-by-State Estimates of Sen. Rick Scott’s “Skin in the Game” Proposal)
As illustrated here, most of the resulting tax increase in the United States would be paid by the poorest 40 percent of Americans. The poorest fifth of Americans would pay 34 percent of the tax increase while the next fifth of Americans would pay 45 percent of the tax increase.
5. Extreme Wealth Inequality is Big and Growing Problem
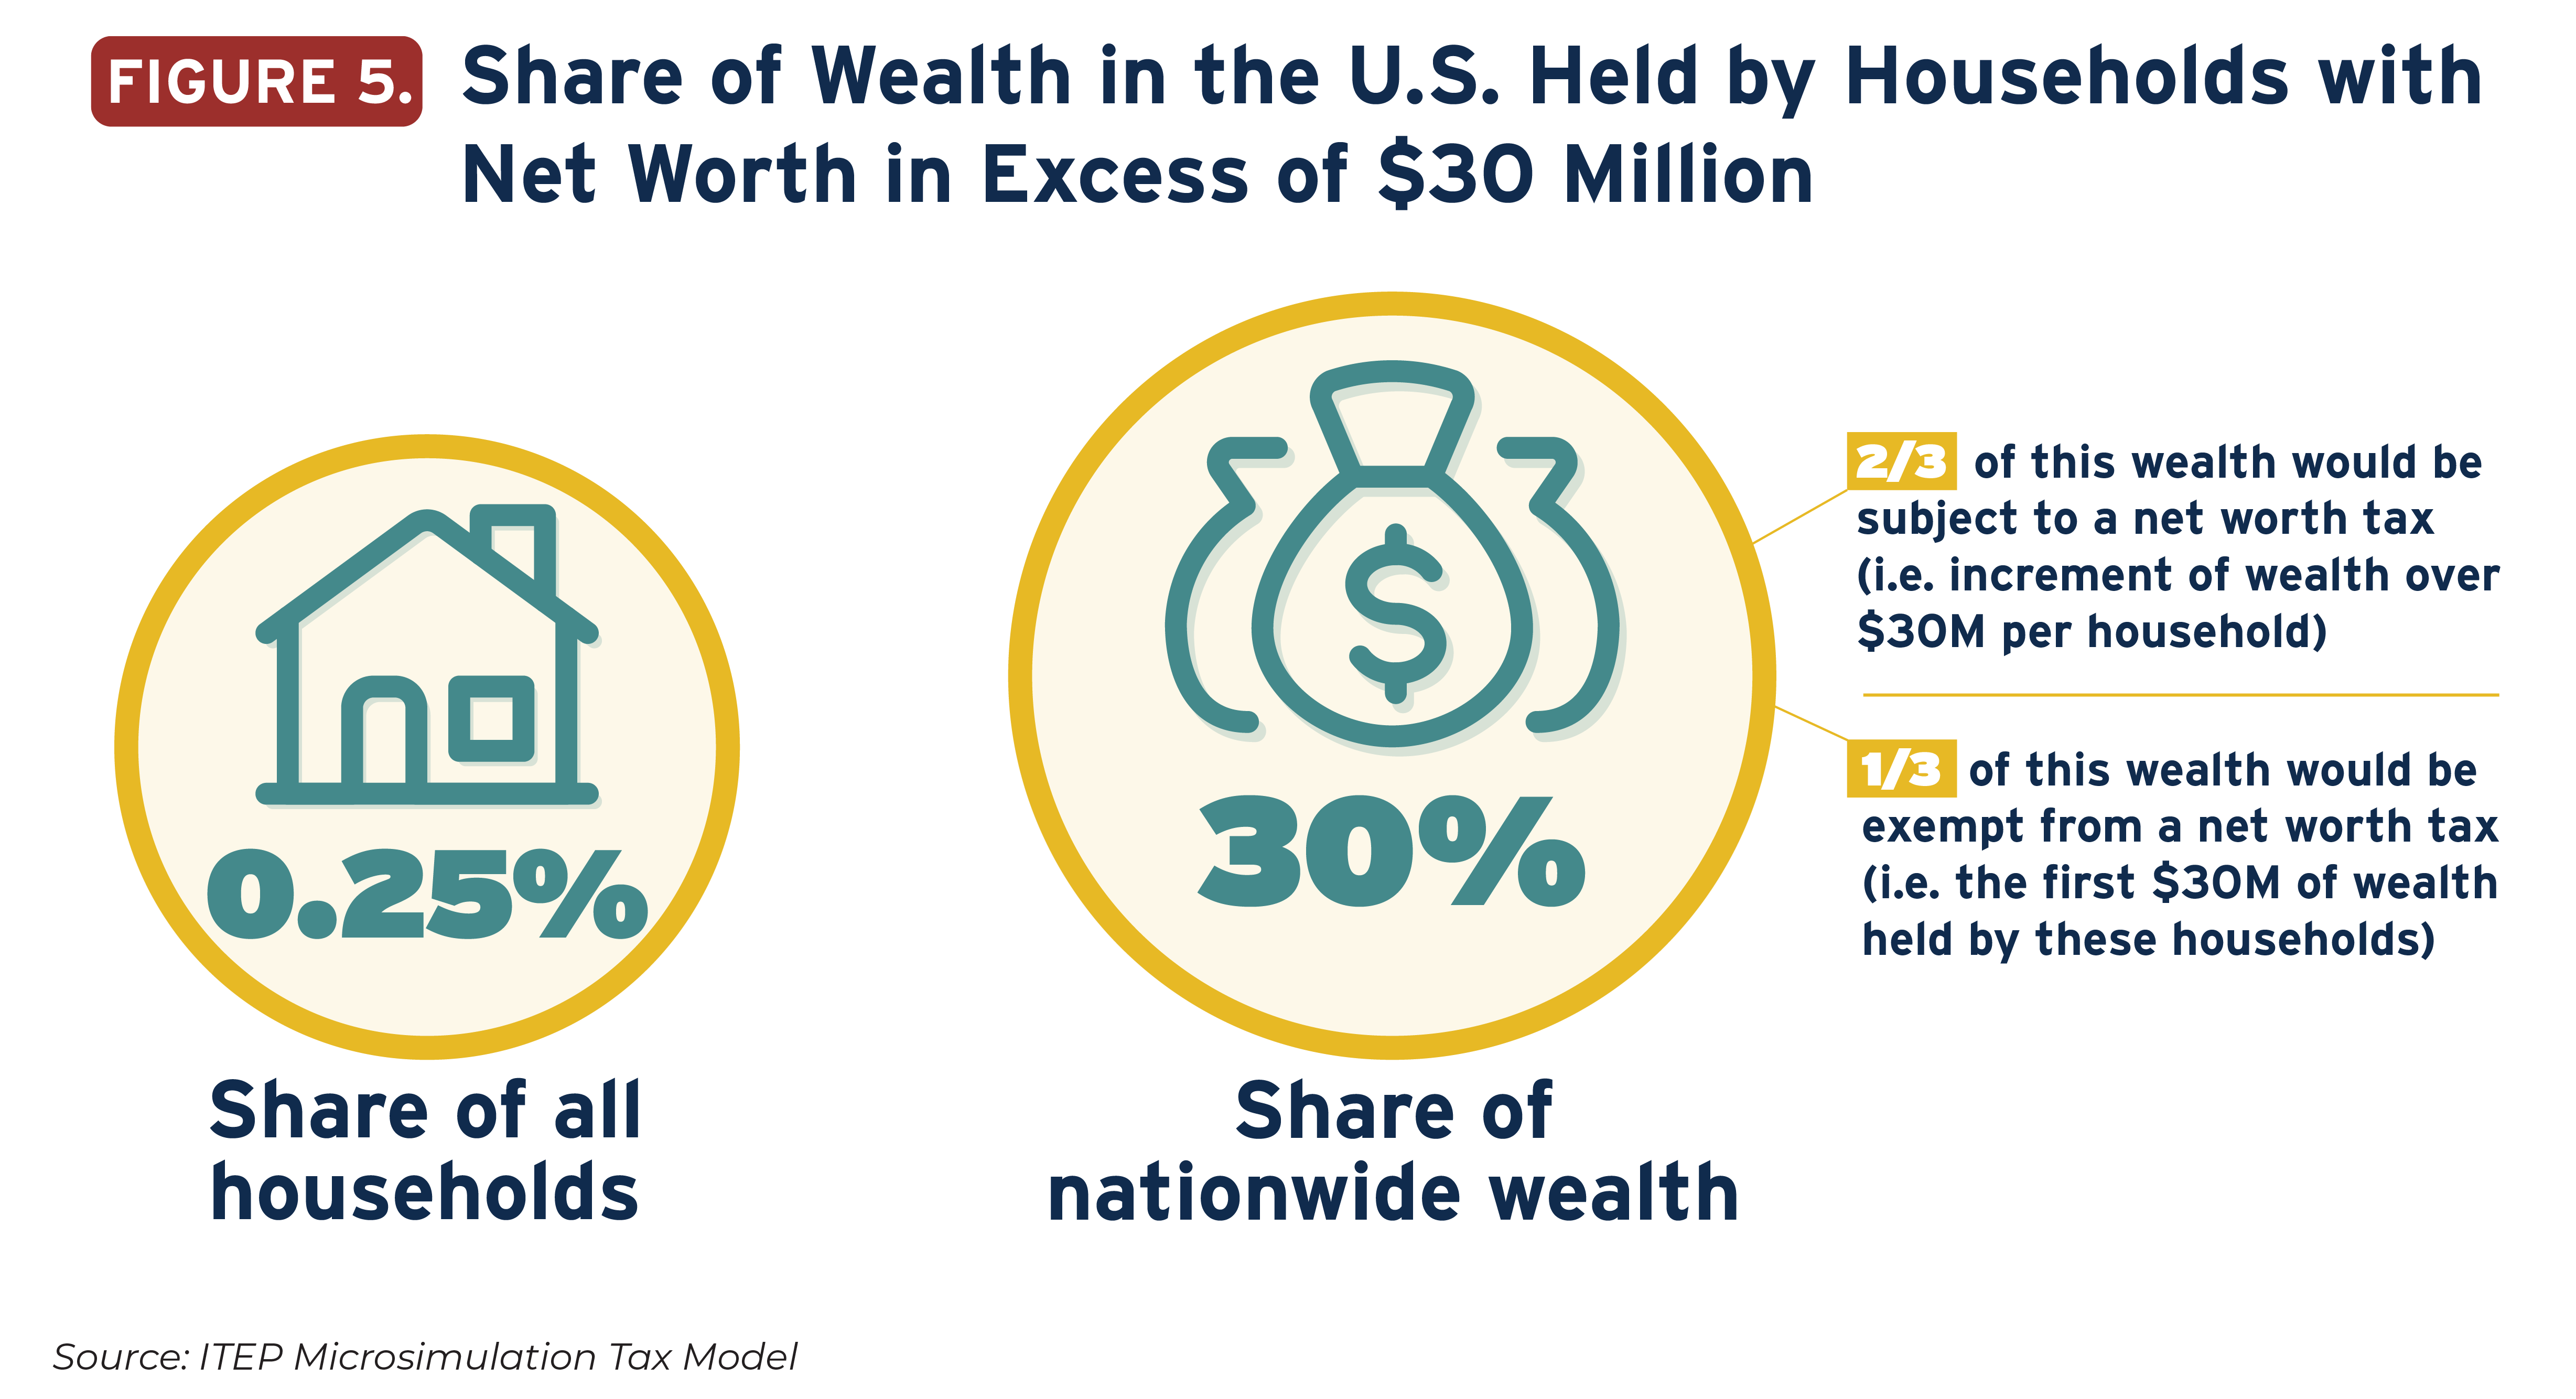
Our final chart – using the term “chart” liberally here – is from our pathbreaking report showing the geographic distribution of extreme wealth in the states. It shows 30 percent of this country’s wealth is held by the extremely few households (0.25 percent, to be exact) with total wealth over $30 million. (From The Geographic Distribution of Extreme Wealth in the U.S.)

Of the $39 trillion in total wealth held by families with net worth above $30 million, almost $17 trillion of that—or 43 percent of the total—takes the form of unrealized capital gains.


