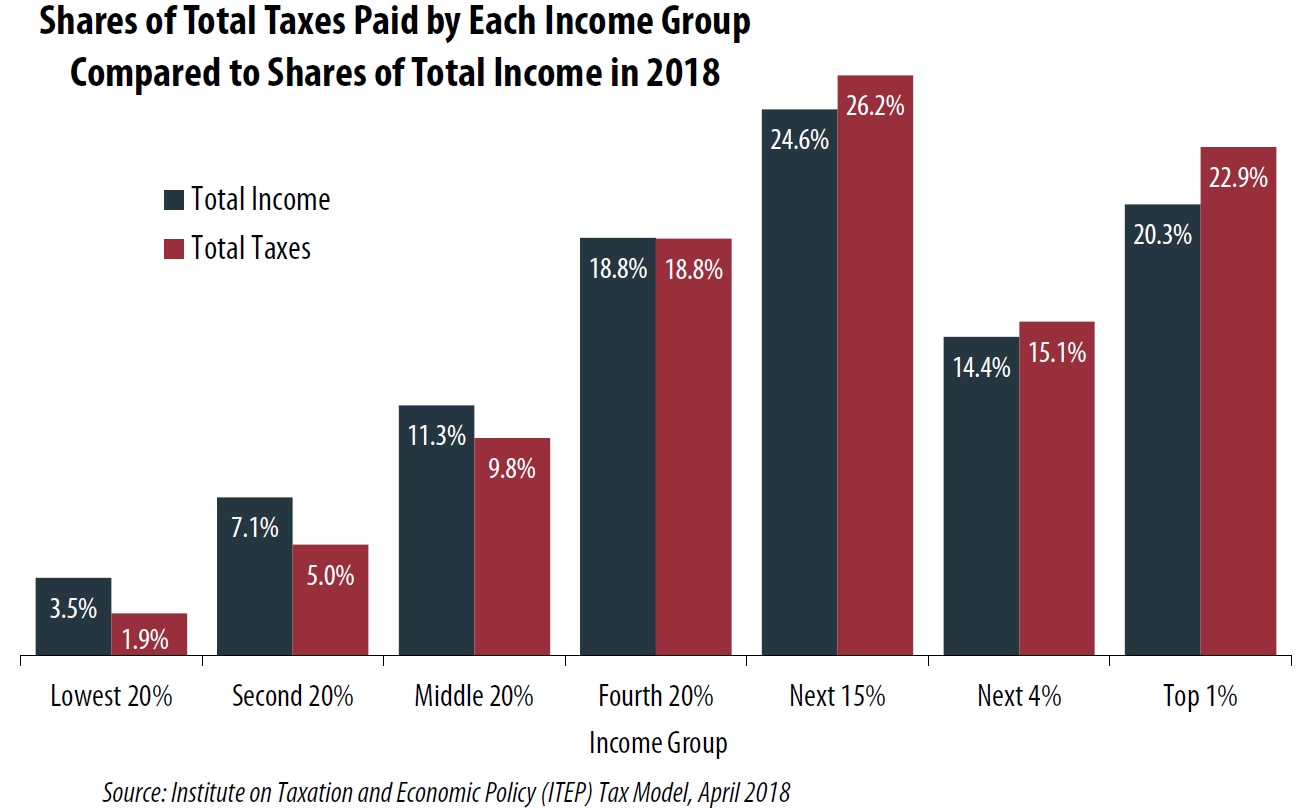
America’s tax system overall is marginally progressive. The share of all taxes paid by the richest Americans slightly exceeds their share of the nation’s income. Conversely, the share of all taxes paid by the poorest Americans is slightly smaller than the share of the nation’s income going to that group.
As illustrated in the graph below, in 2018 the richest 1percent of Americans will pay more than a fifth of all taxes in the U.S. (22.9 percent), but this same group will also receive more than a fifth of the nation’s income (20.3 percent). The poorest fifth of Americans will pay a small fraction of the nation’s taxes (1.9 percent) but will receive a small fraction of the nation’s income (3.5 percent).
Some Americans have the impression that our nations’ tax system is much more progressive than it is partly because the tax on everyone’s mind around Tax Day is the federal personal income tax, which is relatively progressive. But Americans pay several types of taxes at the federal, state and local levels, and many of them are regressive, meaning they capture a larger share of income from low- or middle-income families than from wealthy families.
Regressive taxes are paid by virtually all Americans. This is especially true of state and local taxes. In most states, anyone who buys a product from a store or online is required to pay sales tax. Property taxes are paid by homeowners and anyone who rents because landlords pass property taxes on to their tenants. Anyone who drives must pay state (and federal) gas taxes unless they have an electric car. Most state income taxes are not sufficiently progressive to balance out the regressive impact of these other taxes, and not all states have income taxes.
Federal taxes are not all progressive either. For example, the federal Social Security payroll tax is paid at a flat rate on wages by everyone who works, and wages beyond a certain level ($128,400 in 2018) are exempt.
The federal personal income tax does have a progressive rate structure and has some features such as the Earned Income Tax Credit and the Child Tax Credit that benefit families whose income is too low to be subject to personal income tax. These tax credits can offset some of the regressive impact of federal payroll taxes and state and local taxes. Other progressive federal taxes include the corporate income tax (which is mostly borne by owners of corporate stocks and other business assets) and the federal estate tax (which only applies to the very largest estates) among others.
The combination of these different taxes results in an overall tax system that is slightly progressive, as illustrated on the previous page and in the graph below, which provides the effective total tax rate for each income group. This is calculated as the total federal, state and local taxes paid by a given income group divided by the total income of that group.
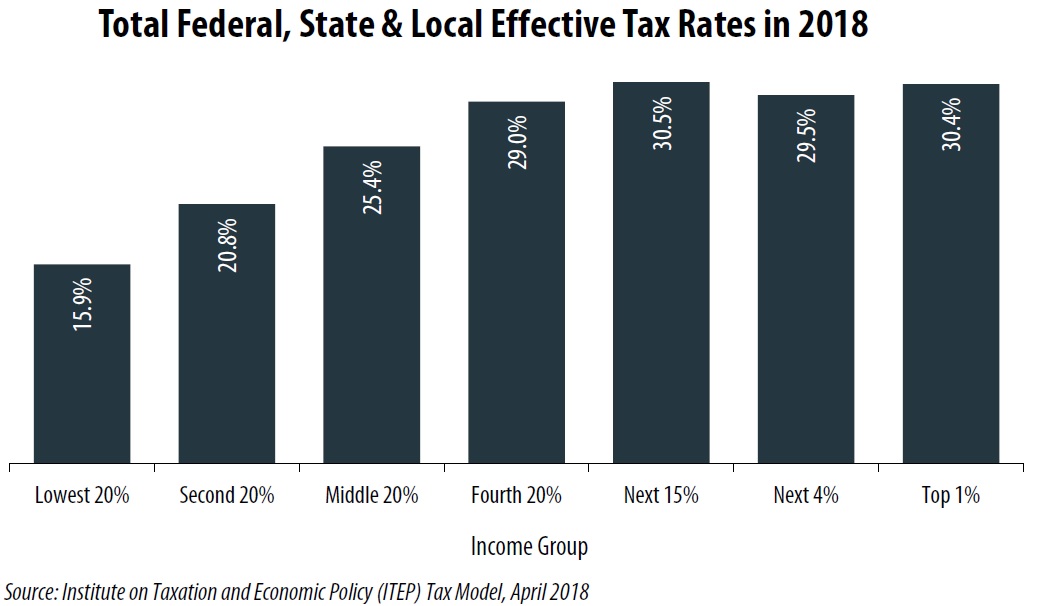
As illustrated in this graph, the middle 20 percent of Americans will pay 25.4 percent of their income in taxes (including federal, state and local taxes). This is not all that much lower than the effective tax rate of the richest one percent (30.4 percent).
The figures provide a picture of America’s overall tax system. There is, of course, much variation among state tax systems. There is also much variation between different types of taxpayers within the federal tax system. For example, the federal personal income is progressive but nonetheless contains special breaks such as the lower rates applied to capital gains and stock dividends, which mostly help high-income individuals. A person who lives entirely on investment income could therefore pay a lower effective rate than a person who works for a living and has a much smaller income. Likewise, the federal corporate income tax is a progressive tax, but nonetheless contains loopholes that weaken its progressive effect. For example, a person who owns stock in an American multinational corporation might benefit from the loopholes that allow the company to shift profits to offshore tax havens where they will not be taxed.
The New Tax Law
In December of 2017, President Trump and Congress enacted the Tax Cuts and Jobs Act (TCJA), which reduced taxes for most (but not all) taxpayers in 2018. (In later years, the law will raise taxes for many more Americans unless Congress acts.) The graph below compares the effective total tax rates that would apply in 2018 if TCJA had not been enacted to those in effect now.
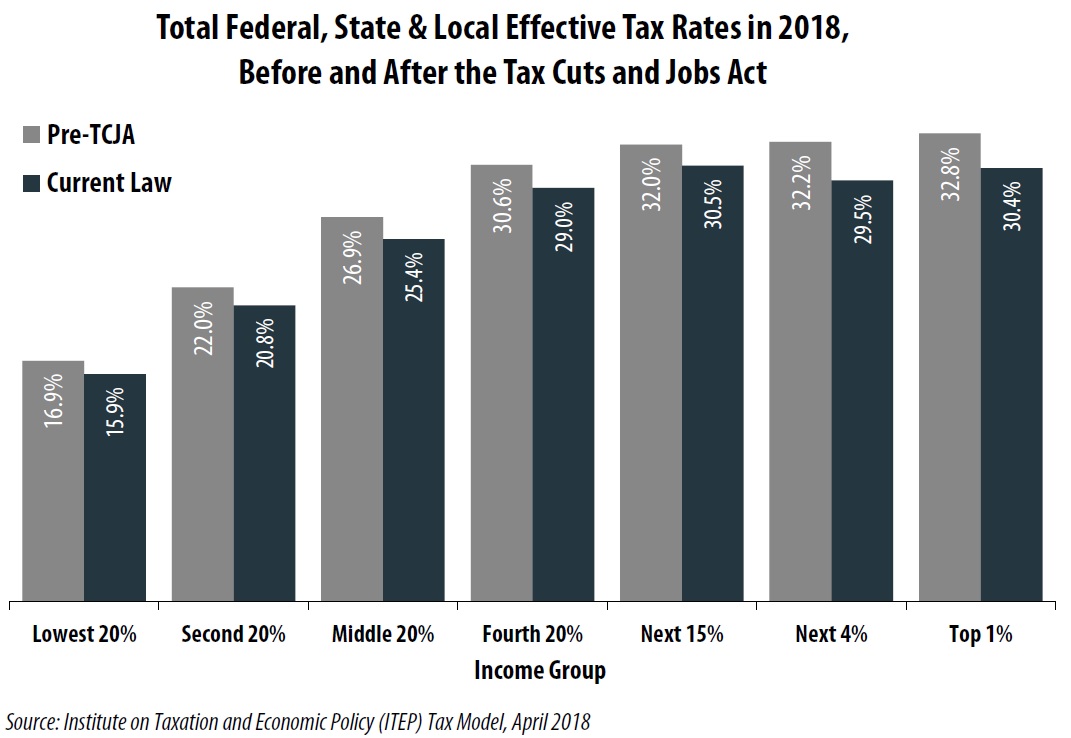
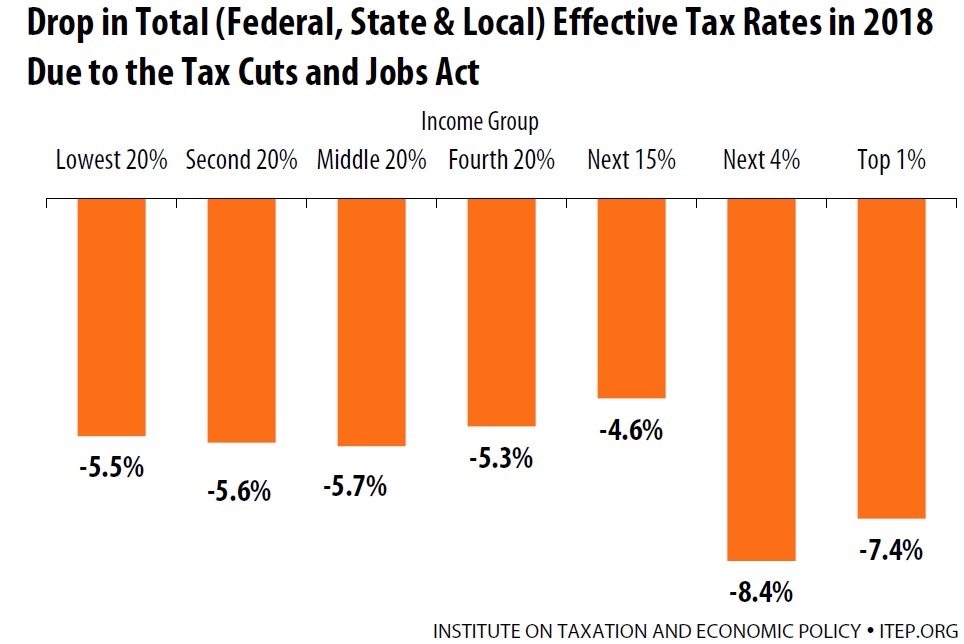
As illustrated in the graph below, the drop in effective tax rates due to TCJA is more dramatic for high-income households. For example, in 2018 TCJA reduced the typical total effective tax rate paid by 5.5 percent for the poorest fifth of Americans and by 5.7 percent for the middle fifth of Americans. The reductions in effective rates were higher for the richest households — 7.4 percent for the richest 1 percent and 8.4 percent for the next richest 4 percent. For more information on why the new tax law’s benefits are so skewed to the well-off, see ITEP’s recent report about the Tax Cuts and Jobs Act.

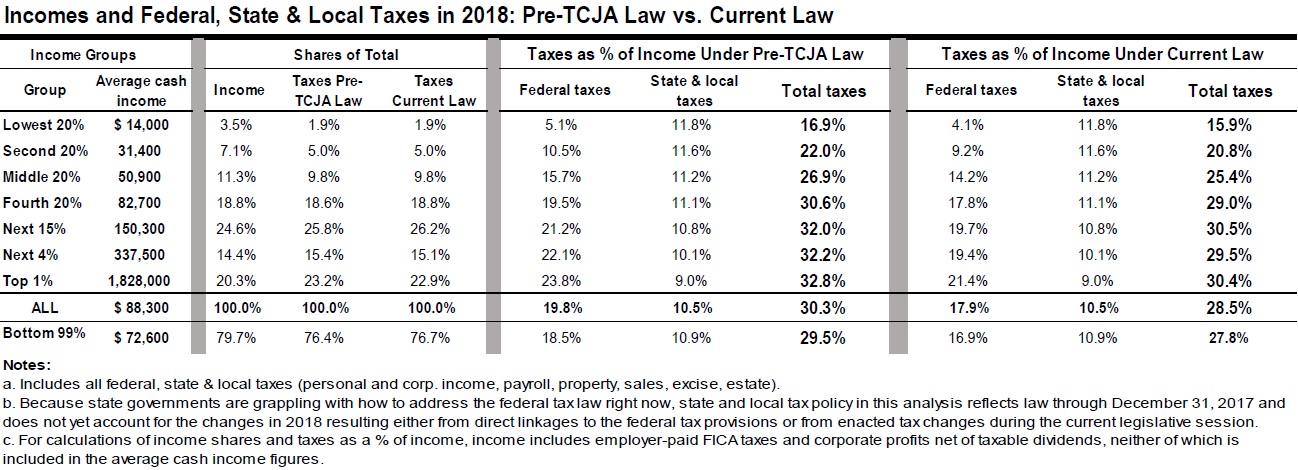
The table below includes figures that appear in these graphs plus additional detail.