Key Findings
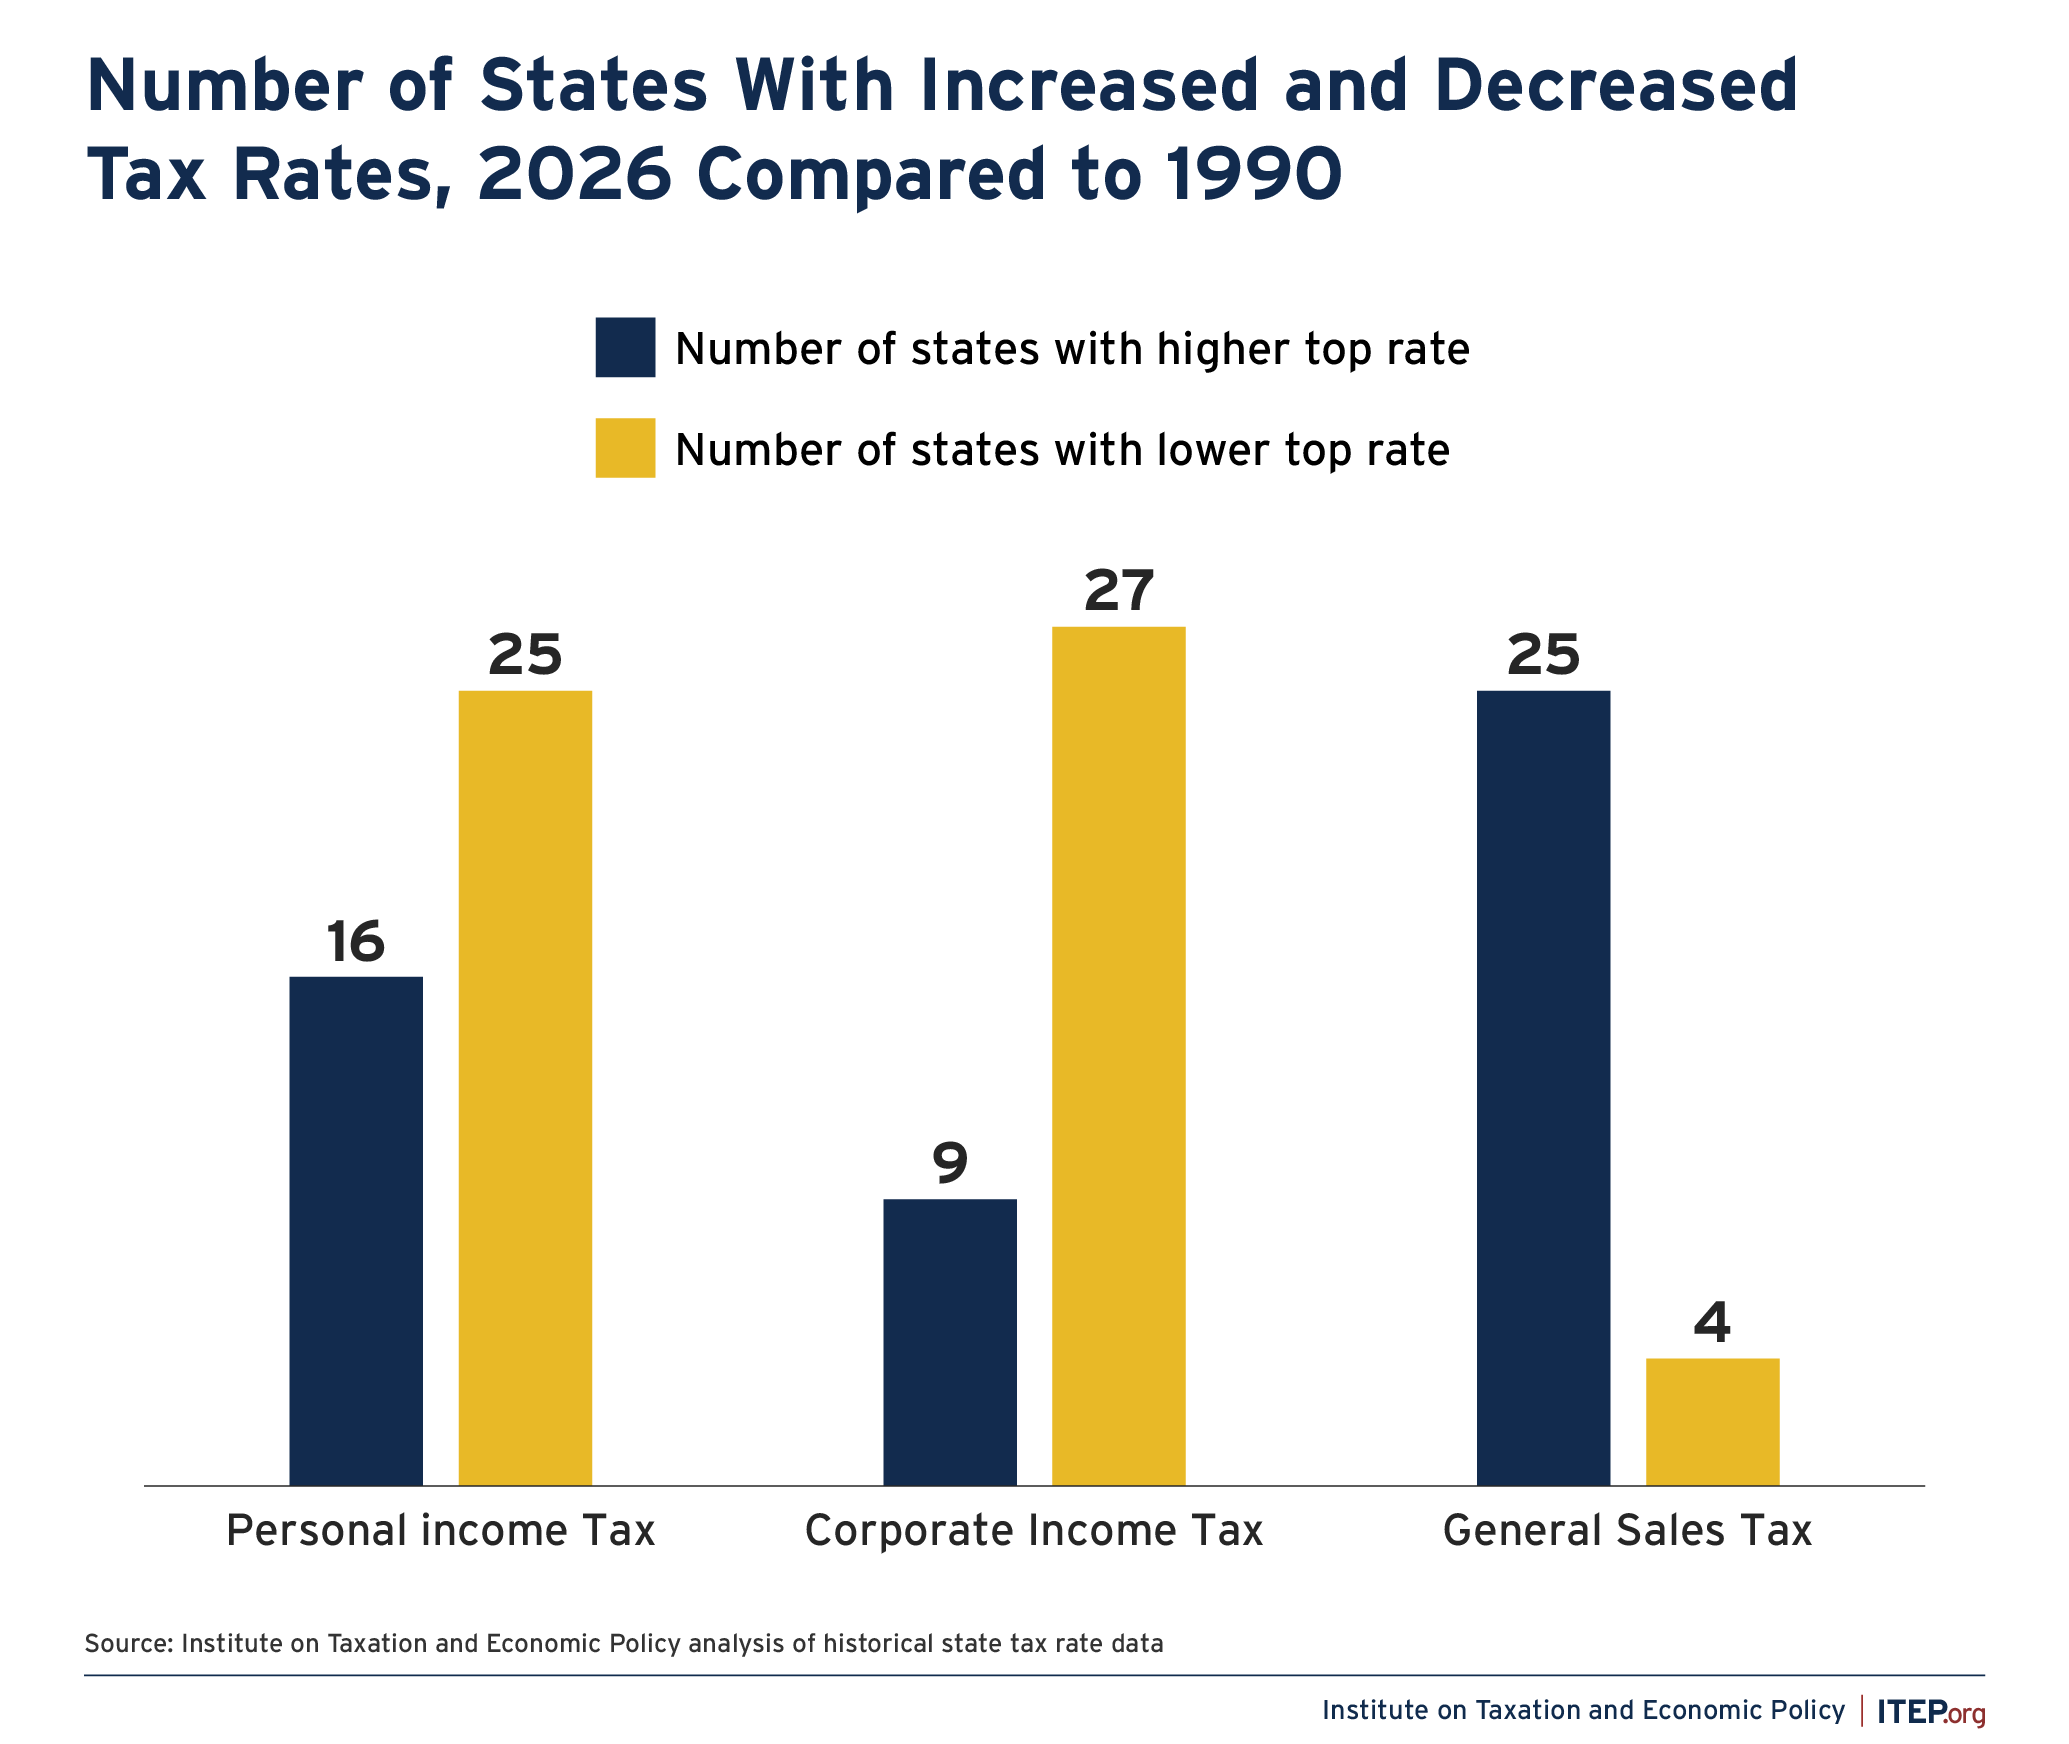
- Since 1990, state lawmakers have cut top personal income tax rates 210 times and top corporate tax rates 168 times.
- Over the same time, lawmakers have increased top personal income tax rates 73 times and top corporate tax rates 42 times.
- Since 1990, states have increased sales tax rates 68 times while decreasing them just 29 times.
- Today the typical state’s top personal and corporate income tax rates are lower than in 1990, while its sales tax rate is higher.
- Adjusting for deductibility of federal income taxes, the median top state tax rate for individual income taxes has fallen from 6 to 4.6 percent since 1990, while the median state corporate top tax rate fell from 7.2 to 5.9 percent over that same period.
- For states with a sales tax, the median state rate increased from 5 to 6 percent.
ITEP’s new Historical State Tax Rate Database offers a long-term view of how state tax systems have evolved. The database reveals that, in recent decades, many states have cut their most progressive taxes on high-income people and highly profitable businesses while raising their regressive levies on consumers’ everyday purchases. Other states, however, have decided to boost the tax rates they apply to affluent people and corporations. These varying trajectories have significant implications for the fairness and revenue adequacy of state tax codes.
Regressive Trends
States choosing to pursue deep income tax cuts have generally made their tax systems less responsive to taxpayers’ ability to pay and, in many cases, significantly reduced public revenues for core services like education and infrastructure. Moreover, their actions suggest a worrisome disconnect between voters, who largely think that high-income people should pay higher taxes, and state lawmakers, who have often voted to cut taxes for high-income people.
This disconnect is alarmingly common. Since 1990, state lawmakers have cut top personal income tax rates 210 times and top corporate tax rates 168 times, whereas lawmakers increased top rates of these taxes only 73 and 42 times, respectively. Sales tax rates have seen less activity since 1990, but states have been more inclined to increase rates (68 times) than decrease them (29 times).
Repeated cuts to top personal and corporate income tax rates have clearly tilted tax codes in favor of wealthy individuals and corporations in many states. Most families, of course, don’t ever pay their state’s top rate because their incomes fall below the top bracket, but they are affected by rising sales tax rates.
Figure 1
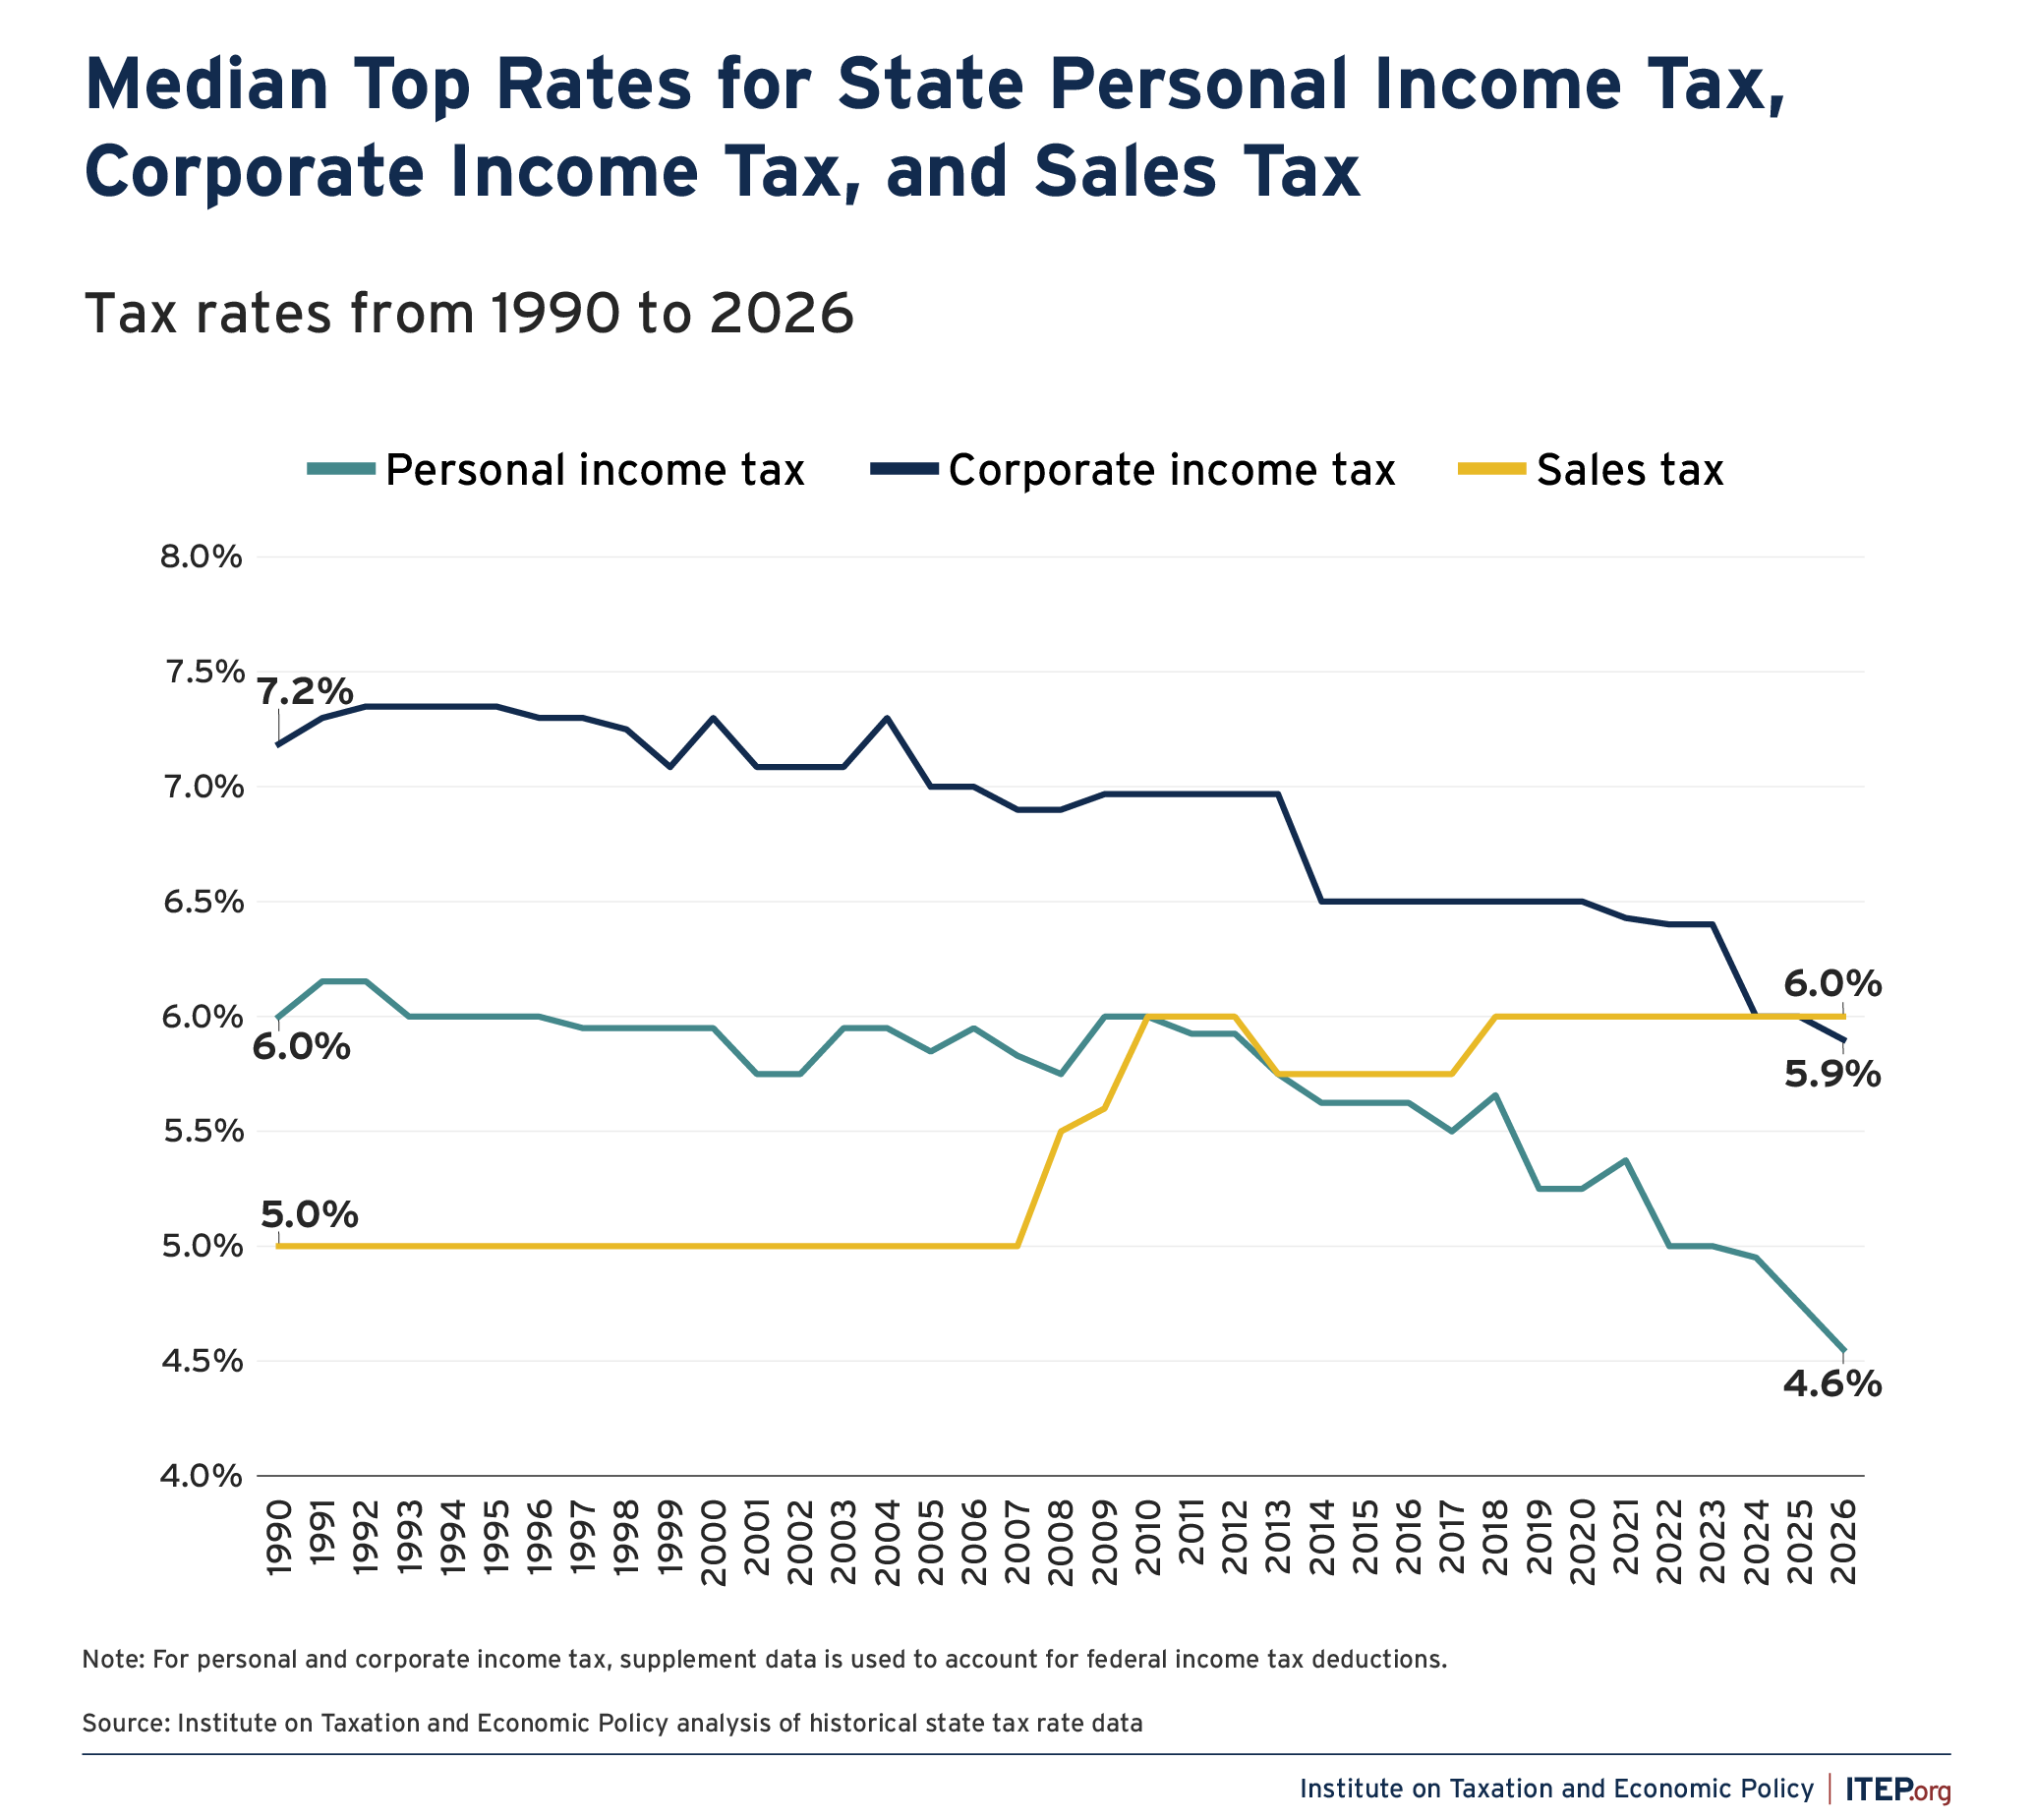
Today, the typical state’s top income tax rate is lower than it was in 1990, while its sales tax rate is higher. Adjusting for deductibility of federal income taxes, the median top state tax rate for individual income taxes has fallen from 6 to 4.6 percent since 1990, while the median state corporate top tax rate fell from 7.2 to 5.9 percent over that same period.1 For states with a sales tax, on the other hand, the median state rate increased from 5 to 6 percent.
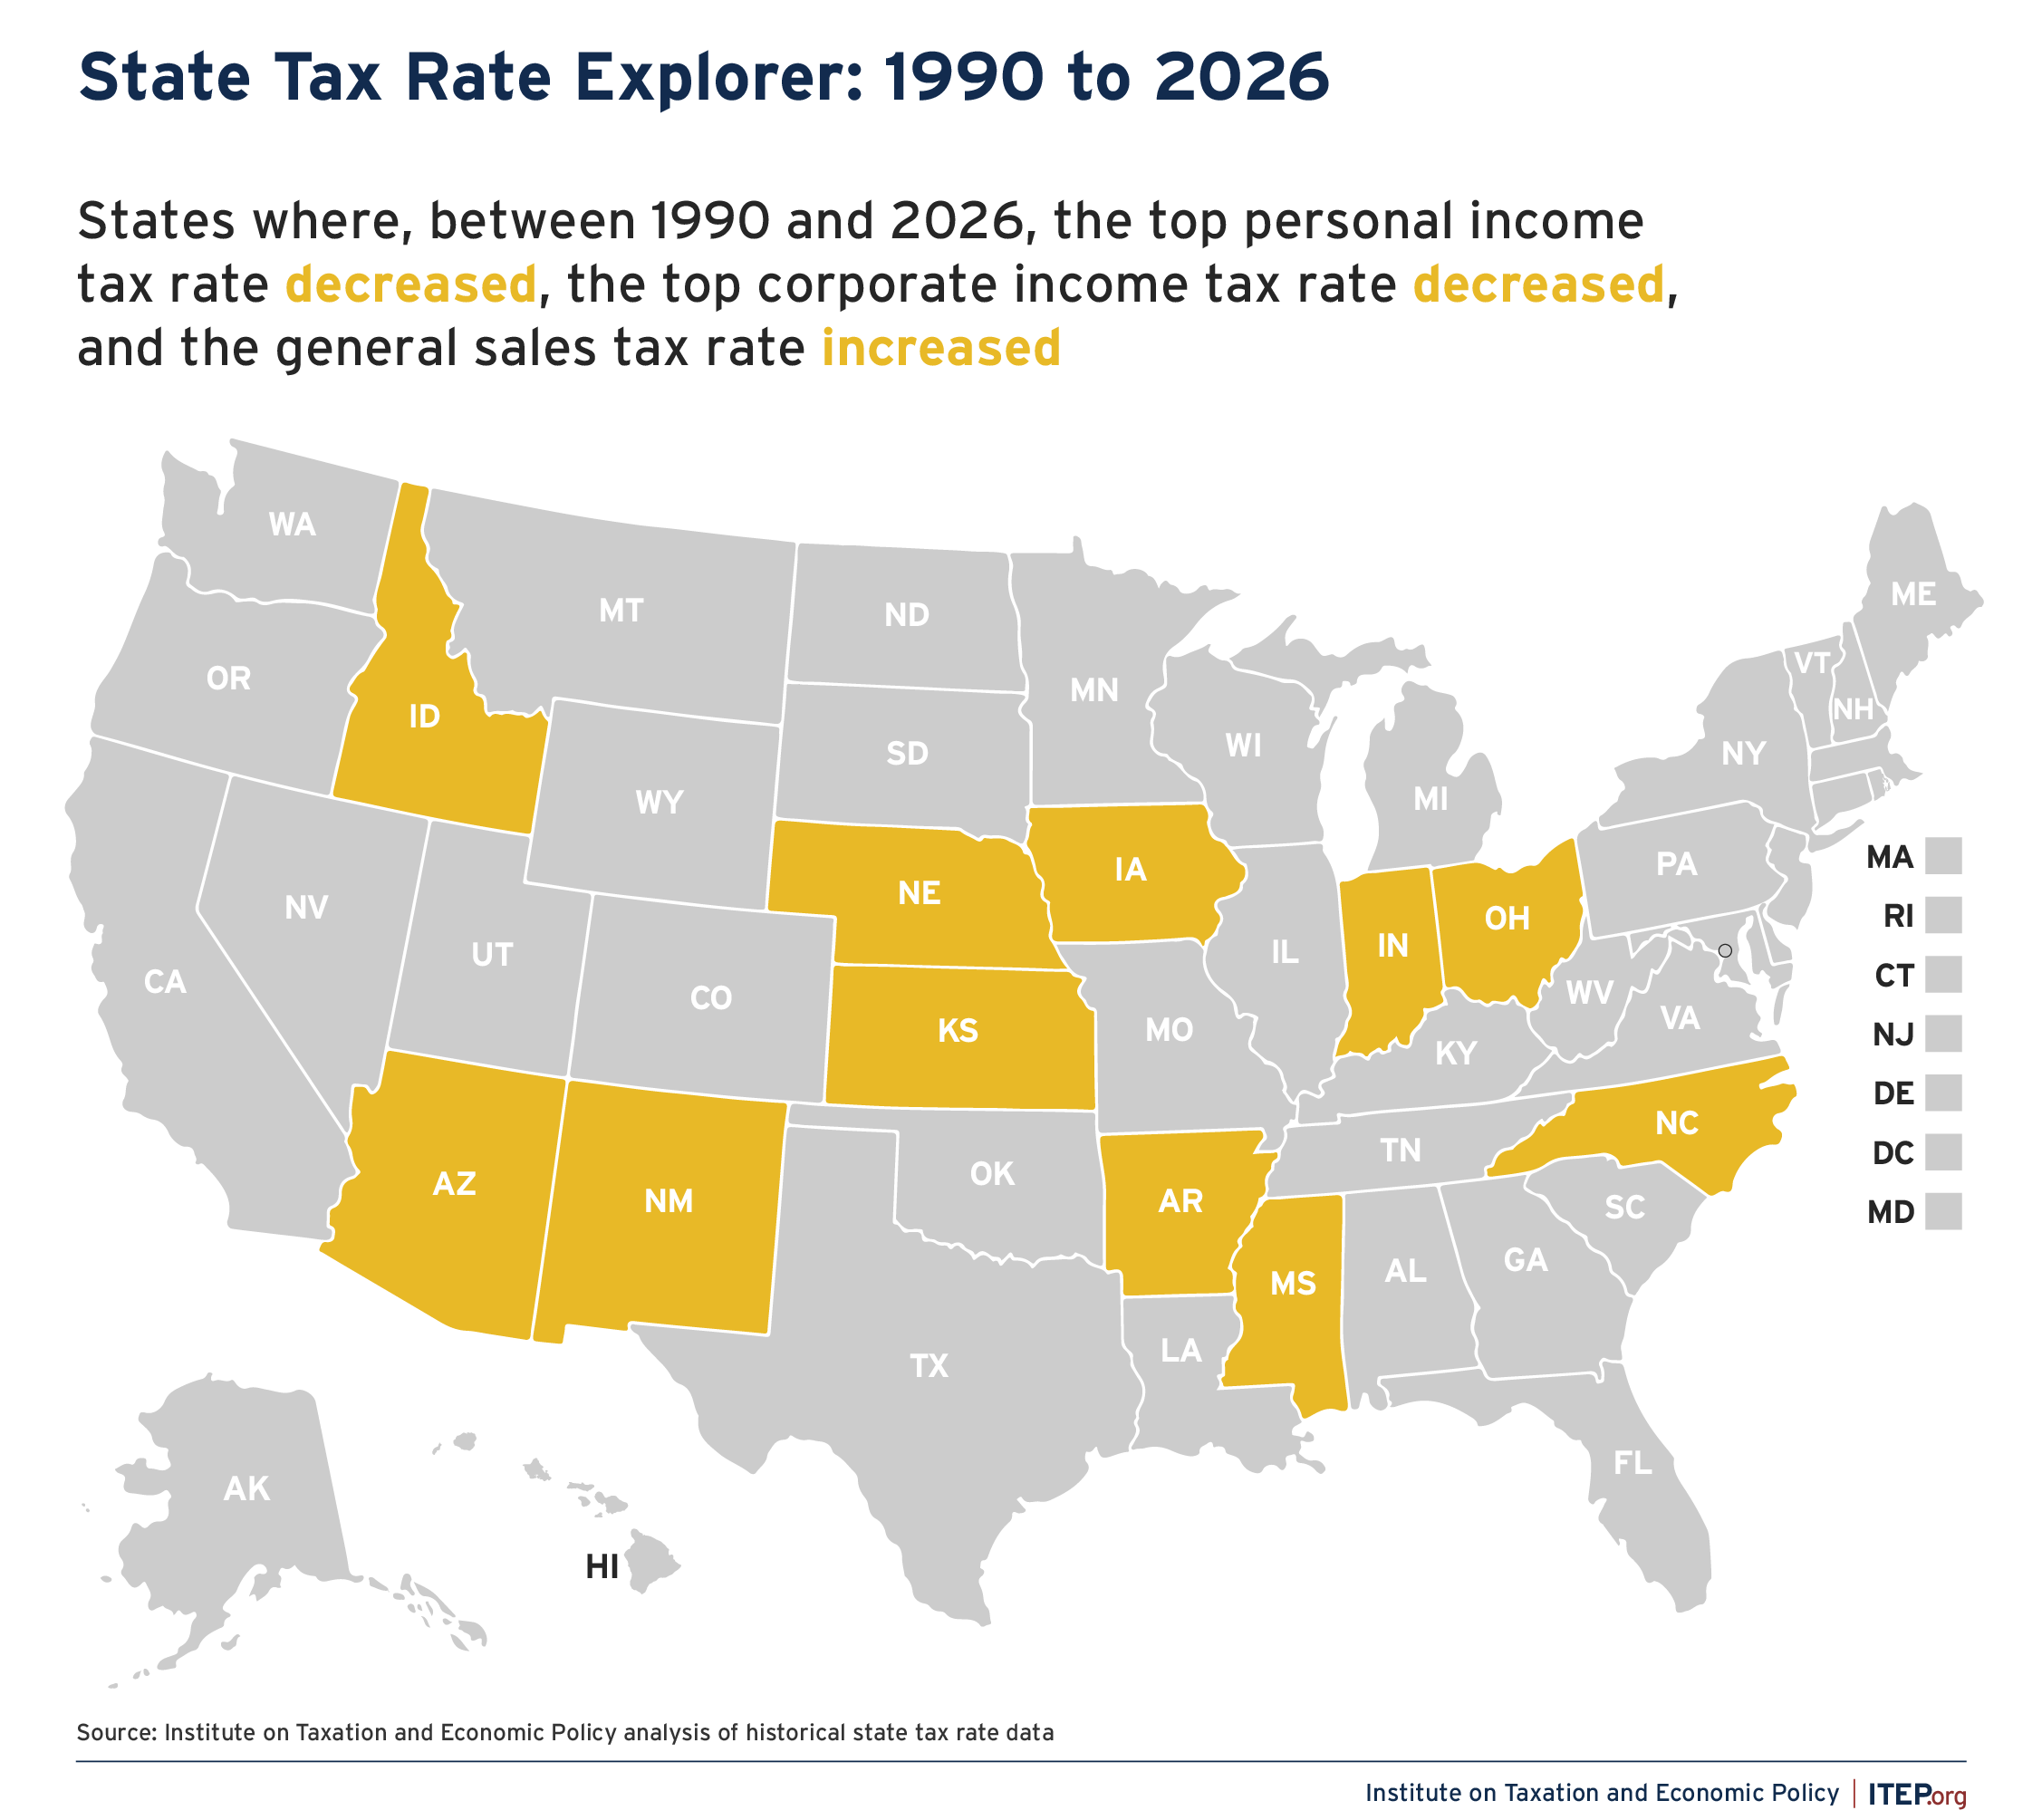
Our State Tax Rate Explorer reveals that eleven states are experiencing the full effect of this regressive tax swap, choosing to both cut top personal and corporate income tax rates and increase their sales tax rates since 1990. This combination of rate changes generally reduces taxes on wealthy households and profitable corporations while shifting more of the cost of services onto working families through greater reliance on the sales tax.
Figure 2
Progressive Trends
While many states have chosen to take their tax policy in a more regressive direction, other states have chosen the opposite course. As noted earlier, state lawmakers have increased top personal income tax rates 73 times since 1990, while they’ve increased corporate tax rates 42 times over that same period.
Notably, the states opting for income tax rate cuts lately have tended to have below-average populations, while many larger states have raised top income tax rates. The average state that cut its top personal income tax rate since 1990 has roughly half the population of the average state that increased its top rate over that period. Many larger states have raised income tax rates, typically on high-income people, to fund services and fend off further increases to regressive sales taxes.
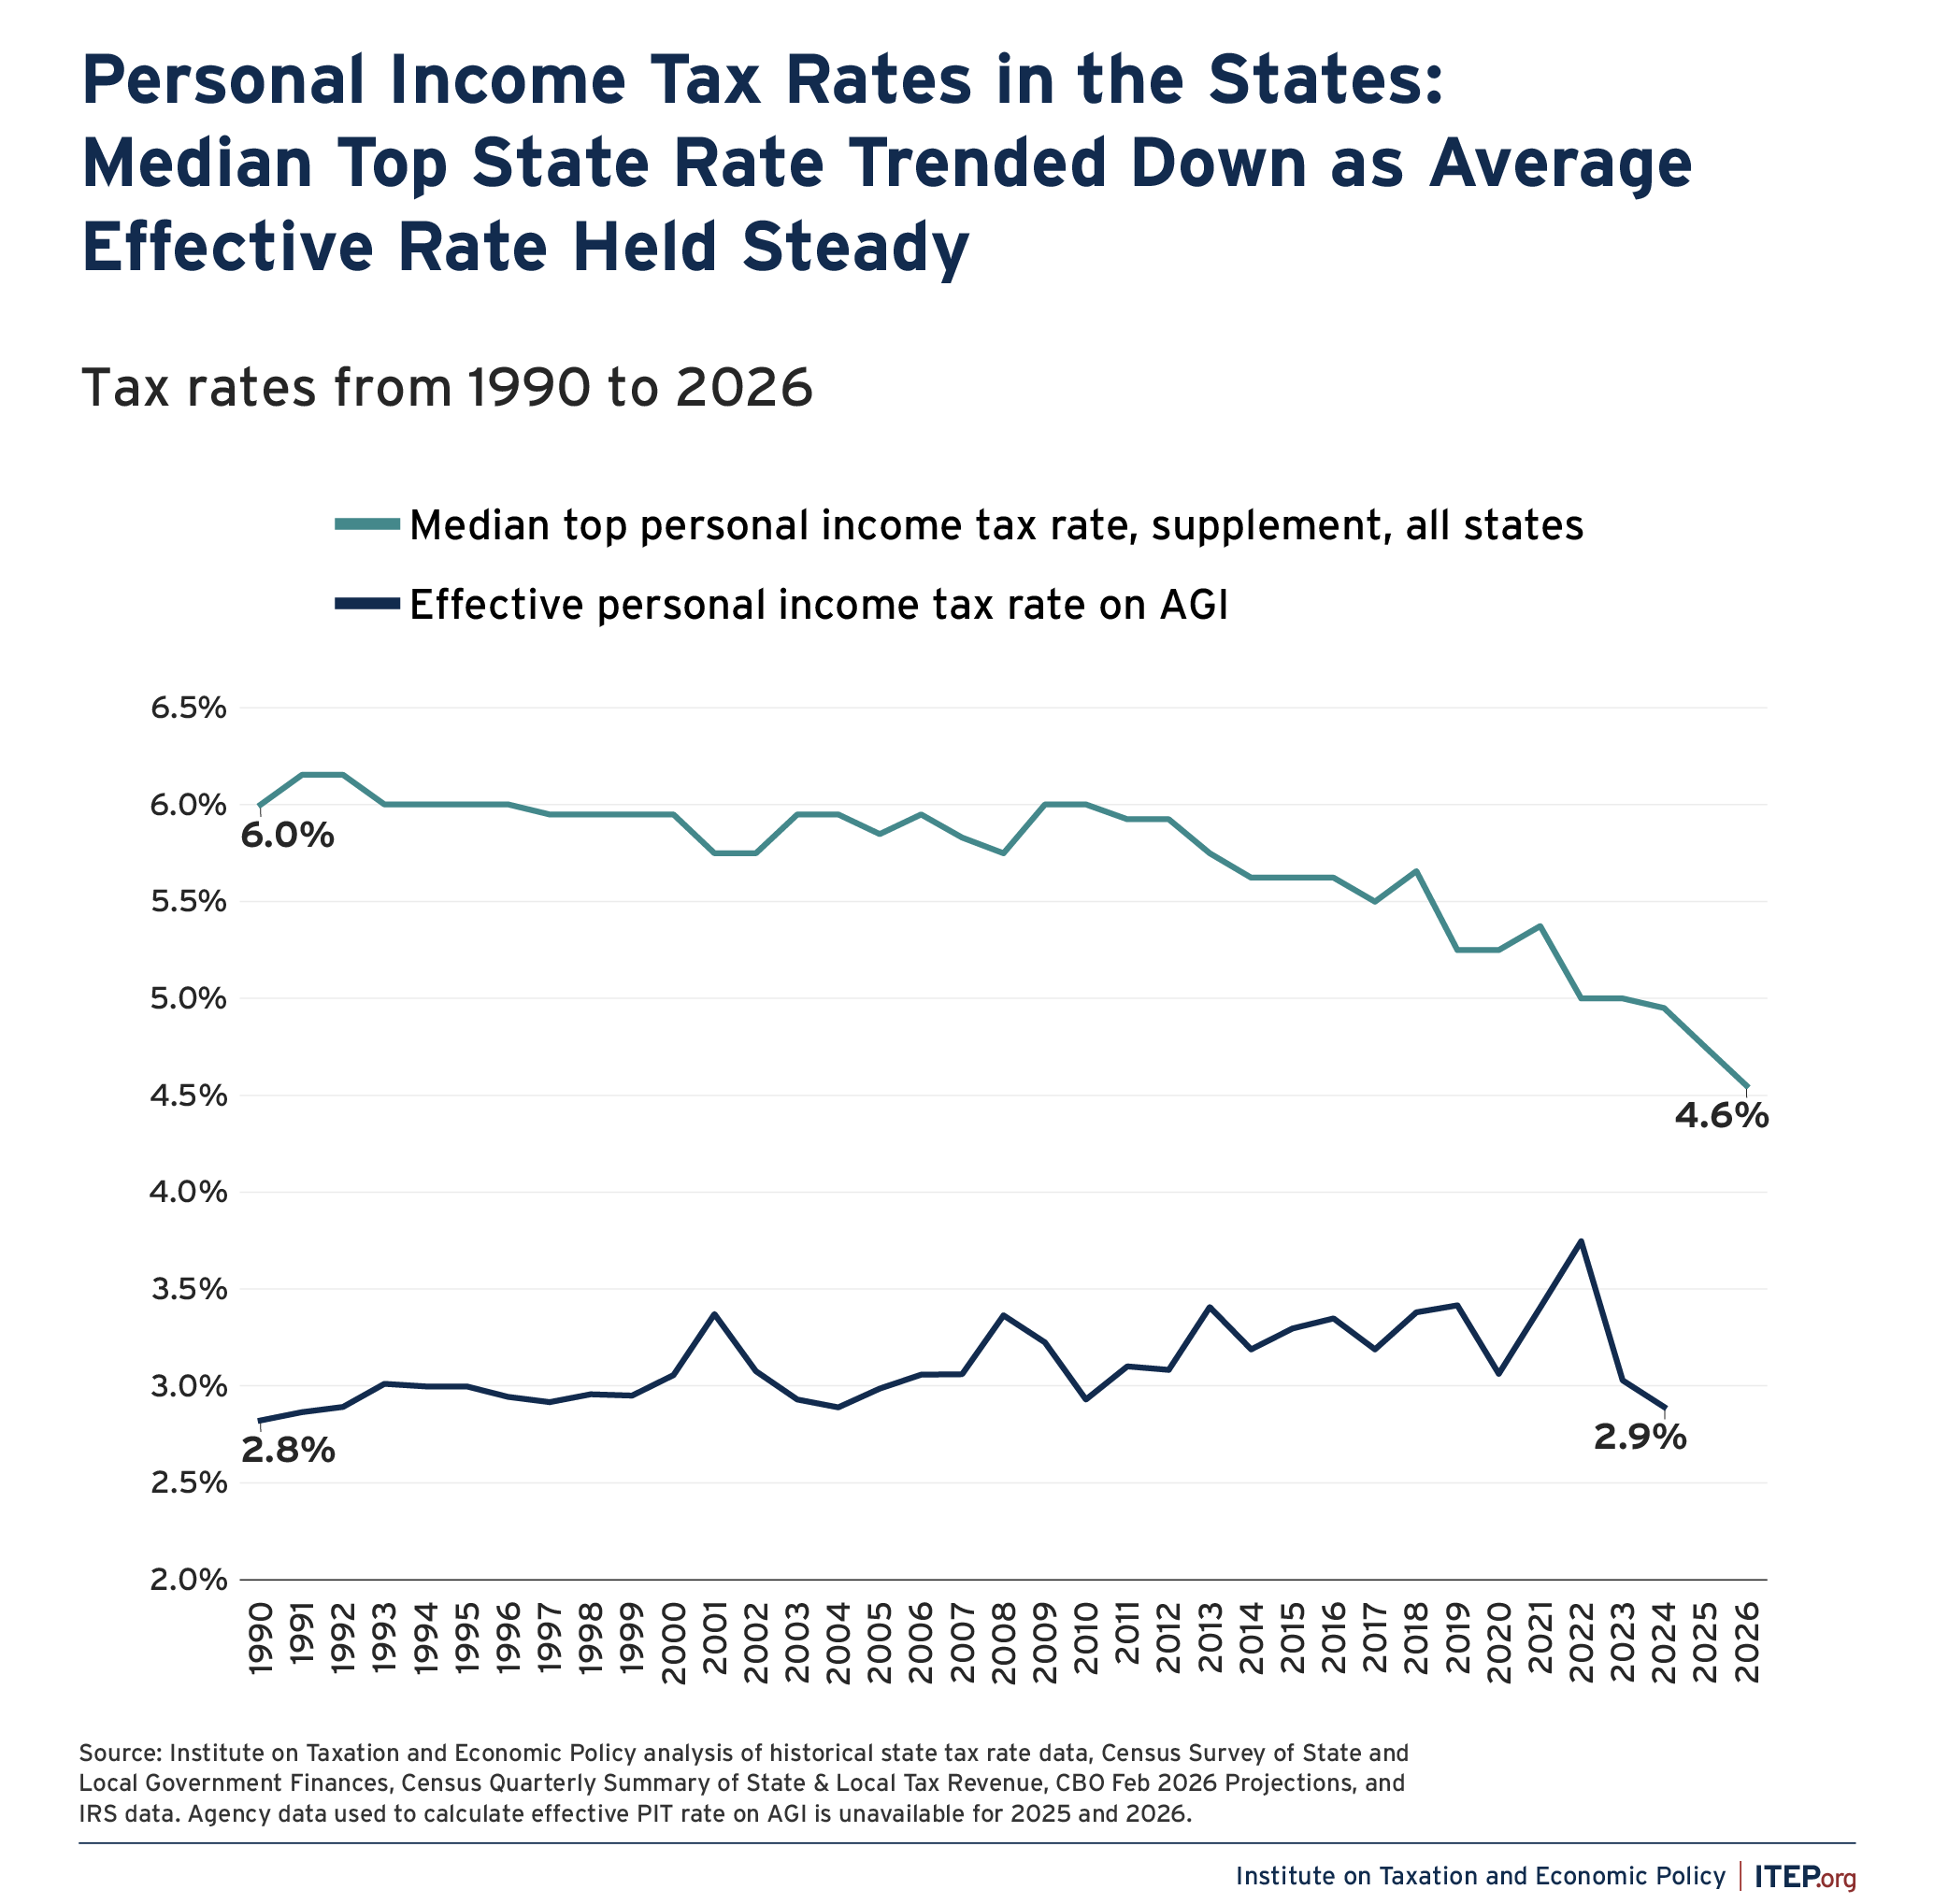
These increases in larger states partially explain why the average effective tax rate (that is, state income taxes paid divided by nationwide income) has held steady with time even as the median state’s top tax rate has fallen by nearly a quarter, as seen in Figure 3. Another reason for this is an explosion of income inequality. Our analysis of CBO data finds that the top 20 percent of Americans have captured 60 percent of income growth since 1990. This has positioned progressive income taxes for strong revenue growth over this period, even as some states have shaved down rates for their wealthiest residents.
Figure 3
Corporate Tax Trends
Top corporate tax rates have notably fallen in the states. Of the 45 states with a corporate income tax, 27 have cut their top rate since 1990. Ohio eliminated its tax entirely, replacing it with a less equitable gross receipts tax. These changes came against a backdrop of federal tax rate cuts as well: the federal corporate tax rate has fallen from 34 percent in 1990 down to 21 percent today.
Other states are making policy choices that have improved their corporate taxes. Michigan, for instance, reinstituted a corporate income tax in 2008 and eight other states increased their top corporate rate since 1990.
Additionally, several states have taken on reforms that don’t affect corporate tax rates but bolstered the tax by broadening the corporate tax base. The number of states with water’s edge combined reporting, for example, has increased from 16 to 28 since 1990. This reduces corporations’ ability to game state tax systems by shifting their taxable profits into tax haven states. A growing number of states have also taken steps in recent years to curb international corporate tax avoidance. These changes to state corporate tax bases are highly significant, though they are not included in our database of tax rate changes.
Figure 4
Sales Tax Trends
The trajectory of sales tax rates in the states looks markedly different. Forty-six states have a sales tax and, since 1990, these rates have been trending upward: 26 states hiked sales tax rates during this period, compared to only four that cut rates.
Despite these changes, sales tax revenue has remained nearly flat as a share of state and local tax collections: rising from 24 percent of such revenue in 1990 to 25 percent in 2023, according to the most recent data from the U.S. Census Bureau.
In part this is because Americans have increased spending on services, such as gym memberships and salon visits, that are often left out of state sales tax bases. While some states have broadened their bases to include more services, the expansions have generally been limited in scope. Lawmakers have tended to prefer raising sales tax rates over expanding the tax base to meet revenue needs.
The Big Picture
It is clear that states have made significant changes to the progressivity of their tax codes in recent years. ITEP’s most recent Who Pays? report found, for instance, that Massachusetts, Minnesota, and New Mexico all recently made significant improvements in lessening the regressive tilt of their tax codes by raising top income tax rates and expanding refundable credits for families with modest incomes. That 2024 report obviously can’t reflect changes since that time – this year alone, Washington, Rhode Island, Hawai’i, and Maine raised rates for those with income over a million dollars a year.
While not captured in our historic tax rate database, the movement toward state tax credits for working families has been a notable trend as well. More than half the states have now adopted Earned Income Tax Credits and more than a dozen have created state Child Tax Credits.
It is also true, however, that many states have recently taken major steps away from equitable taxation. In Who Pays?, ITEP quantified notable regressive developments in Arkansas, Arizona, Idaho, Kentucky, Nebraska, North Carolina, West Virginia, and elsewhere.
North Carolina offers an especially striking example of a state headed in a more regressive direction. Since 2000, the state’s top income tax rate fell from 7.75 to 3.99 percent, the corporate rate fell from 6.9 to 2 percent, and the sales tax rate increased from 4 to 4.75 percent. The state’s evolving revenue mix confirms this shift: sales taxes for 29 percent of total state and local revenues, up from 21 percent in 2000, while the income tax share has shrunk from 40 to 32 percent. This tax swap has quietly left working-class households carrying more of the responsibility for funding schools, health care, and infrastructure.
Conclusion
Overall, our new historical data reveal a shift in how states raise revenue. Many states have repeatedly cut top personal and corporate income tax rates in recent years, sometimes while approving increased sales tax rates as well. Because sales taxes fall more heavily on working families, this shift has generally pushed many state tax systems in a more regressive direction. Other states, however, have charted a very different course and have moved to increase taxes on higher income households to fund public services.
These trends underscore a key policy choice facing states today. As federal support for state programs retracts and economic inequality reaches record highs, decisions about tax structure will shape who pays for essential public services. Strengthening progressive revenue sources—through higher rates on high-income households and corporations—offers states a way to maintain and strengthen public investments that improve the lives of working families.
Endnotes
- 1. Deductions for federal income taxes, common in the early years of modern state income taxes, substantially reduce the taxable income of high-income taxpayers and profitable corporations, thereby triggering a significant reduction in true effective marginal tax rates. For example, a millionaire in 1990 living in one of the nine states with this deduction that year would avoid state taxation on 34 percent of their last dollar of income—a share that is equal to the federal top income tax rate. While these deductions have become far less common in recent years, historical analyses should account for them to better reflect the top rate actually paid by those with the highest incomes.