|
 |
 |
 |
 |
 |
 |
 |
 |
 |
 |
 |
 |
Overview
There is significant room for improvement in state and local tax codes. State tax codes are filled with top-heavy exemptions and deductions and often fail to tax higher incomes at higher rates. States and localities have come to rely too heavily on regressive sales taxes that fail to reflect the modern economy. And overall tax collections are often inadequate in the short-run and unsustainable in the long-run. These types of shortcomings provide compelling reason to pursue state and local tax reforms to make these systems more equitable, adequate, and sustainable.
Too often, however, would-be tax reformers propose policy changes that would worsen one of the most undesirable features of state and local tax systems: their lopsided impact on taxpayers at varying income levels. Nationwide, the bottom 20 percent of earners pay 11.4 percent of their income in state and local taxes each year. Middle-income families pay a slightly lower 9.9 percent average rate. But the top 1 percent of earners pay just 7.4 percent of their income in such taxes. This is the definition of regressive, upside-down tax policy.
State and local tax systems exacerbate growing income inequality precisely because they capture a greater share of income from low- or moderate-income taxpayers. Moreover, regressive state tax codes overall result in higher tax rates on communities of color, which are more represented in the low-, moderate- and middle-income quintiles, thereby worsening racial income and wealth divides.
State tax systems that ask the most of families with the least are also not well-suited to generate adequate revenues to fund schools, health care, infrastructure, and other public services that are crucial to building thriving communities. This problem is particularly acute in the long run since regressive tax systems depend more heavily on low-income families, whose incomes have remained largely stagnant, while taxing the superrich, whose wealth and incomes are growing rapidly, at lower rates.
As information in this chart book helps illustrate, it does not have to be this way. States vary considerably in the fairness of their tax codes, and pursuing policies adopted by states with the least regressive tax systems is a proven strategy for reducing tax inequity.
States levying robust personal income taxes with graduated tax rates and targeted refundable credits, for example, tend to have overall tax systems that are more reflective of taxpayers’ ability to pay. By contrast, states with flat-rate personal income taxes or no personal income tax at all have among the most regressive tax systems in the nation.
And contrary to claims that everybody pays a “fair share” under sales and excise taxes, states relying heavily on these taxes to fund government tend to fare poorly in terms of the distribution of their tax systems. As this chart book shows, middle- and low-income taxpayers typically pay more tax on what they buy (sales and excise taxes) than on what they earn (income taxes), though many families may fail to notice this since sales taxes they pay are spread over countless purchases made throughout the year. Relying on sales tax benefits high-income taxpayers at the expense of low- and moderate-income families who often face above-average tax rates to pick up the slack.
Given the detrimental impact that regressive tax policies have on economic opportunity, income inequality, racial wealth disparities, revenue adequacy, and long-run revenue sustainability, tax reform proponents should look to the least regressive states in crafting their proposals.
Index
Overall State & Local Tax Distribution
Chart 1: Distribution of State & Local Taxes, National Average
Chart 2: Shares of State & Local Taxes Paid Compared to Shares of Income
Chart 3: Percentage Change in Each Income Group’s Share of Personal Income Due to State & Local Taxes
Income Taxes
Chart 4: States without Personal Income Taxes Tend to Levy Higher Taxes on Low-Income People
Chart 5: Low- and Moderate-Income Families Often Face Above-Average Tax Rates in States without Personal Income Taxes
Chart 6: States that Rely More on Personal Income Taxes See More Parity in Effective Tax Rates Paid By Low- and High-Income Families
Chart 7: Flat-Rate State Income Taxes Are Less Progressive than Graduated-Rate Taxes and Require Larger Payments from Most Taxpayers
Sales & Excise Taxes
Chart 8: States Most Reliant on Sales Taxes Are “High Tax” for Low- and Moderate-Income Families
Chart 9: Heavier Reliance on Sales & Excise Taxes is Associated with Higher Taxes on Low- and Moderate-Income Families
Comparing Income and Sales Taxes
Chart 10: Most Taxpayers Pay More in State and Local Consumption Taxes than in Income Taxes
Tax Fairness and Income Inequality
Chart 11: Impact of Tax Systems on Income Inequality
Chart 12: Heavier Reliance on Sales & Excise Taxes is Associated with More Regressive Tax Systems
Chart 13: Effective Tax Rate Ratio on Bottom 40 Percent Relative to Top 1 Percent
Overall State & Local Tax Distribution
1. State and local tax systems levy the highest effective tax rates on the lowest-income taxpayers.
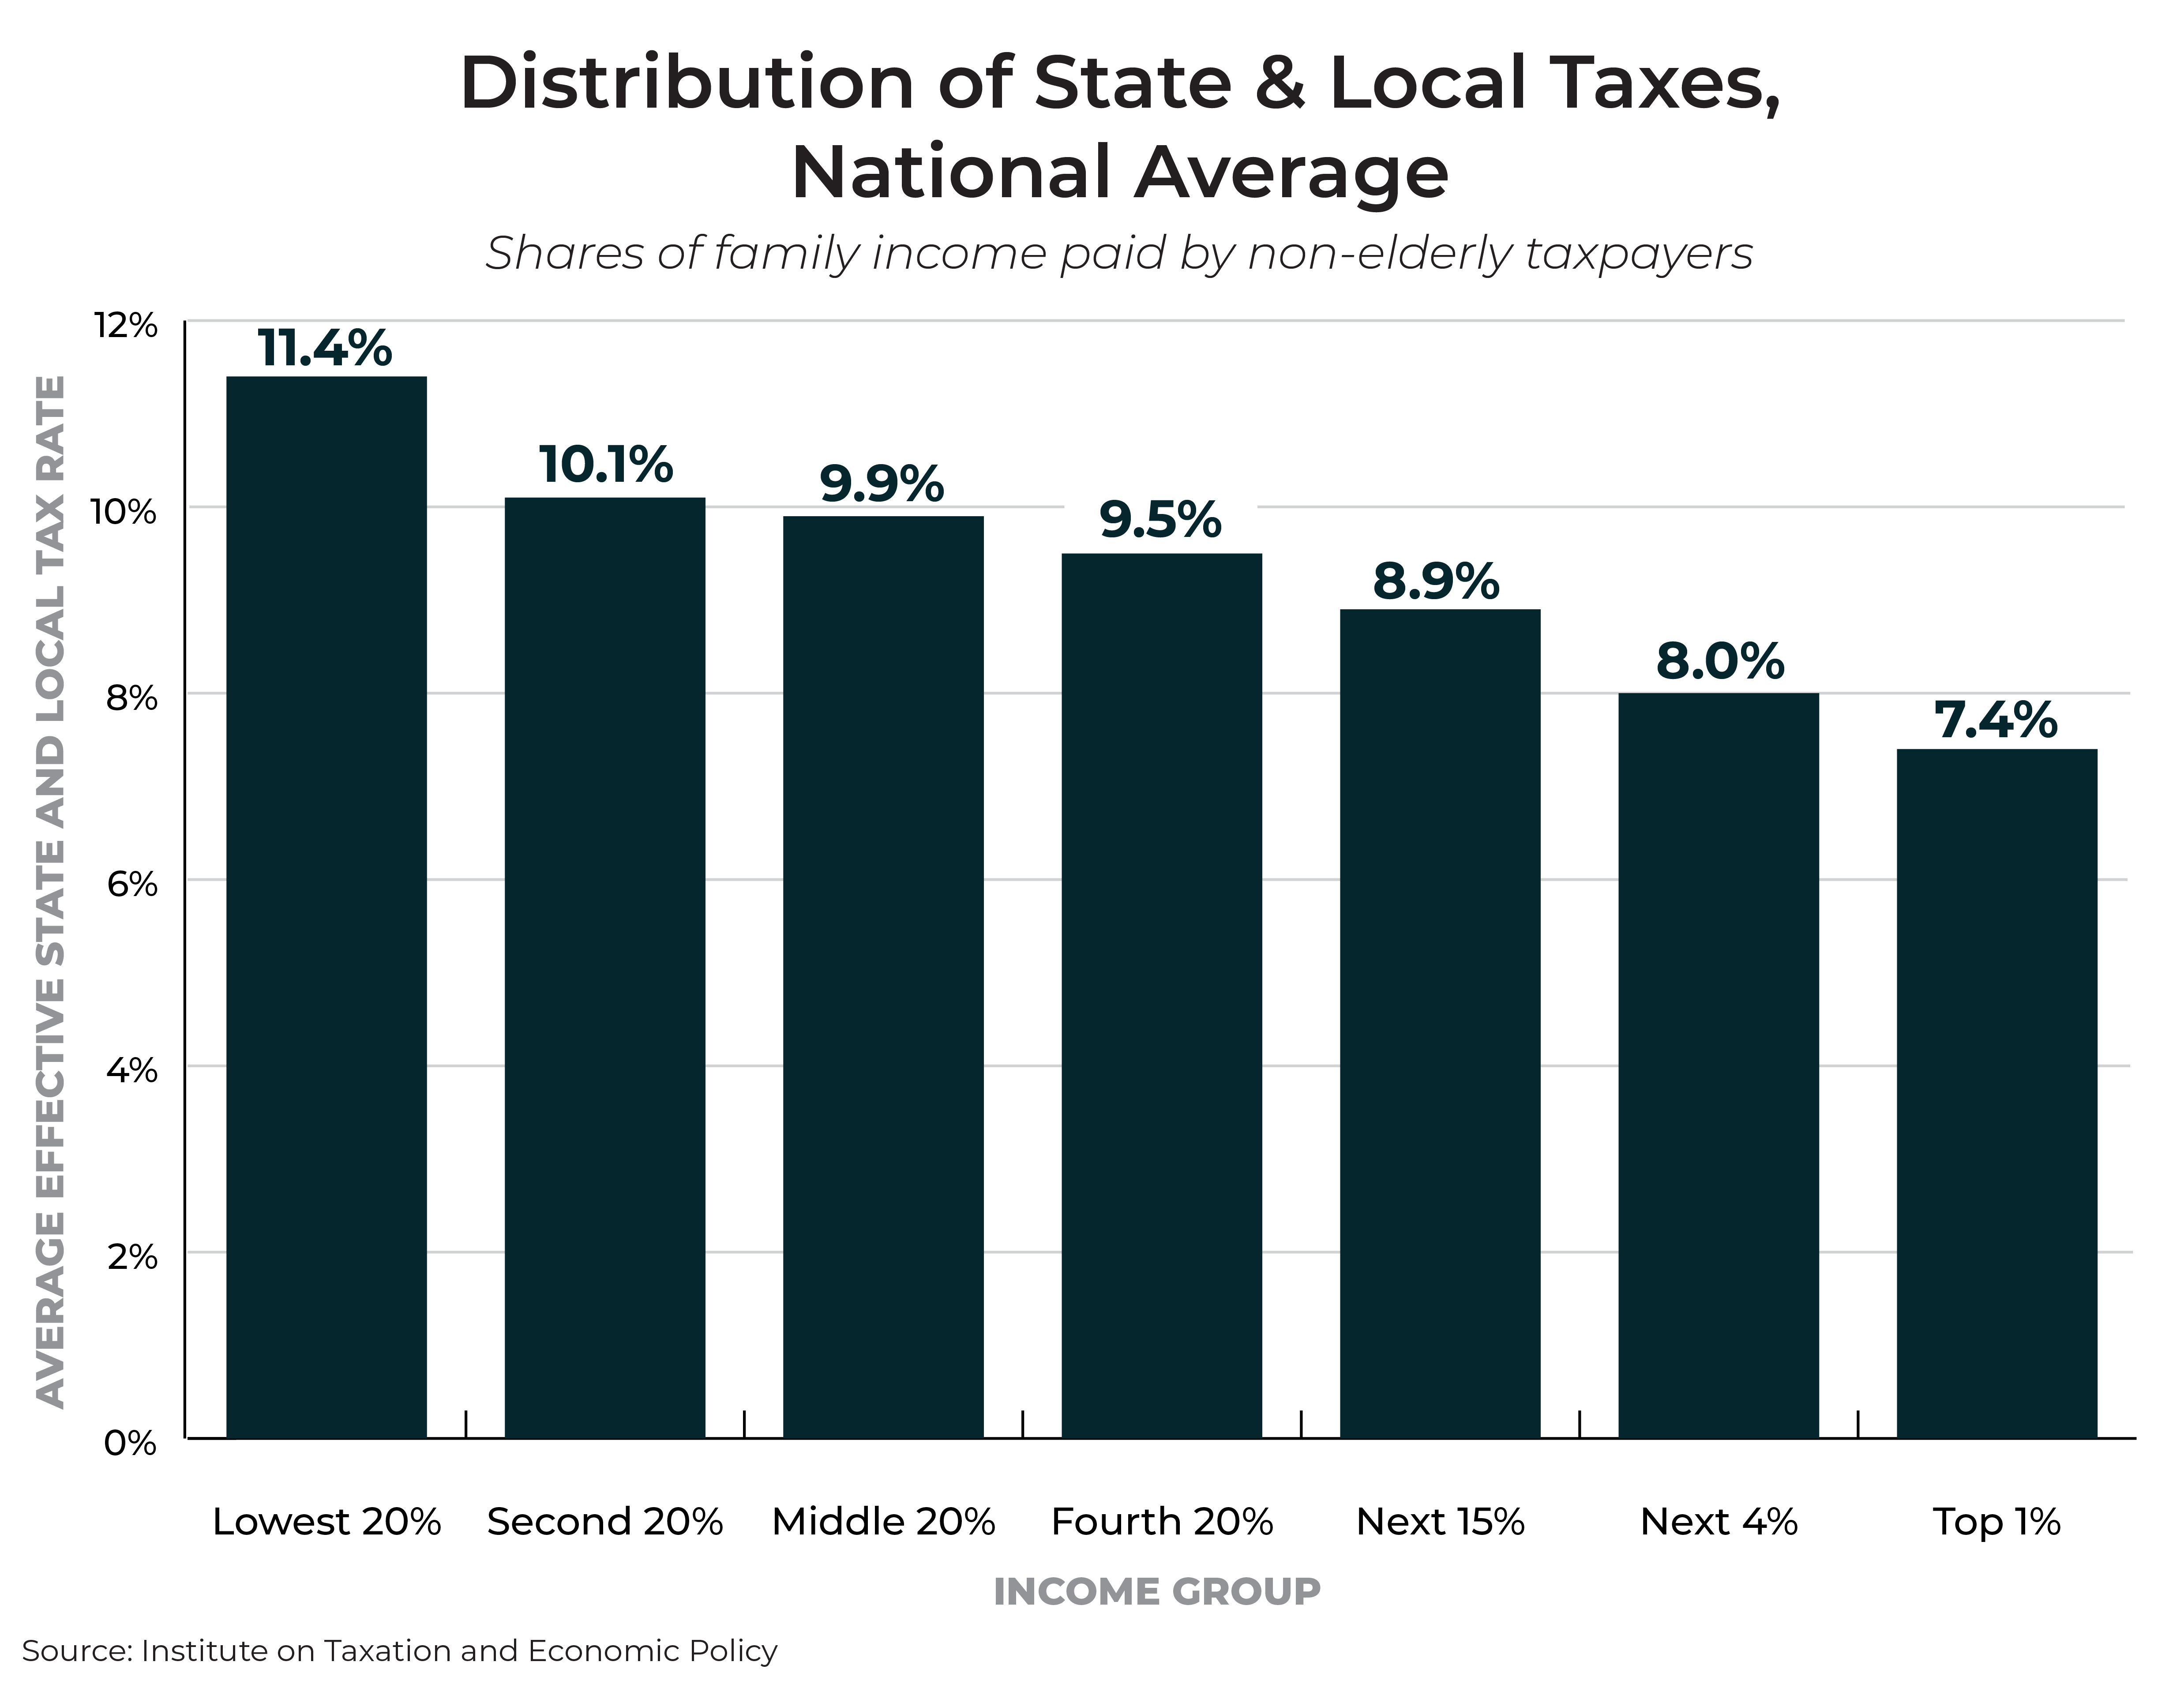
Virtually every state tax system is fundamentally unfair, taking a much greater share of income from low- and middle-income families than from high-income families. On average, the poorest 20 percent of taxpayers spend 11.4 percent of their income on state and local taxes, which is 50 percent higher than the 7.4 percent average effective rate for the top 1 percent.
While reasons for this disparity vary by state, an overreliance on regressive consumption taxes and the lack of a sufficiently robust personal income tax are two of the most common features of state and local tax codes.
Note: As with the rest of the data underlying this chart book, these figures come from the sixth edition of ITEP’s Who Pays? report, published October 2018.
2. Unlike every other income group, the top 5 percent of earners pay a smaller share of state and local taxes than their share of income.

The nation’s income is concentrated at the top. For example, the top 1 percent alone have a combined income that exceeds the bottom half of individuals and families.
Despite this imbalance, state and local tax systems typically ask less of high-income families than of families of more modest means. The top 5 percent of earners pay a smaller share of state and local taxes than their share of income. The bottom 80 percent of families, by contrast, pay a larger share of state and local taxes than the share of income they earn.
3. Regressive state and local tax systems widen income inequality.
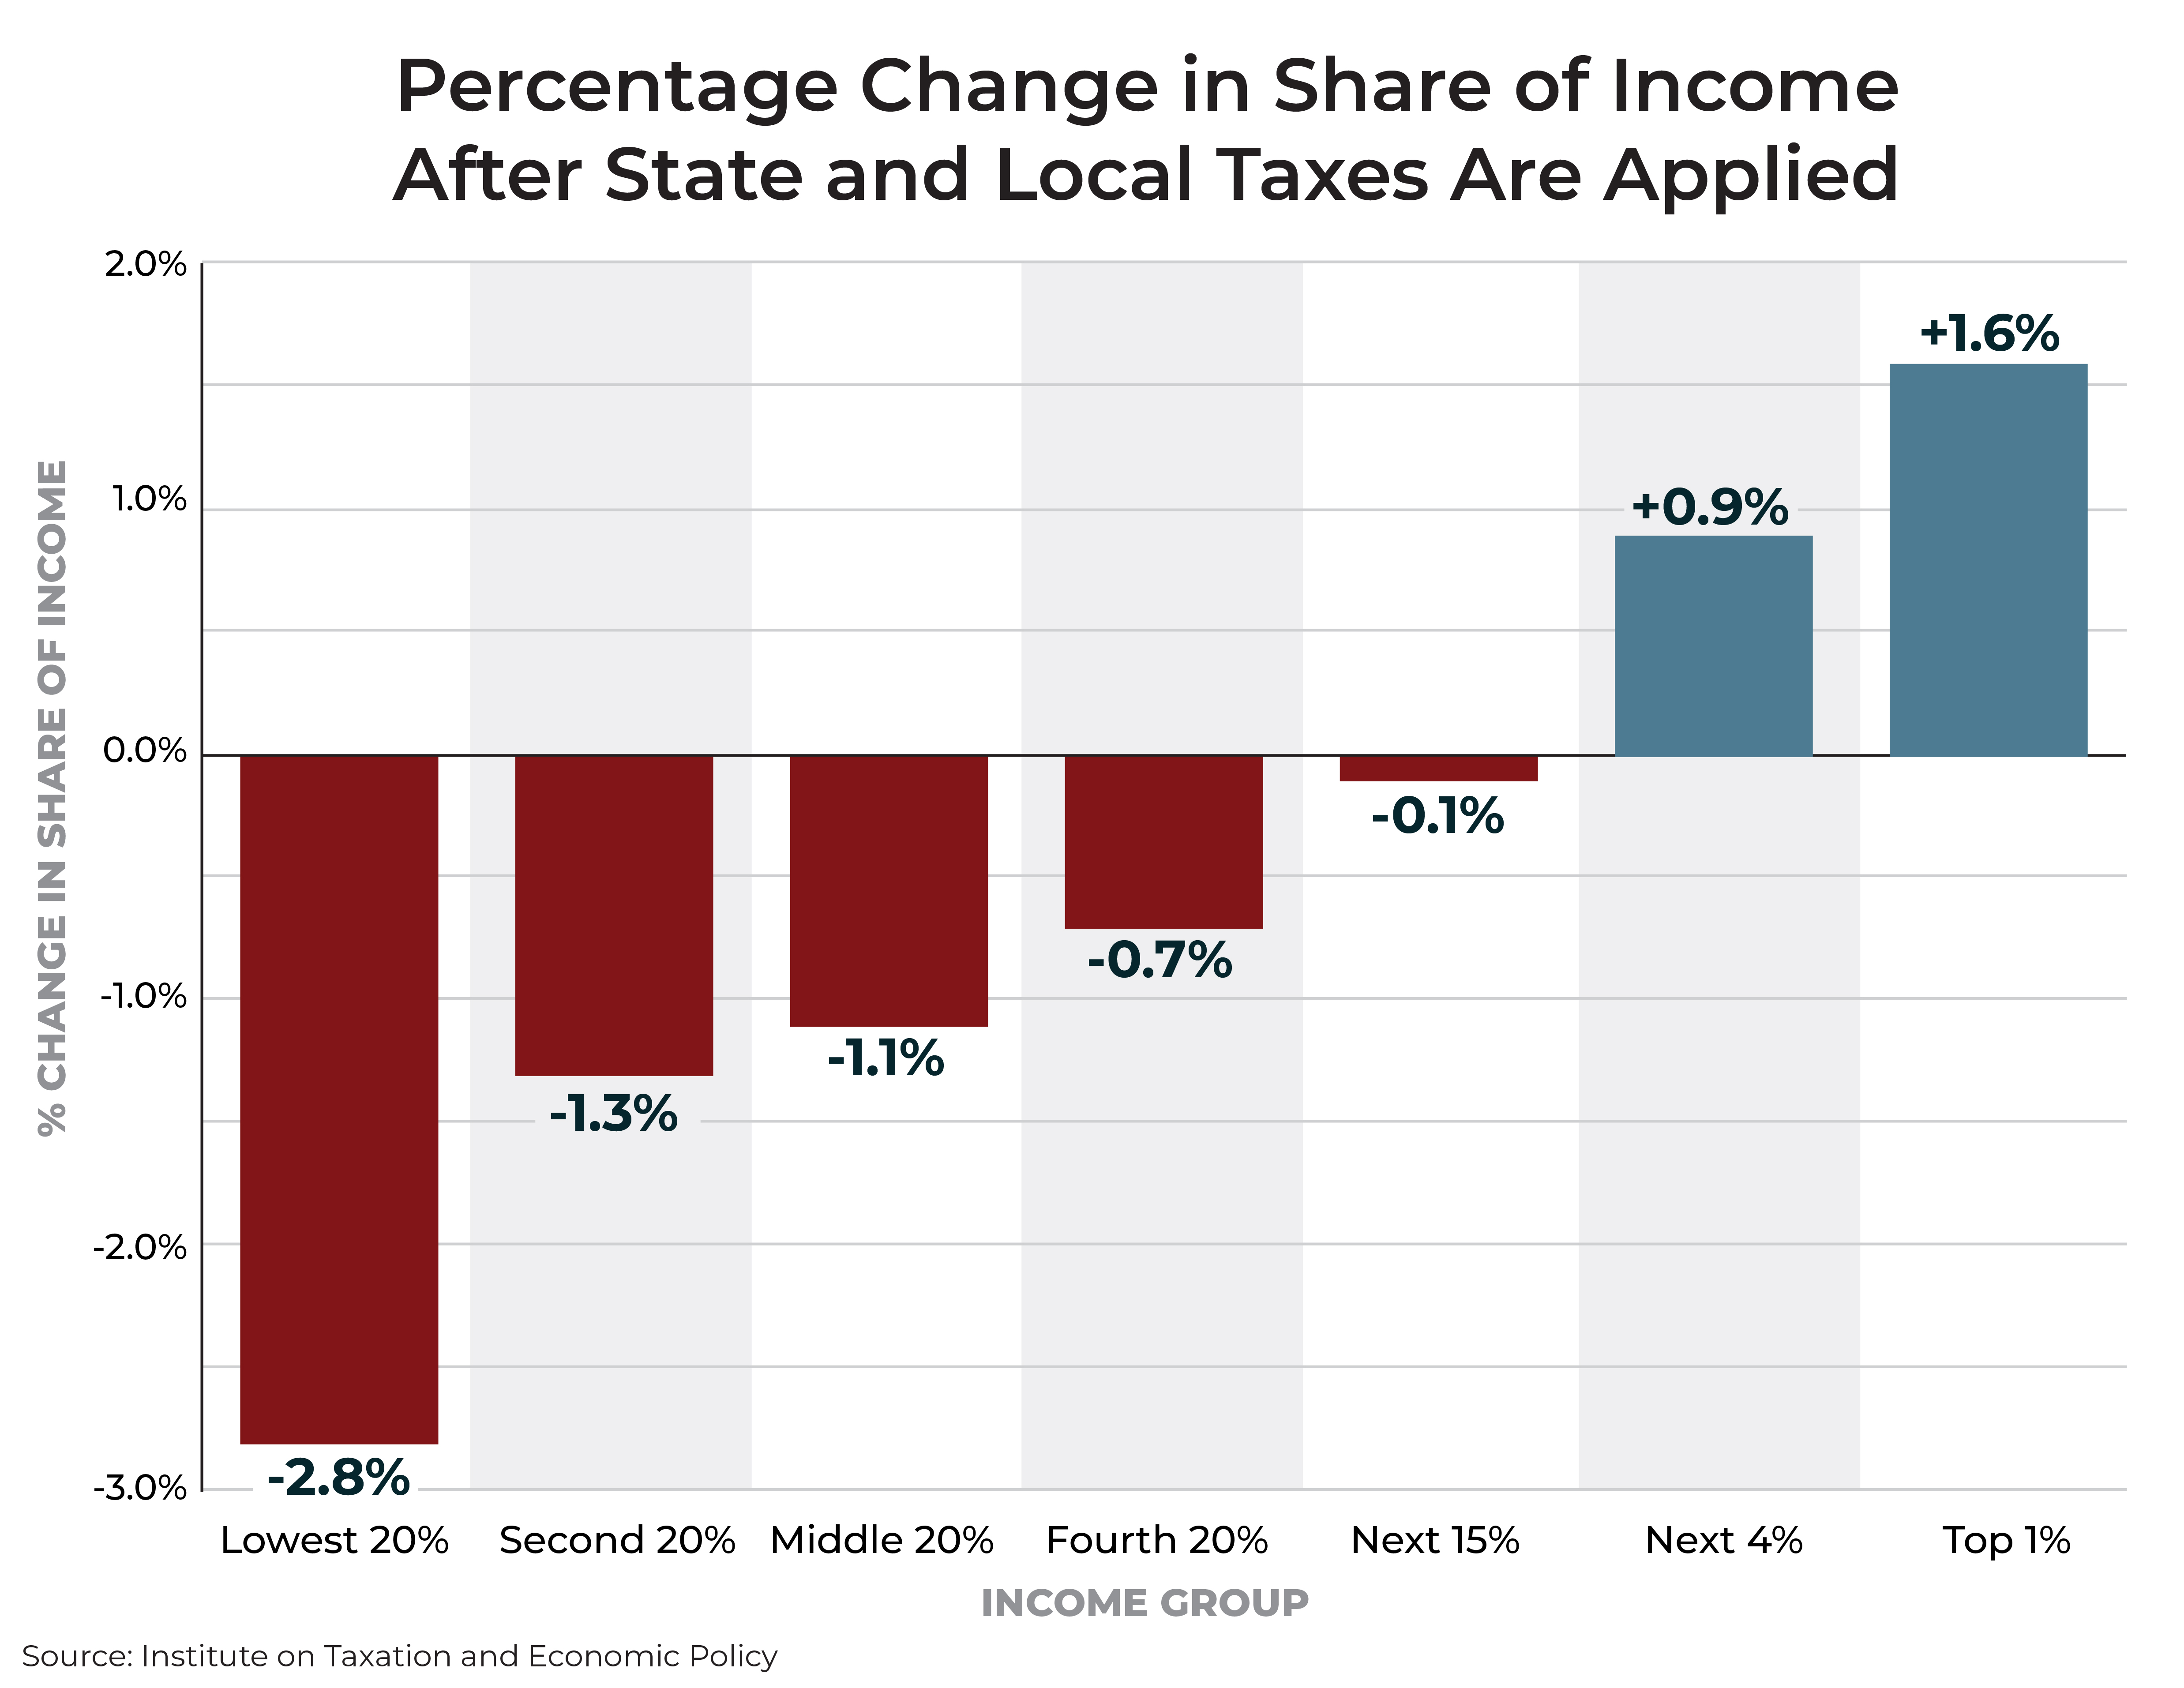
While state and local tax laws are not the primary cause of income inequality, they play a role in exacerbating existing gaps in income.
Because low- and middle-income individuals and families face above-average state and local tax rates, their share of total income falls after state and local taxes. Low-income families, for example, see their share of income fall by 2.8 percent (from 3.0 to 2.9 percent). High-income families, by contrast, experience a 1.6 percent gain in their share of income after these taxes are collected (from 19.2 to 19.5 percent of personal income).
In other words, incomes are less equal after state and local taxes than before.
Note: Figures are expressed as percentages rather than percentage point changes.
Income Taxes
4. Not levying a personal income tax benefits high-income households.
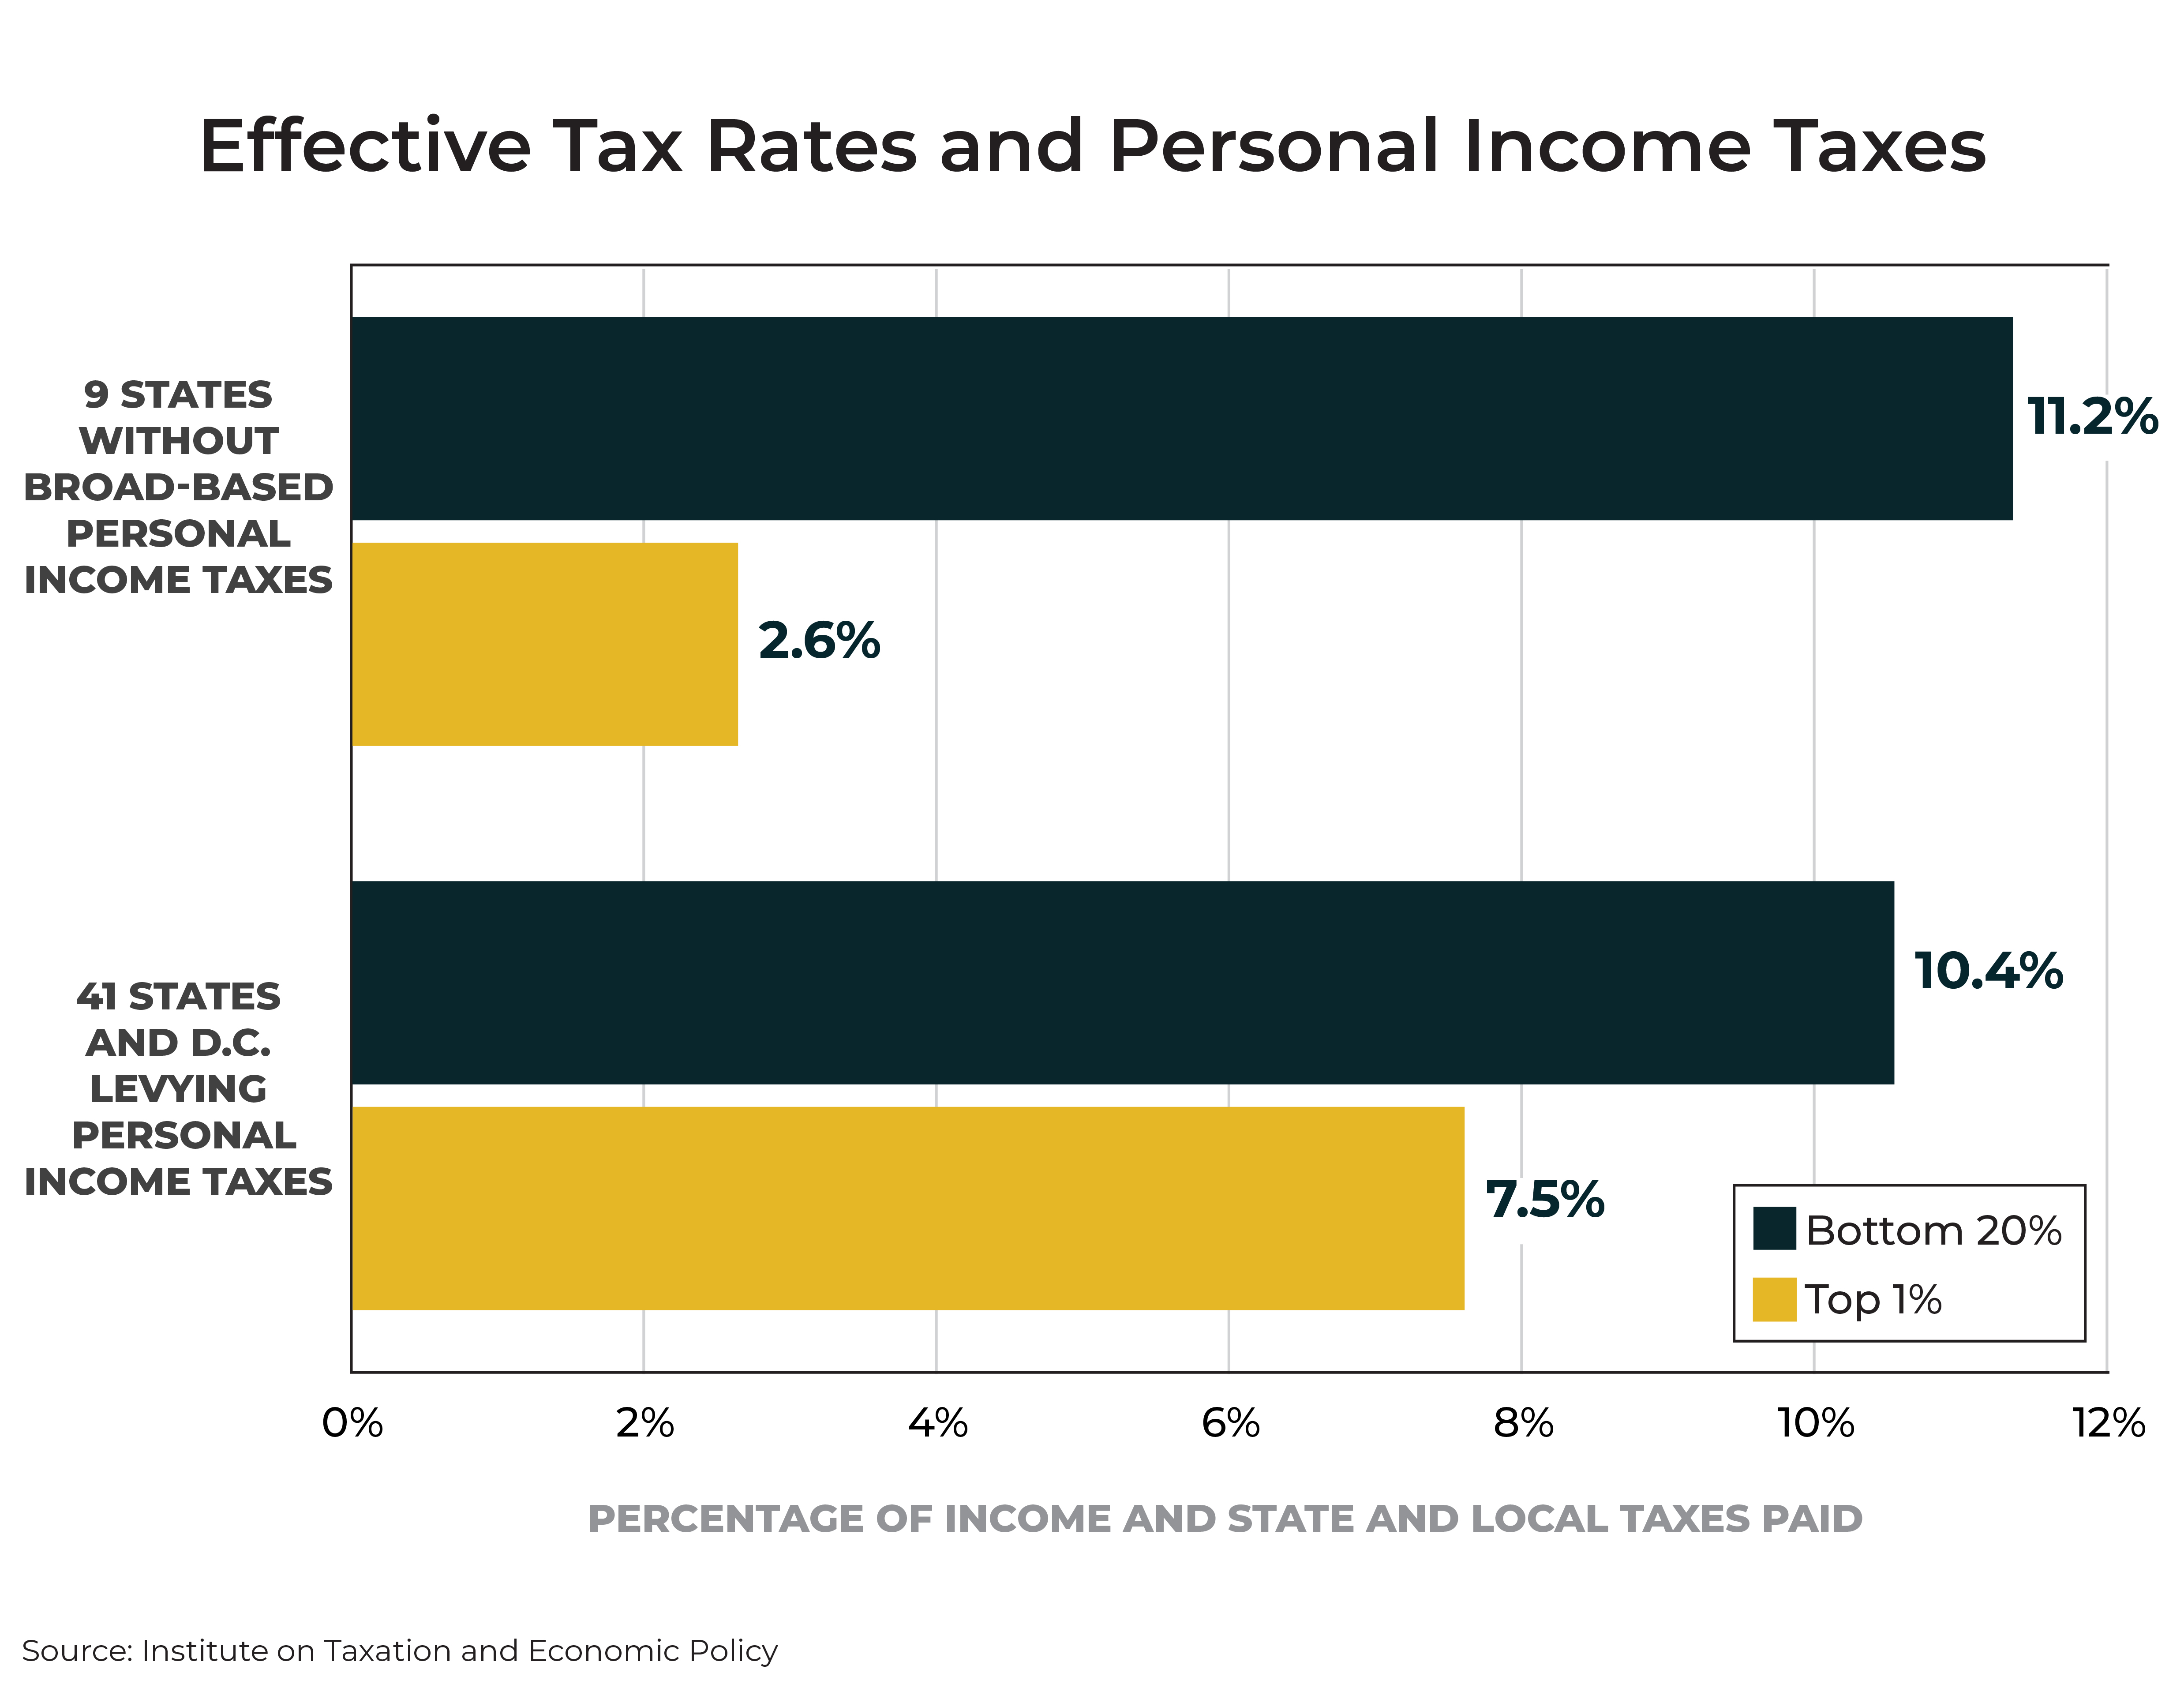
It is a common misconception that states without personal income taxes are “low tax.” In reality, to compensate for lack of income tax revenues these state governments often rely more heavily on sales and excise taxes that disproportionately impact lower-income families. As a result, while the nine states without broad-based personal income taxes are universally “low tax” for households earning large incomes, these states tend to be higher tax for the poor.
Note: The nine states without broad-based personal income taxes are Alaska, Florida, Nevada, New Hampshire, South Dakota, Tennessee, Texas, Washington, and Wyoming.
5. States without personal income taxes are not necessarily “low tax” for everyone.
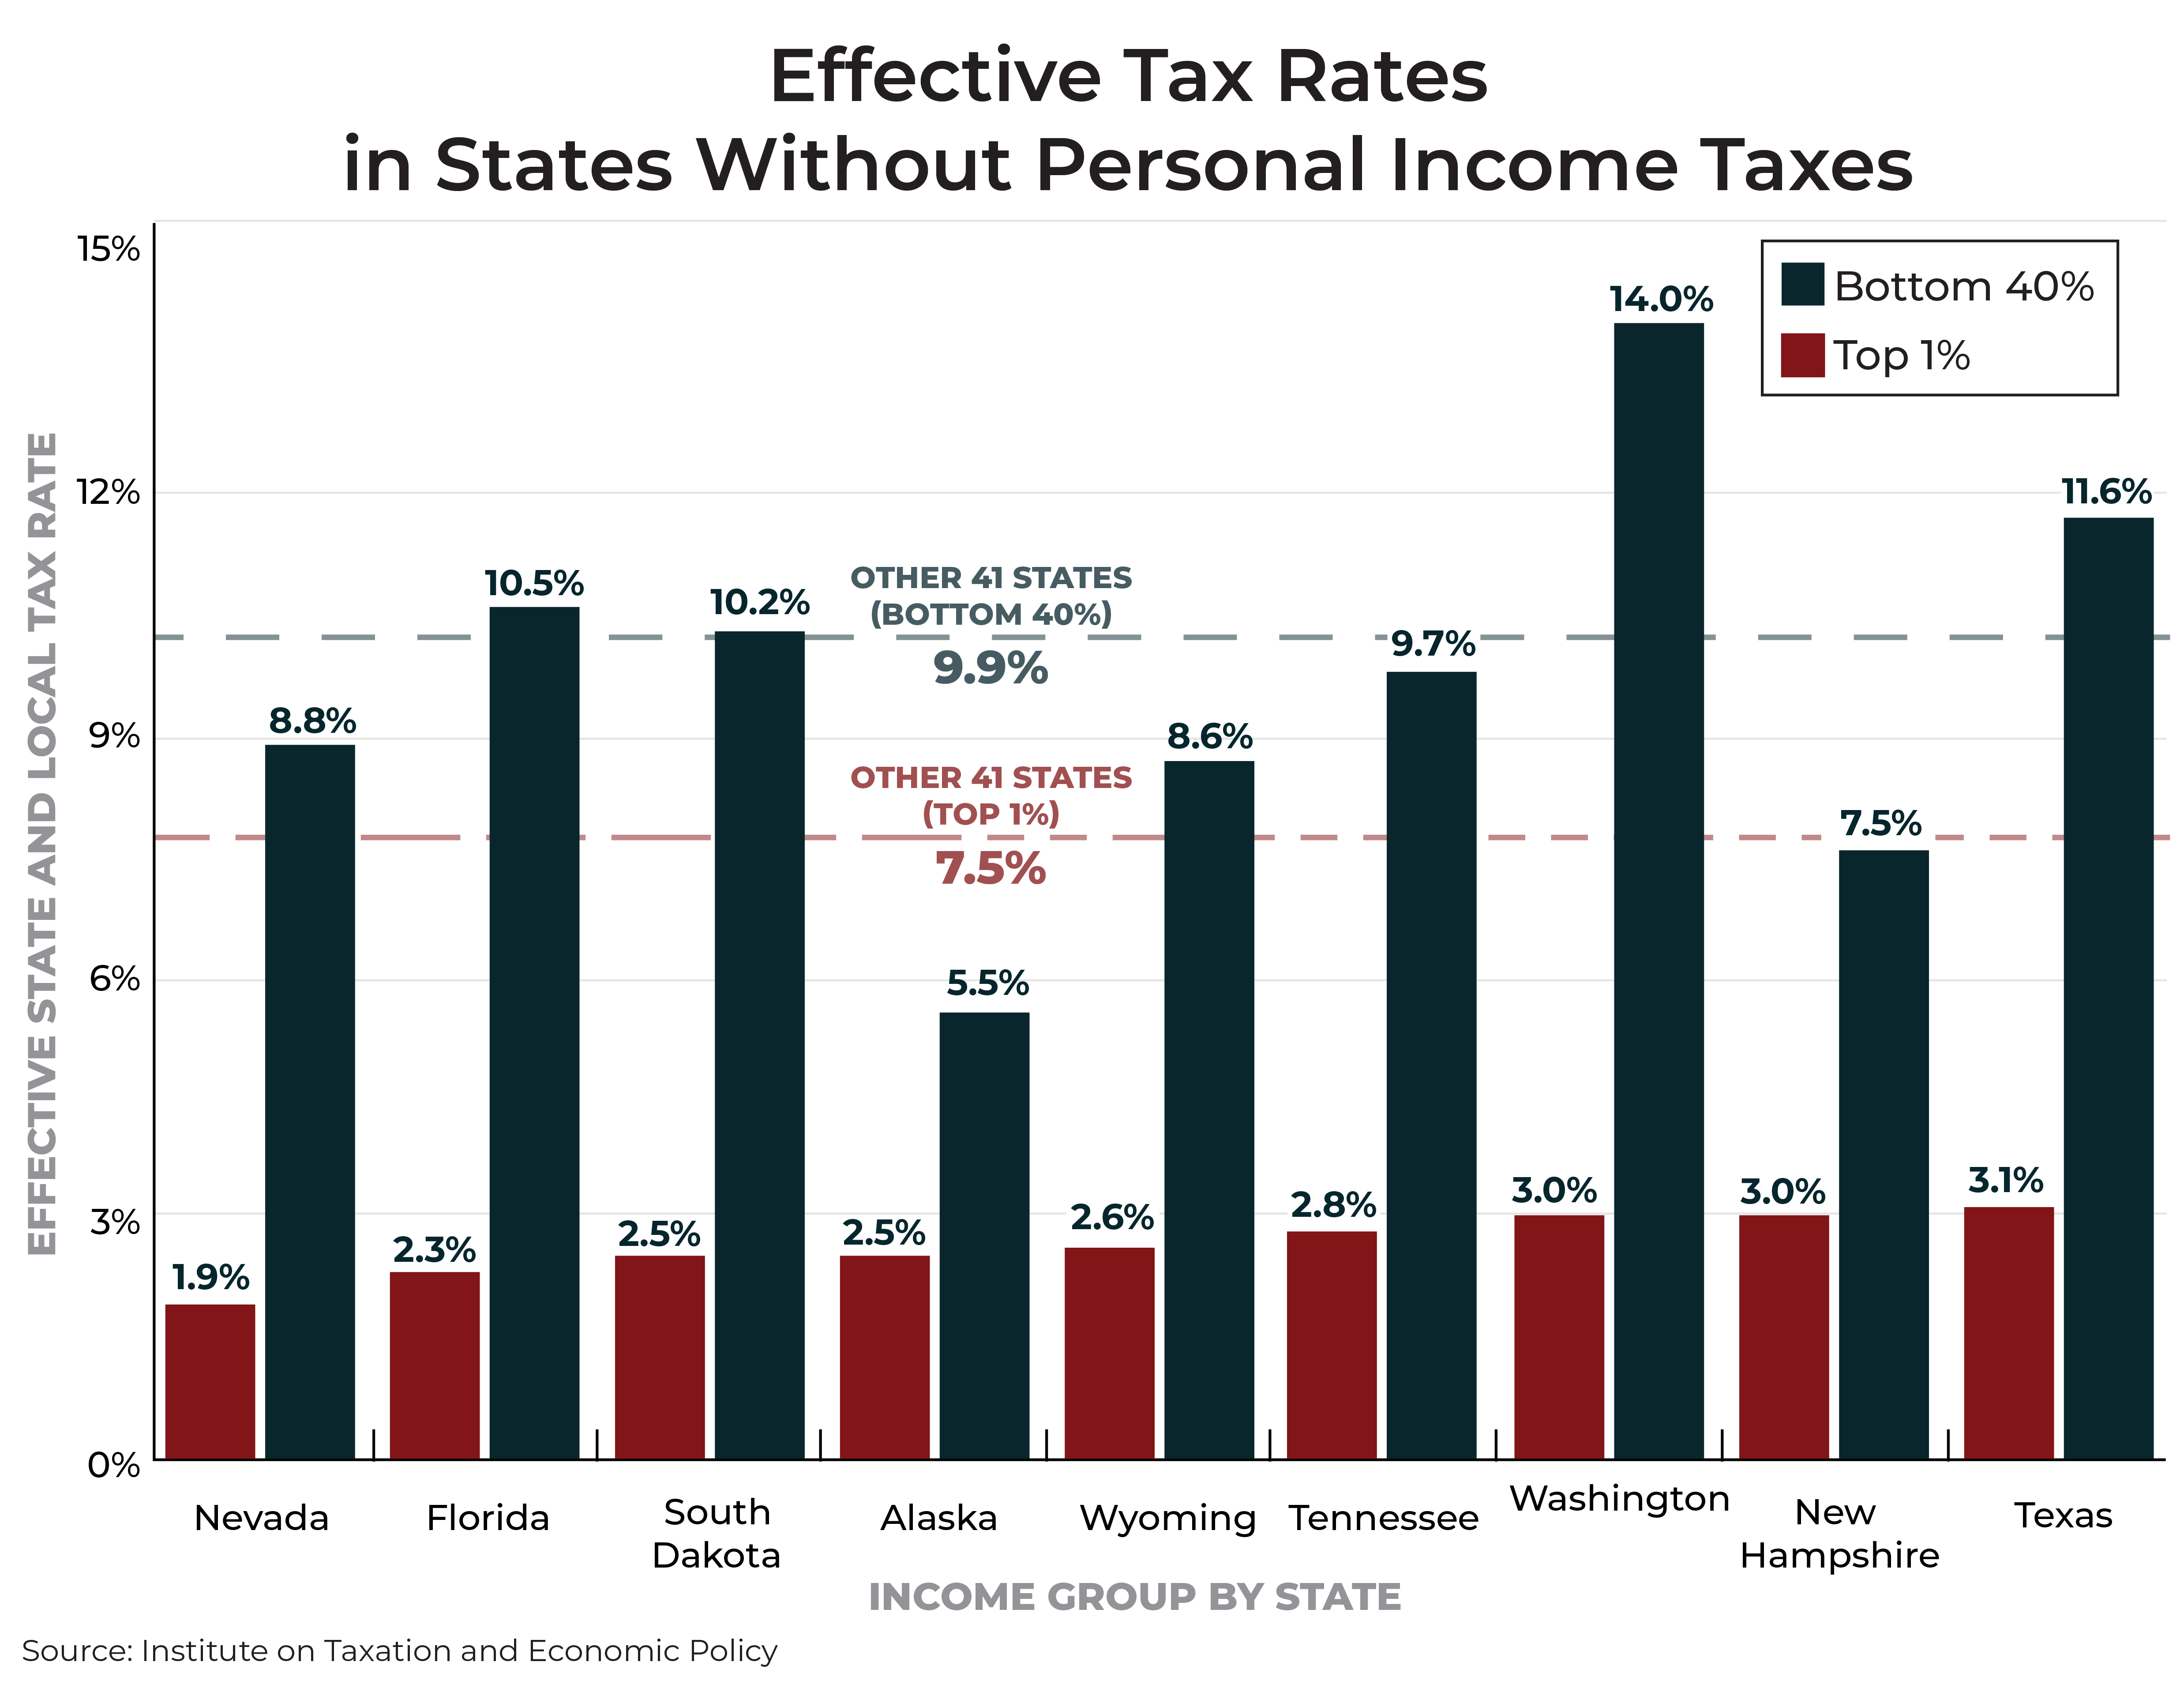
Four of the nine states without broad-based personal income taxes require their low- and moderate-income taxpayers (those in the bottom 40 percent of the income distribution) to pay more than 10 percent of their income in state and local taxes each year. Among states that levy personal income taxes, the average effective tax rate for this group is 9.9 percent. States that compensate for lack of a personal income tax by levying higher taxes on consumption tend to be “high tax” states for low- and moderate-income families.
These nine states are also, without exception, the lowest-tax states in the nation for high-income families. Among the 41 states that levy personal income taxes, the overall state and local tax rate (including income, sales, excise, and property taxes) applied to the top 1 percent of earners averages 7.5 percent. In states without personal income taxes, this rate is 3.1 percent or less.
6. Robust personal income taxes make state tax systems less regressive.
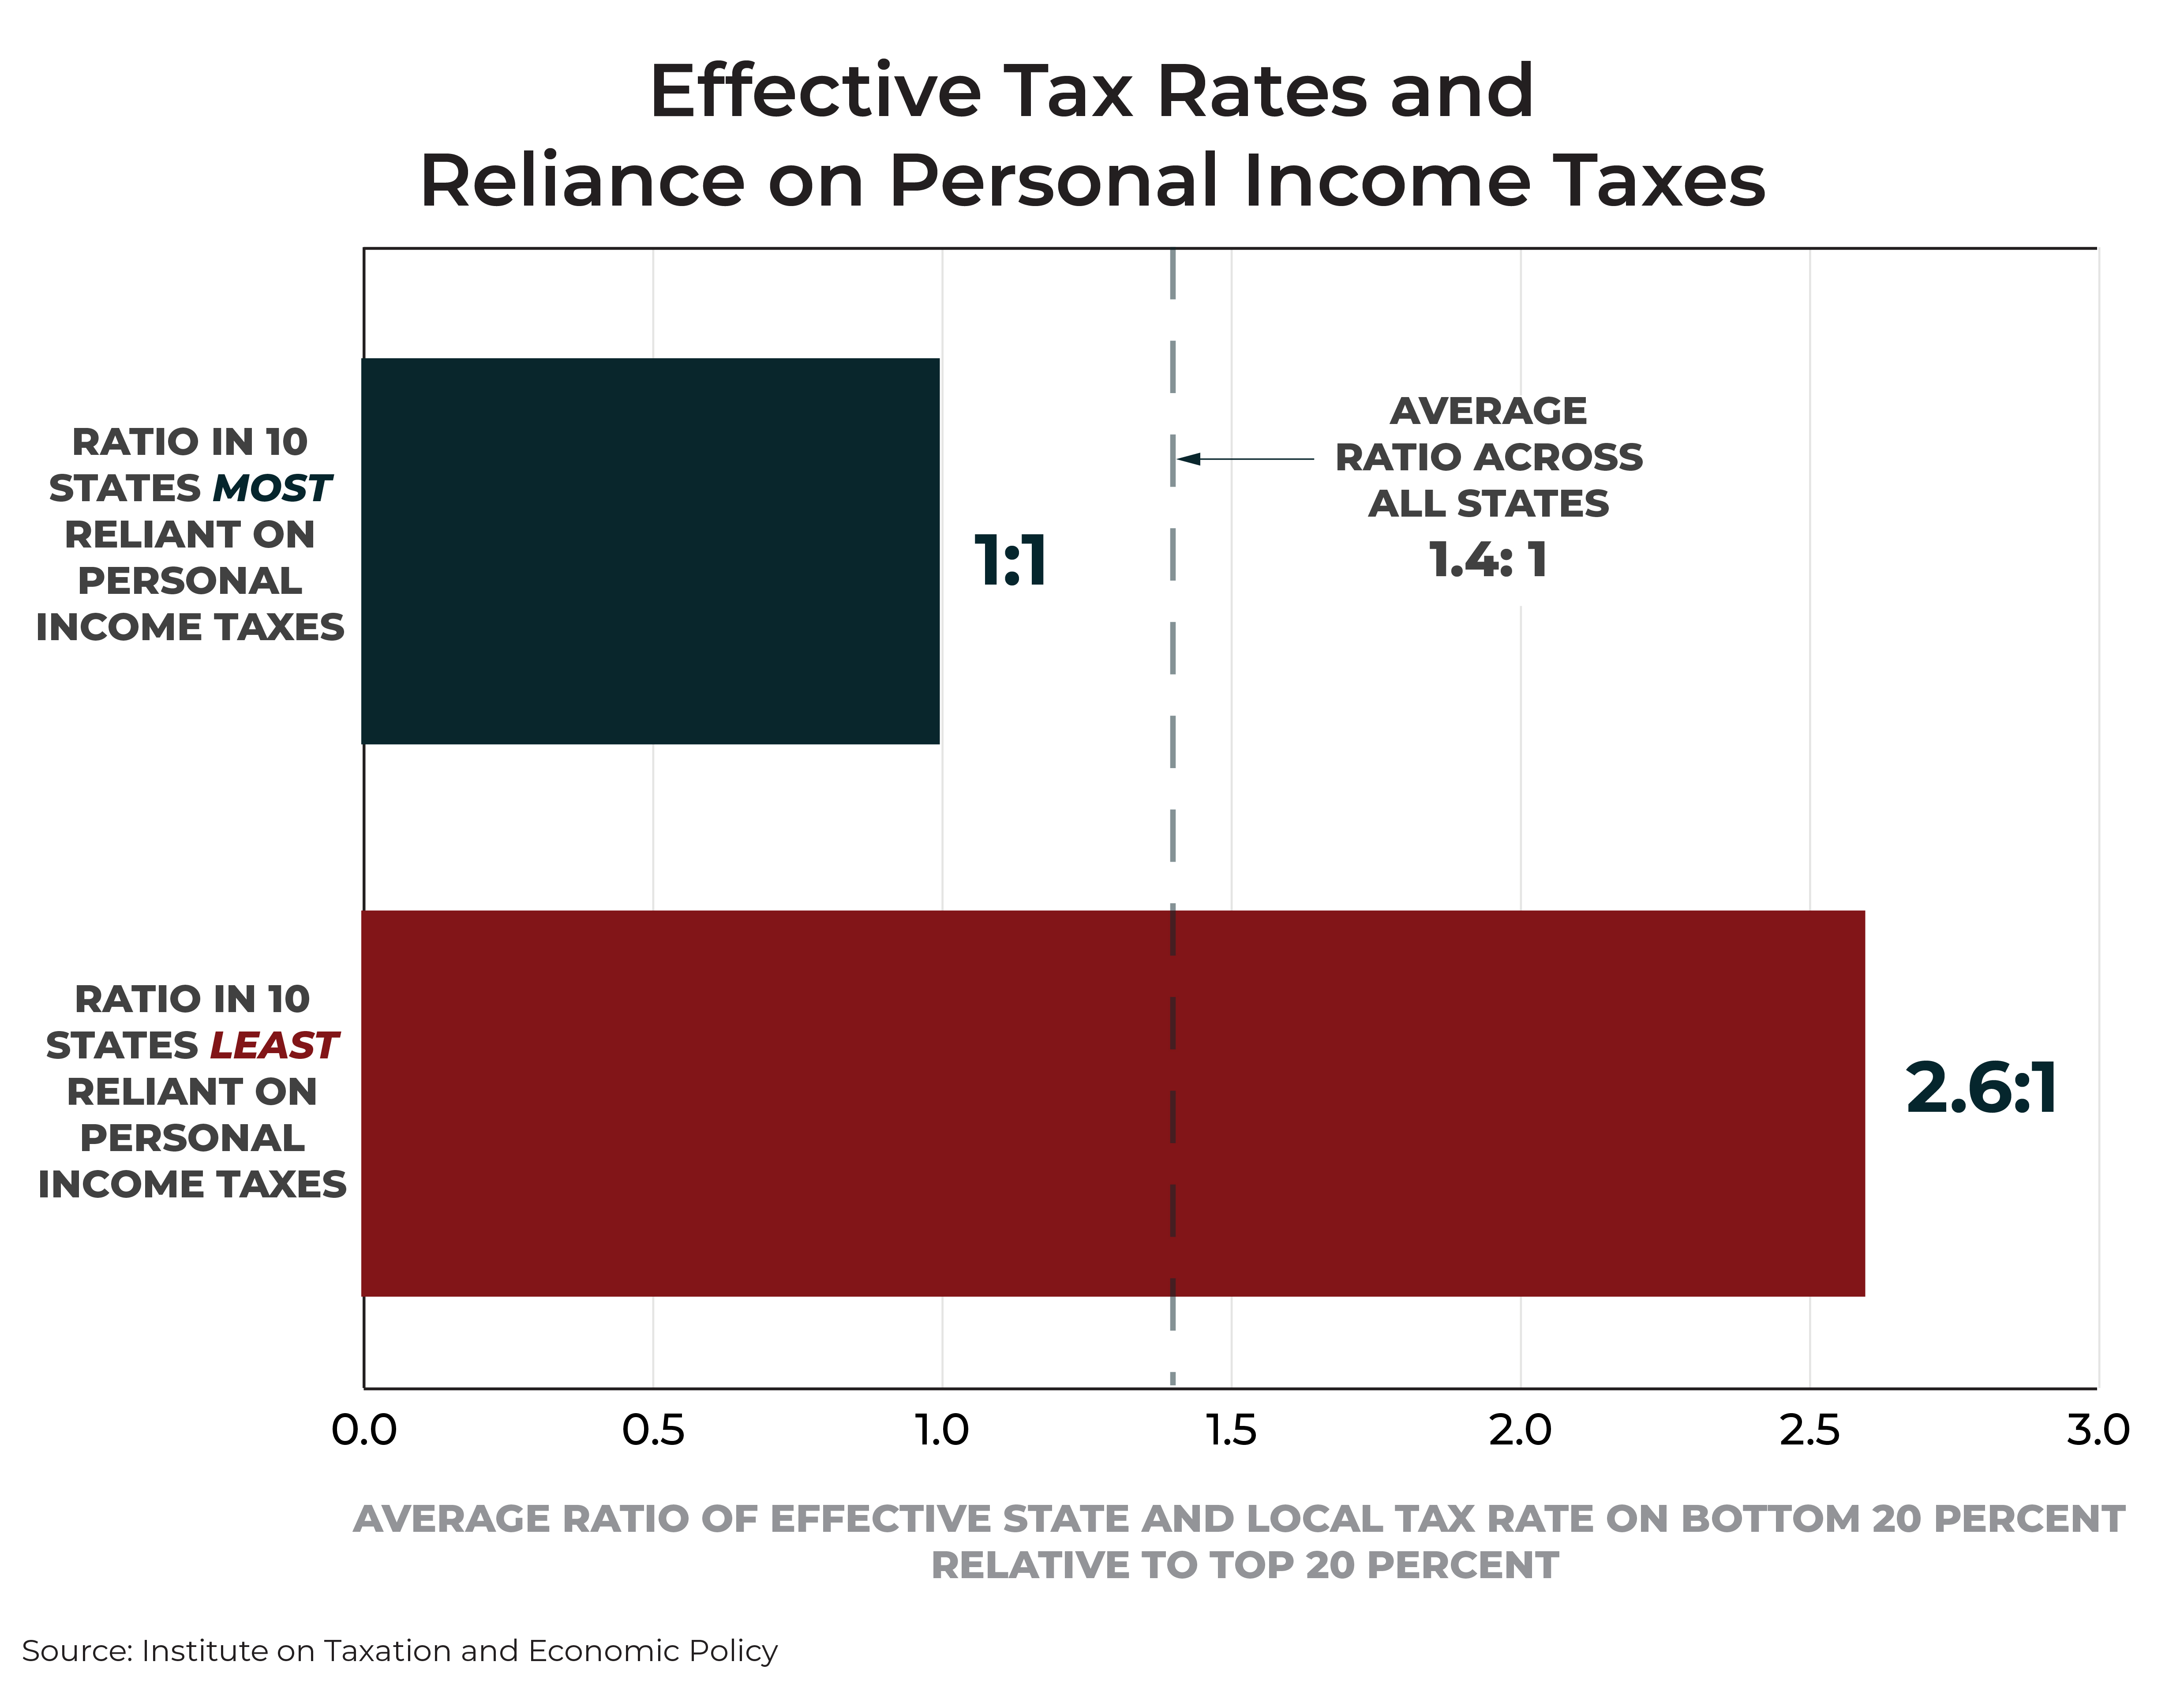
Progressive personal income taxes provide an important counterbalance to other state and local taxes that often fall more heavily on low- and moderate-income families. The 10 states relying most on personal income taxes to fund government come closest to parity in tax rates across the income scale. States with little or no personal income tax, by contrast, charge the poorest 20 percent of taxpayers an average effective tax rate that is 2.6 times as high as the rate they charge their top 20 percent of taxpayers.
Note: Reliance on personal income taxes is measured relative to state and local own-source revenue in Fiscal Year 2016, as reported by the U.S. Census Bureau. The ten most reliant states are Maryland, Oregon, New York, Massachusetts, Connecticut, California, Minnesota, Kentucky, the District of Columbia, and Virginia. The ten least reliant states are Alaska, Florida, Nevada, South Dakota, Texas, Washington, Wyoming, Tennessee, New Hampshire, and North Dakota.
7. Flat taxes often require higher payments by low- and middle-income families.
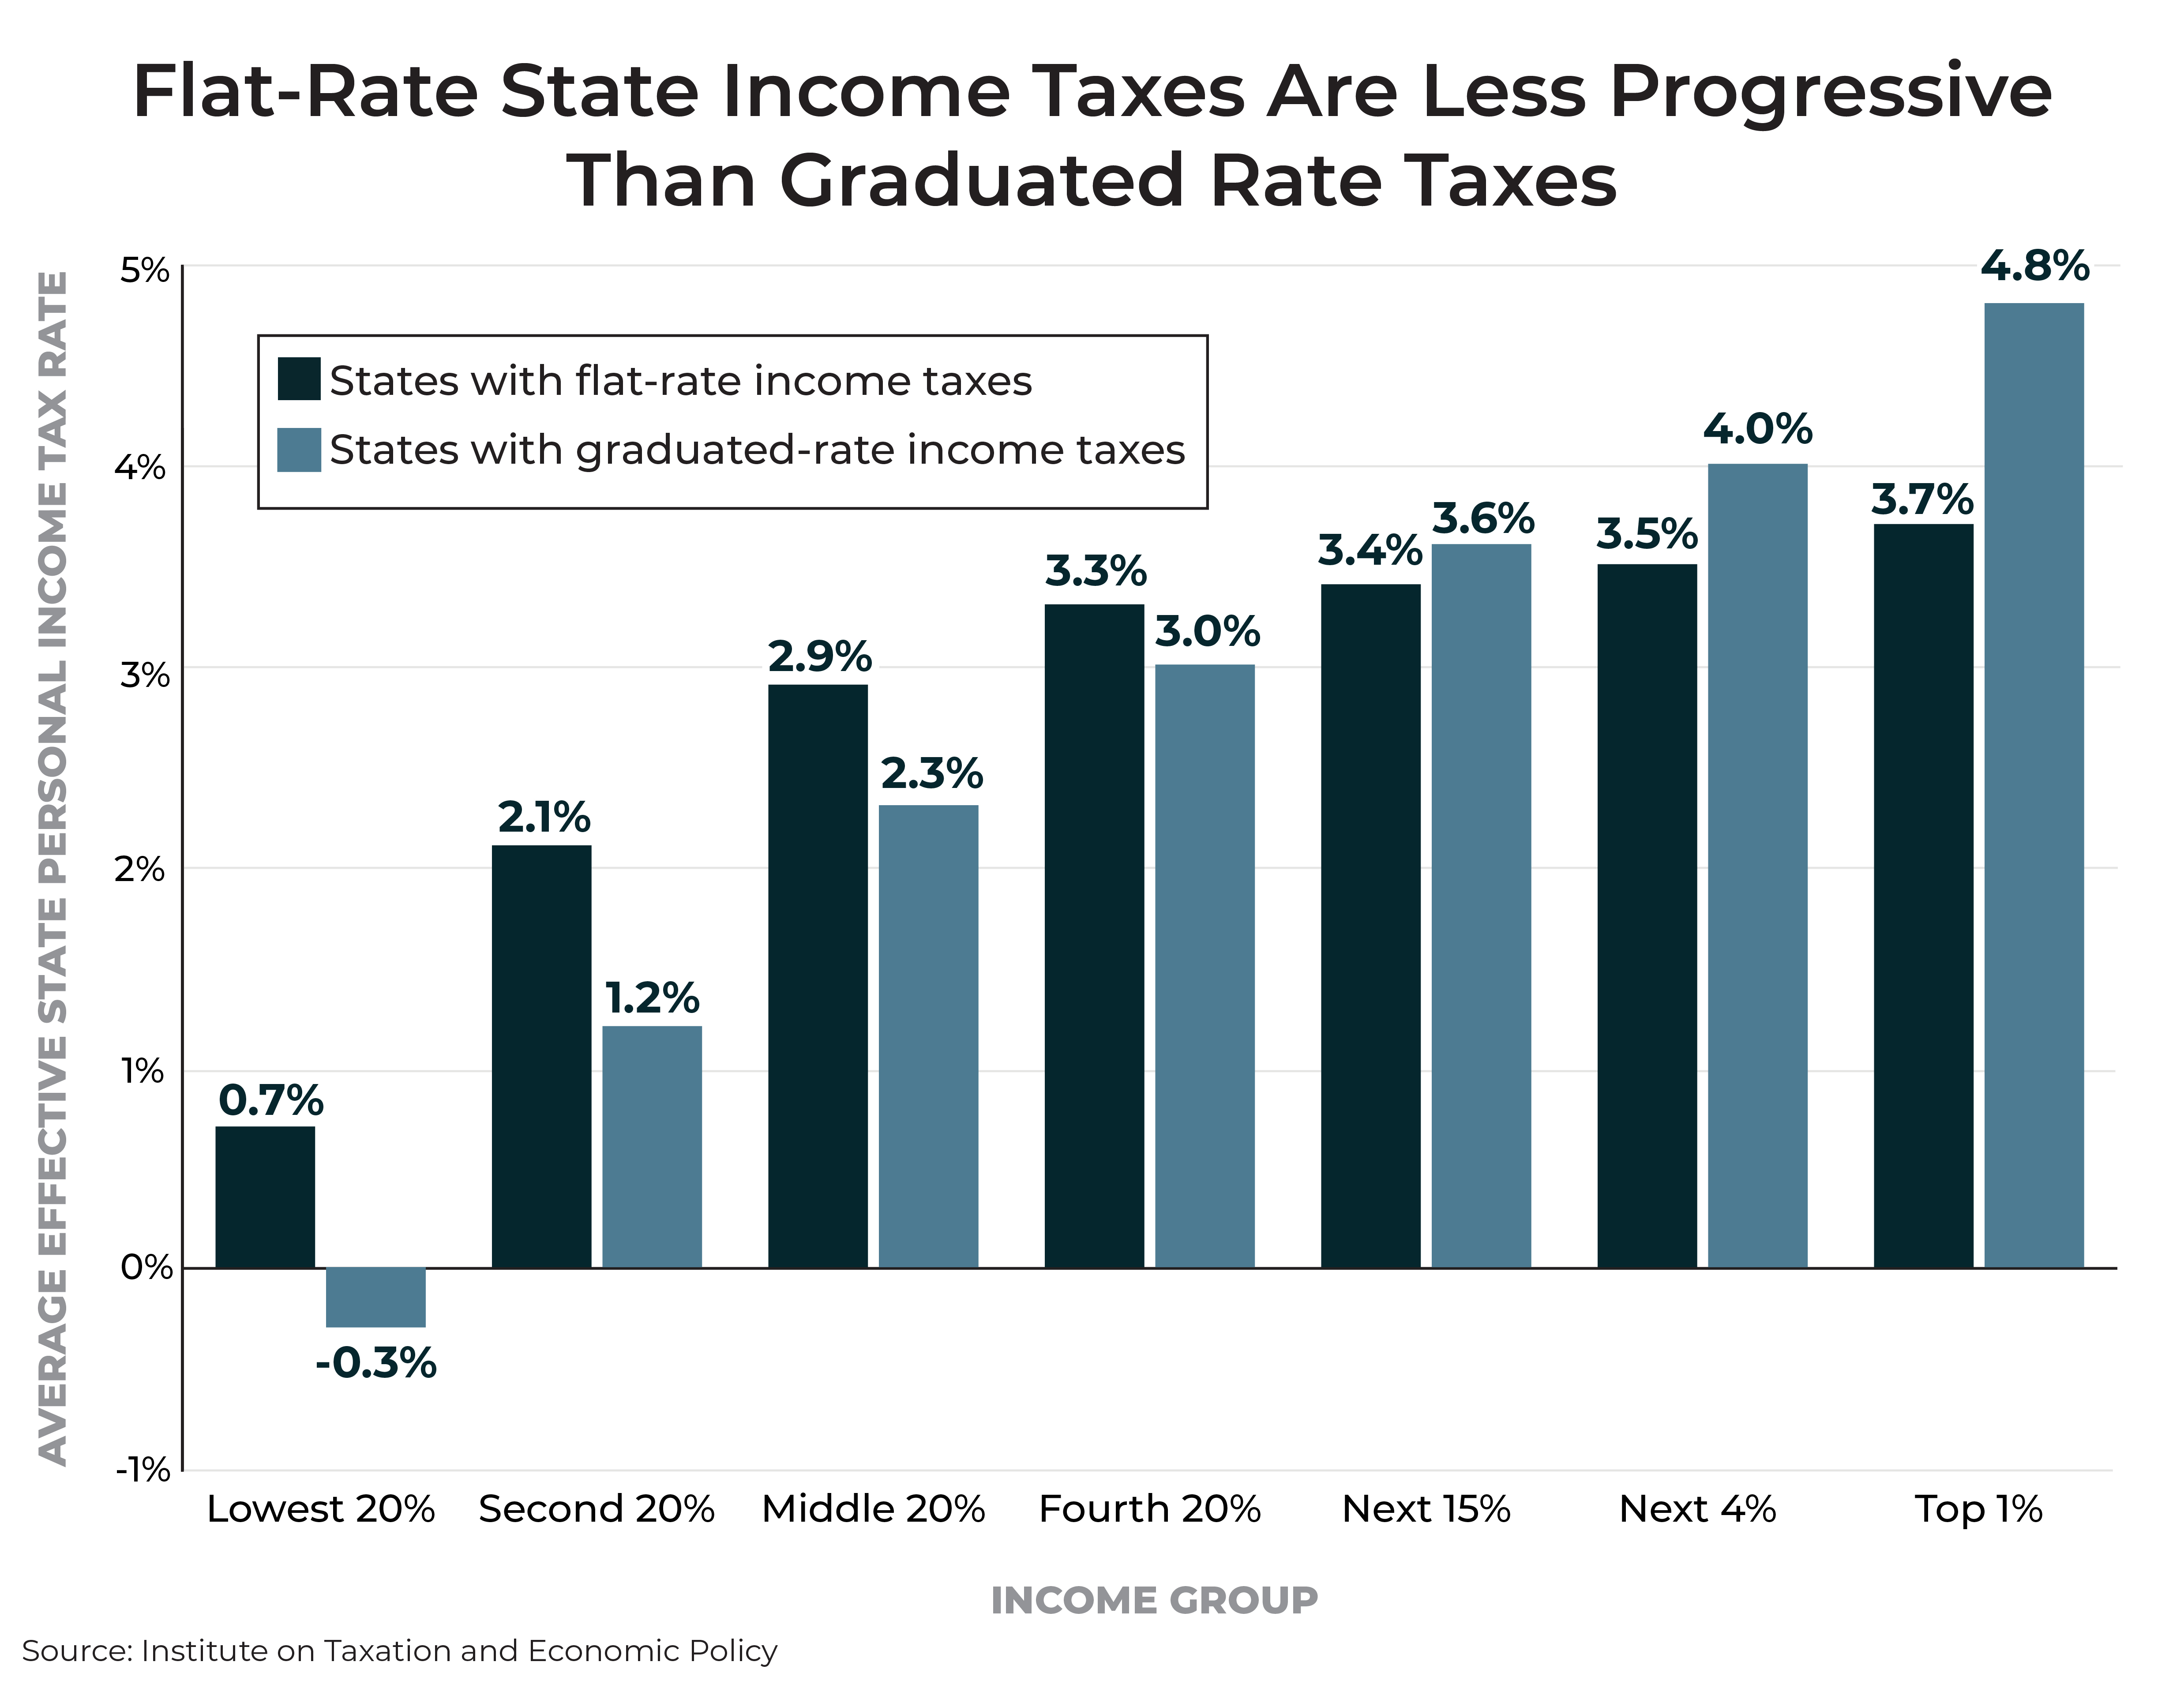
States taxing personal income take one of two general approaches: a flat rate applied to all taxable income or a graduated system in which tax rates rise on larger incomes.
Graduated-rate income taxes tend to be more progressive than flat-rate taxes. Because they allow states to collect more revenues from high-income taxpayers, graduated-rate taxes also typically allow for lower tax bills for low- and middle-income families. The middle 20 percent of individuals and families in states with flat-rate taxes, for example, tend to pay 2.9 percent of what they earn in income taxes. In states with graduated-rate taxes, by contrast, that figure is just 2.3 percent.
Note: Of 41 states with broad-based state personal income taxes, nine levy flat-rate taxes and 32 (plus the District of Columbia) levy taxes with a graduated rate structure. The states with flat-rate taxes are Colorado, Illinois, Indiana, Kentucky, Massachusetts, Michigan, North Carolina, Pennsylvania, and Utah.
Sales and Excise Taxes
8. Sales taxes require low- and moderate-income families to pay far more of their income in tax.
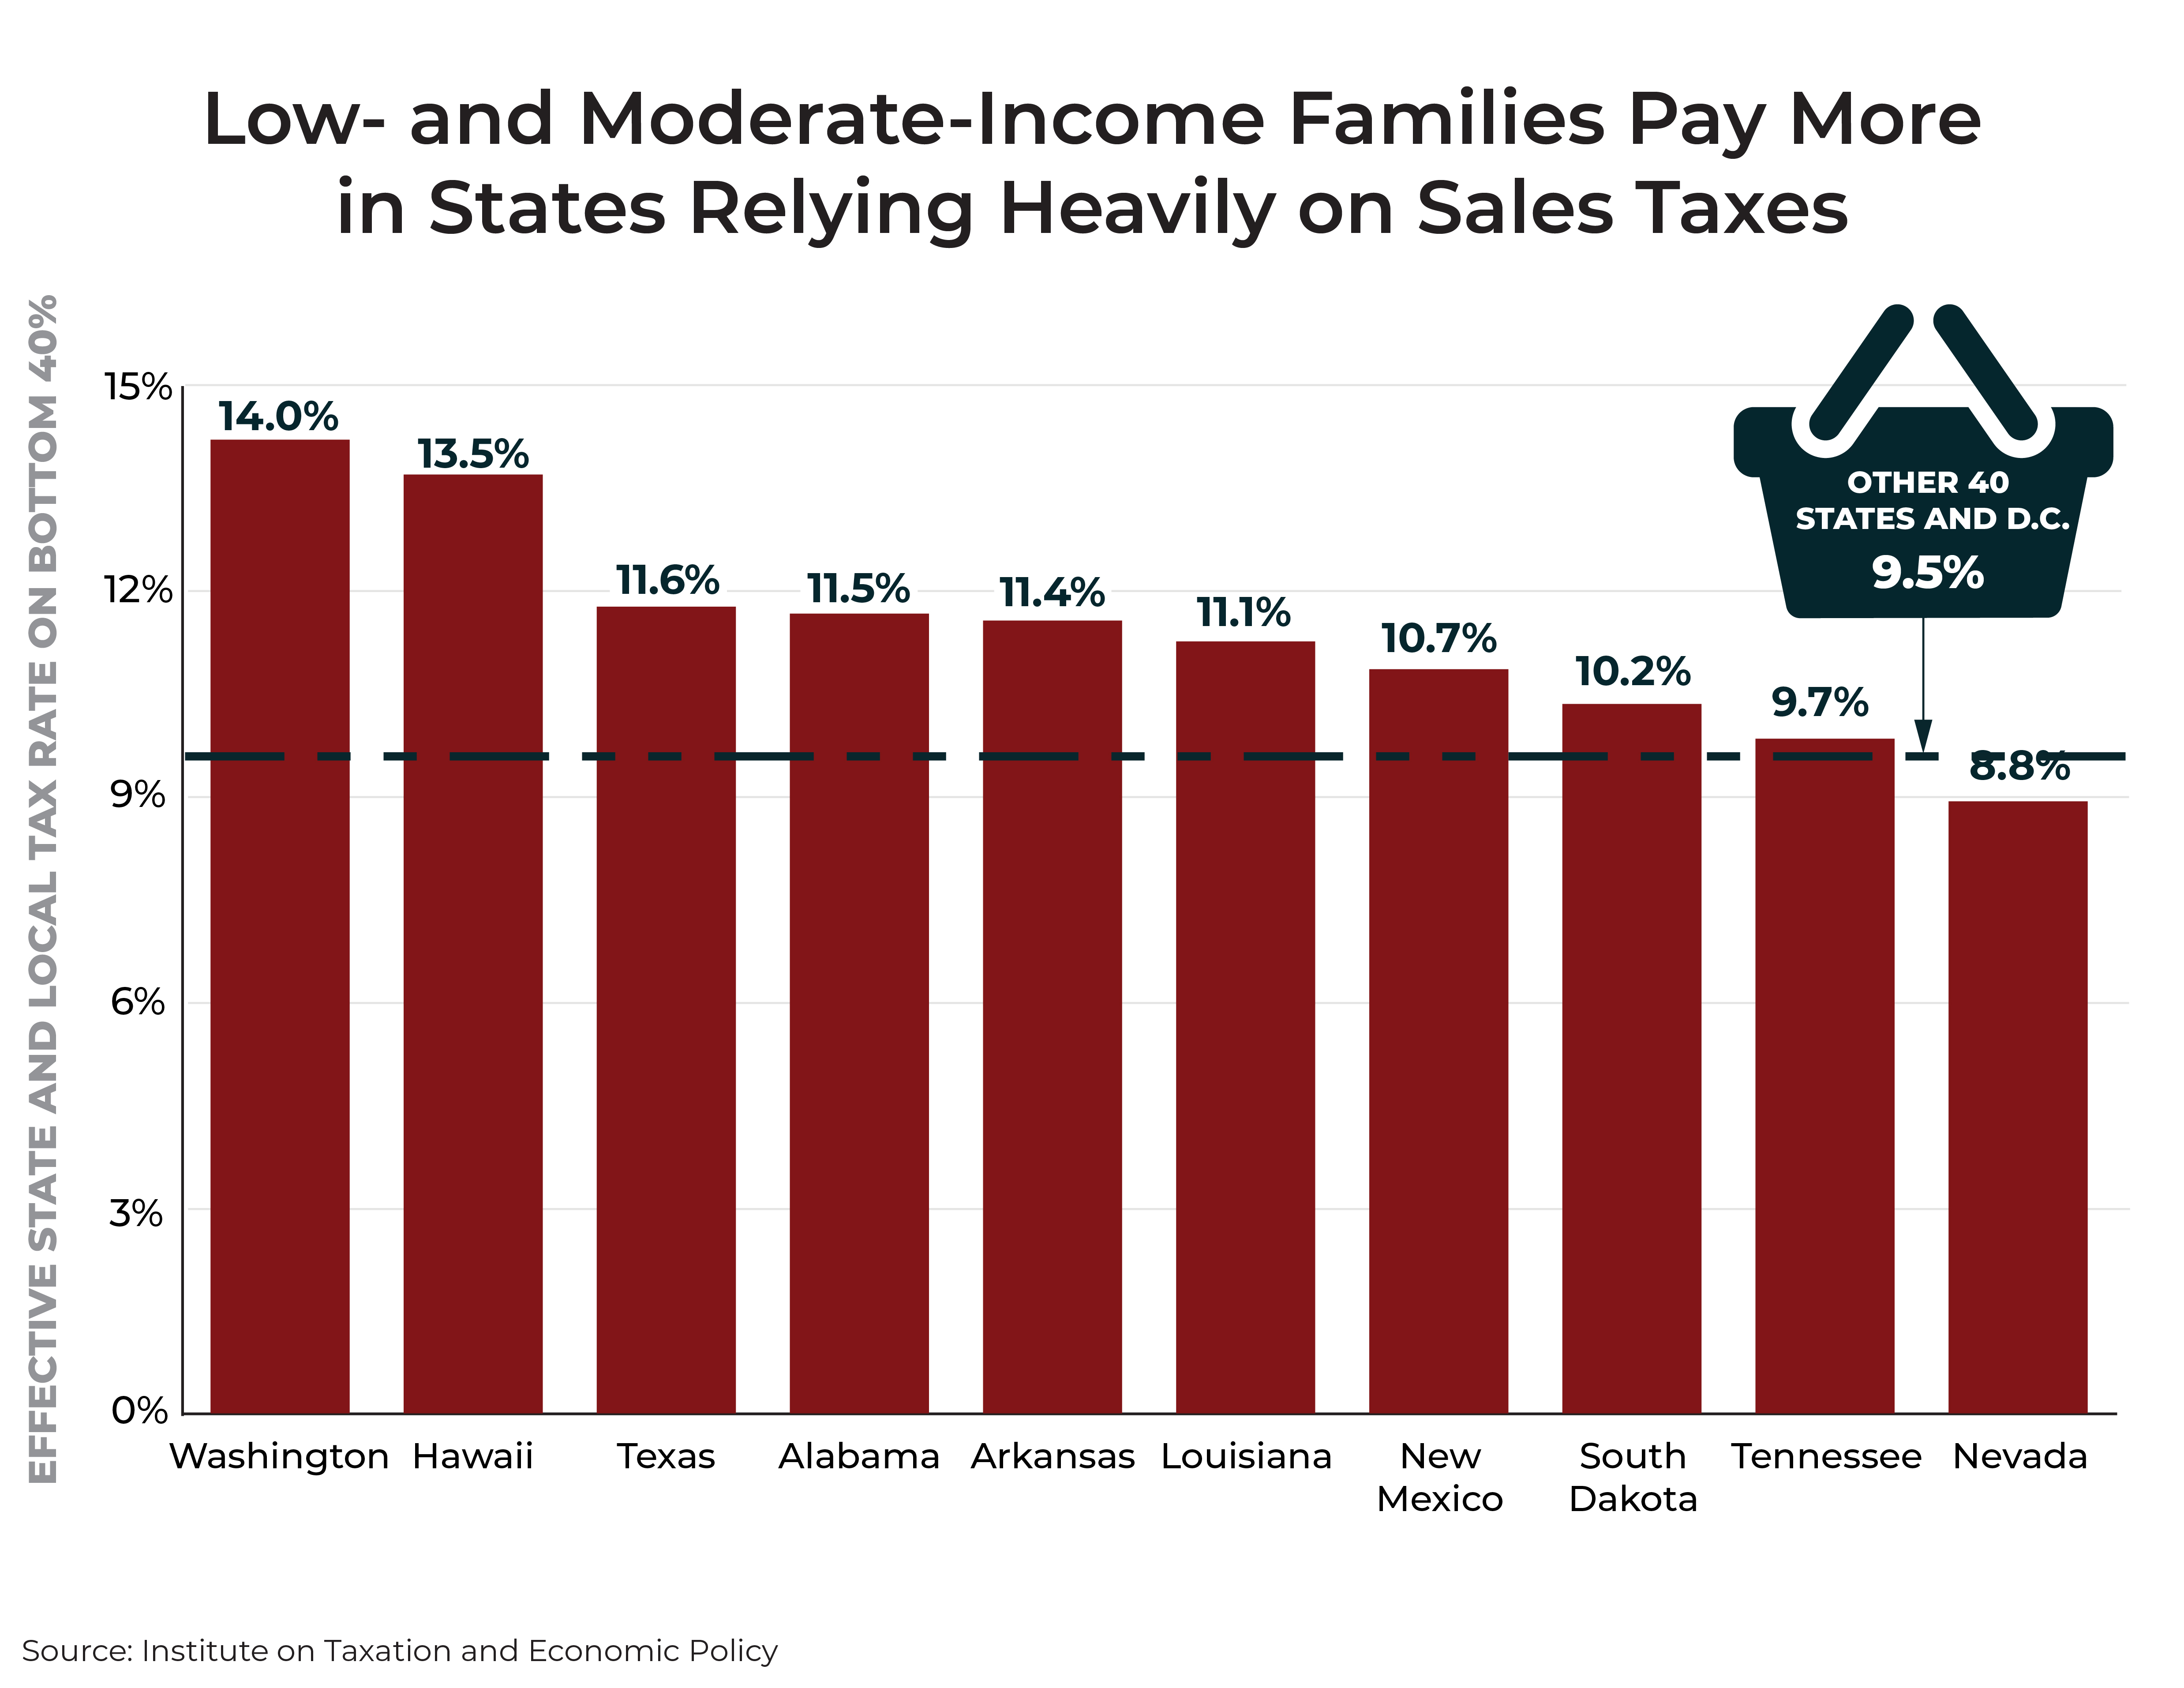
Eight of 10 states most reliant on general sales tax revenue to fund government require the bottom 40 percent of earners to devote 10 percent, or more, of their income to state and local taxes each year. Among the other 40 states, state and local taxes average 9.5 percent of income for this group. Choosing to fund government largely through sales taxes affects low- and moderate-income families most since they tend to spend a larger share of their earnings on items subject to sales tax.
Note: Reliance on general sales taxes is measured relative to state and local own-source revenue in Fiscal Year 2016, as reported by the U.S. Census Bureau.
9. Sales taxes often determine if a state is “low tax” or “high tax” for low- and moderate-income families.
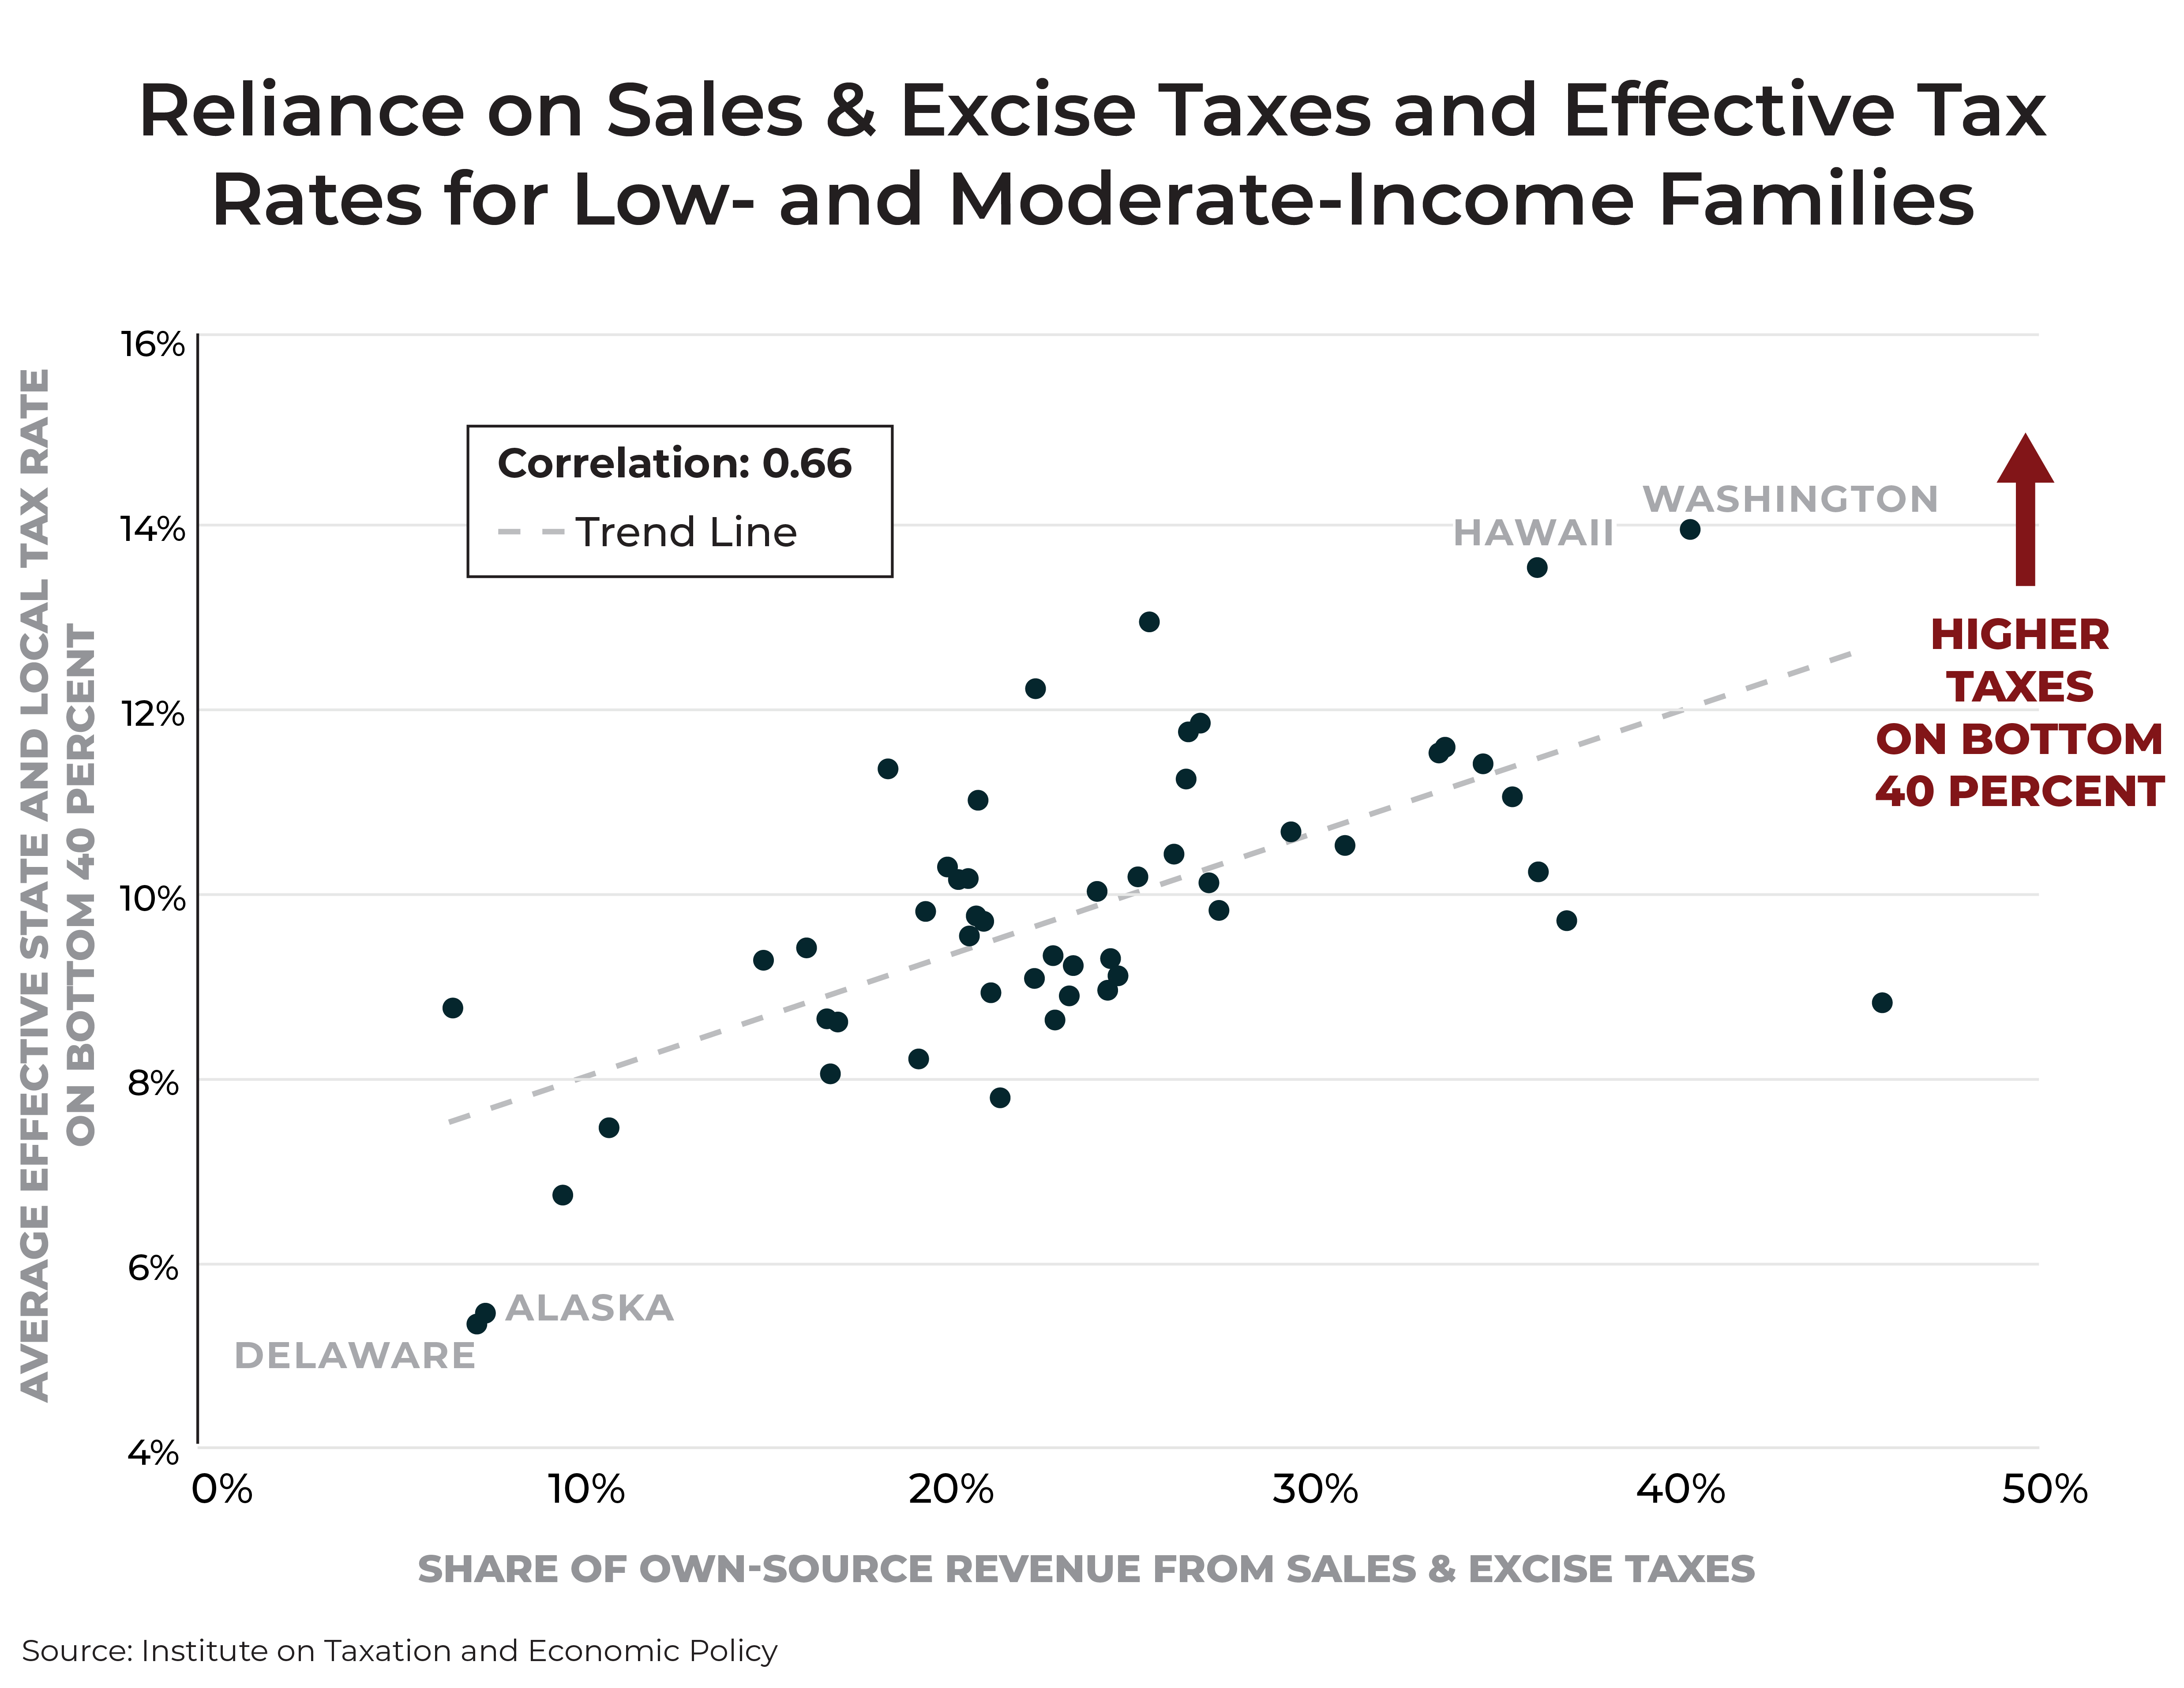
While there is no single determinant of whether a state is “low tax” or “high tax” for the bottom 40 percent of earners, the level of reliance on sales and excise taxes has a major impact.
In states where sales and excise taxes account for 30 percent or more of state and local revenue, effective tax rates on lower-income people almost always exceed 10 percent.
In states deriving 15 percent or less of their revenue from these sources, effective tax rates on this group are 8 percent or less.
Note: Reliance on state and local sales and excise taxes is measured relative to state and local own-source revenue in Fiscal Year 2016, as reported by the U.S. Census Bureau.
Comparing Sales and Income Taxes
10. Most middle-income and low-income taxpayers pay more in sales and excise taxes than in income taxes.
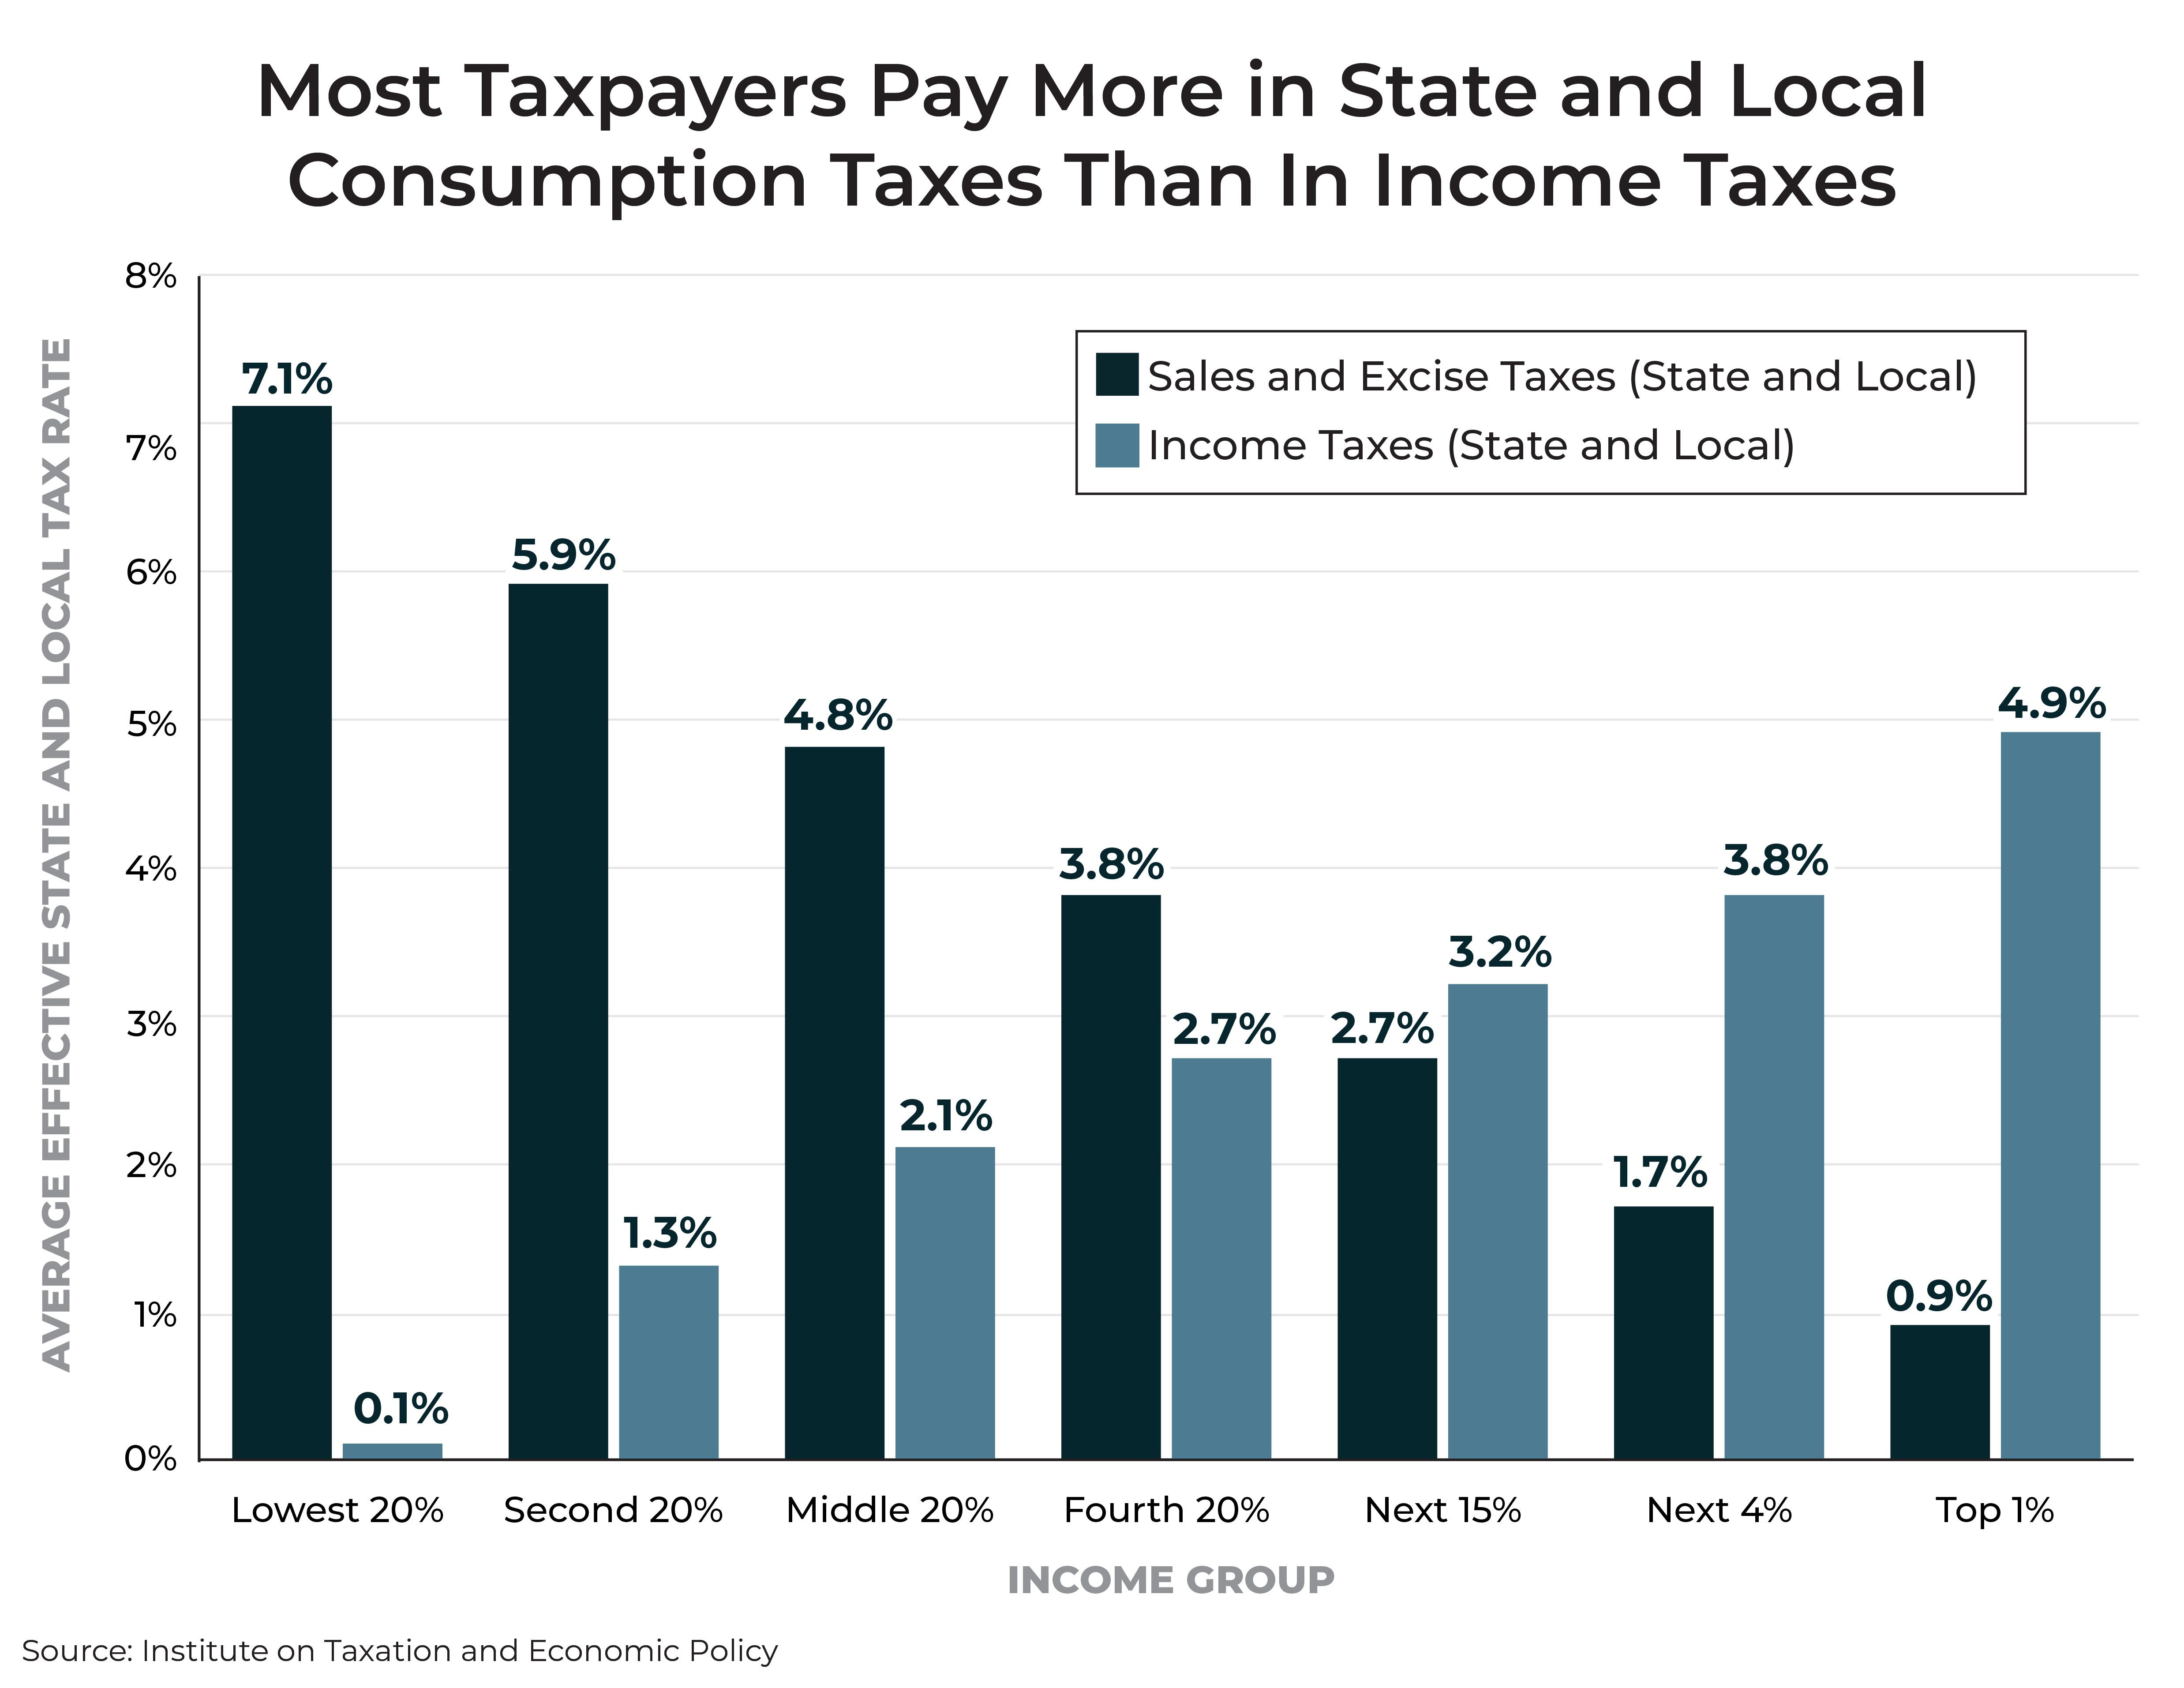
Personal income tax returns reveal how much individuals and families pay in income taxes. But most taxpayers cannot measure how much sales and excise tax they pay on purchases made in a given year. As it turns out, middle- and low-income taxpayers typically pay more taxes to their state and local governments based on what they buy (sales and excise taxes) than on what they earn (income taxes).
Proponents of state income tax cuts often overlook this fact, and sometimes even propose policies that would intensify it by swapping lower income taxes for higher sales and excise taxes. Proposals to decrease income taxes that largely impact the wealthy while increasing the less visible sales and excise taxes that impact families of more modest means would exacerbate the upside-down nature of state tax codes.
Note: These figures are national averages. Income tax category includes both personal and corporate income taxes.
Tax Fairness and Income Inequality
11. The most lopsided state and local tax codes include a flat income tax or no income tax at all.
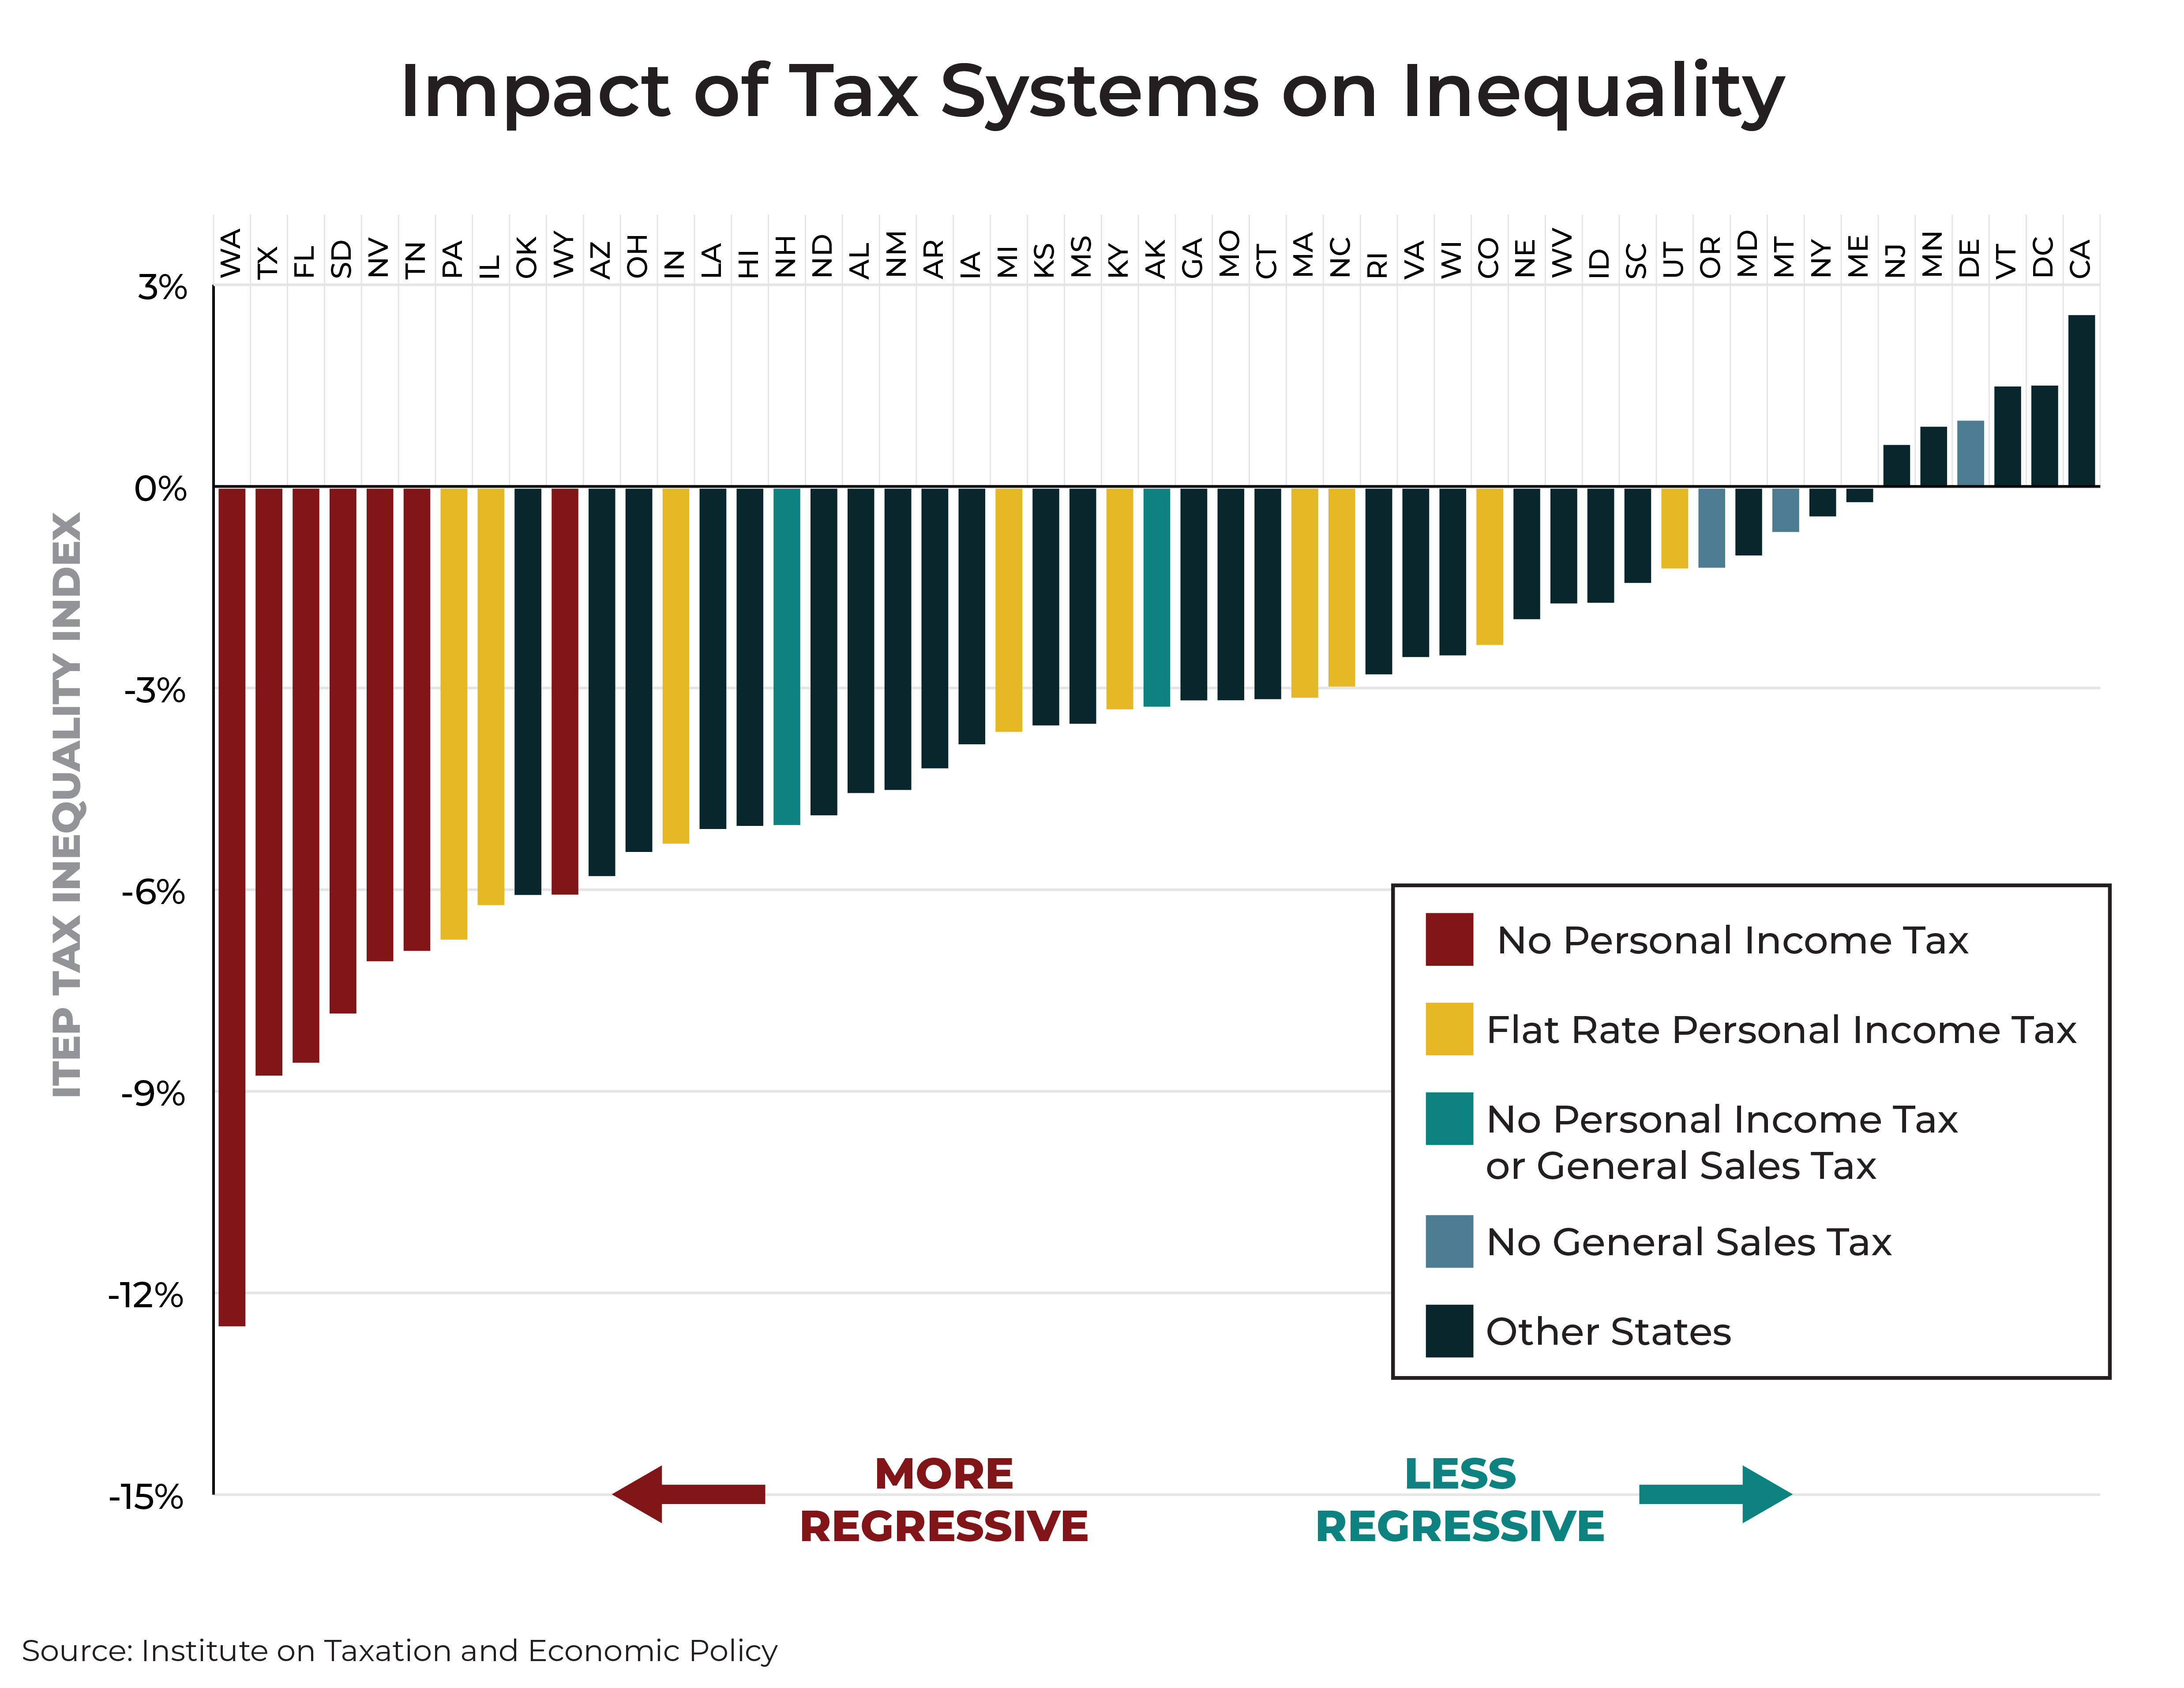
The ITEP Tax Inequality Index measures the effects of each state’s tax system on income inequality. It examines whether the gap in families’ shares of income is wider or narrower after state and local taxes. States with regressive tax structures have negative inequality index scores, meaning that incomes are less equal in those states after state and local taxes than before. The farther the score falls below zero, the more regressive the tax code.
Of the 10 most regressive state and local tax systems in the nation, nine levy either a flat income tax or no personal income tax at all. By contrast, the 10 least regressive states (including six states with moderately progressive codes) all use graduated-rate personal income taxes.
Note: An explanation of how the ITEP Tax Inequality Index is calculated is available in the methodology section of ITEP’s Who Pays? report.
12. States raising more of their revenue with sales and excise taxes tend to have more regressive tax systems.
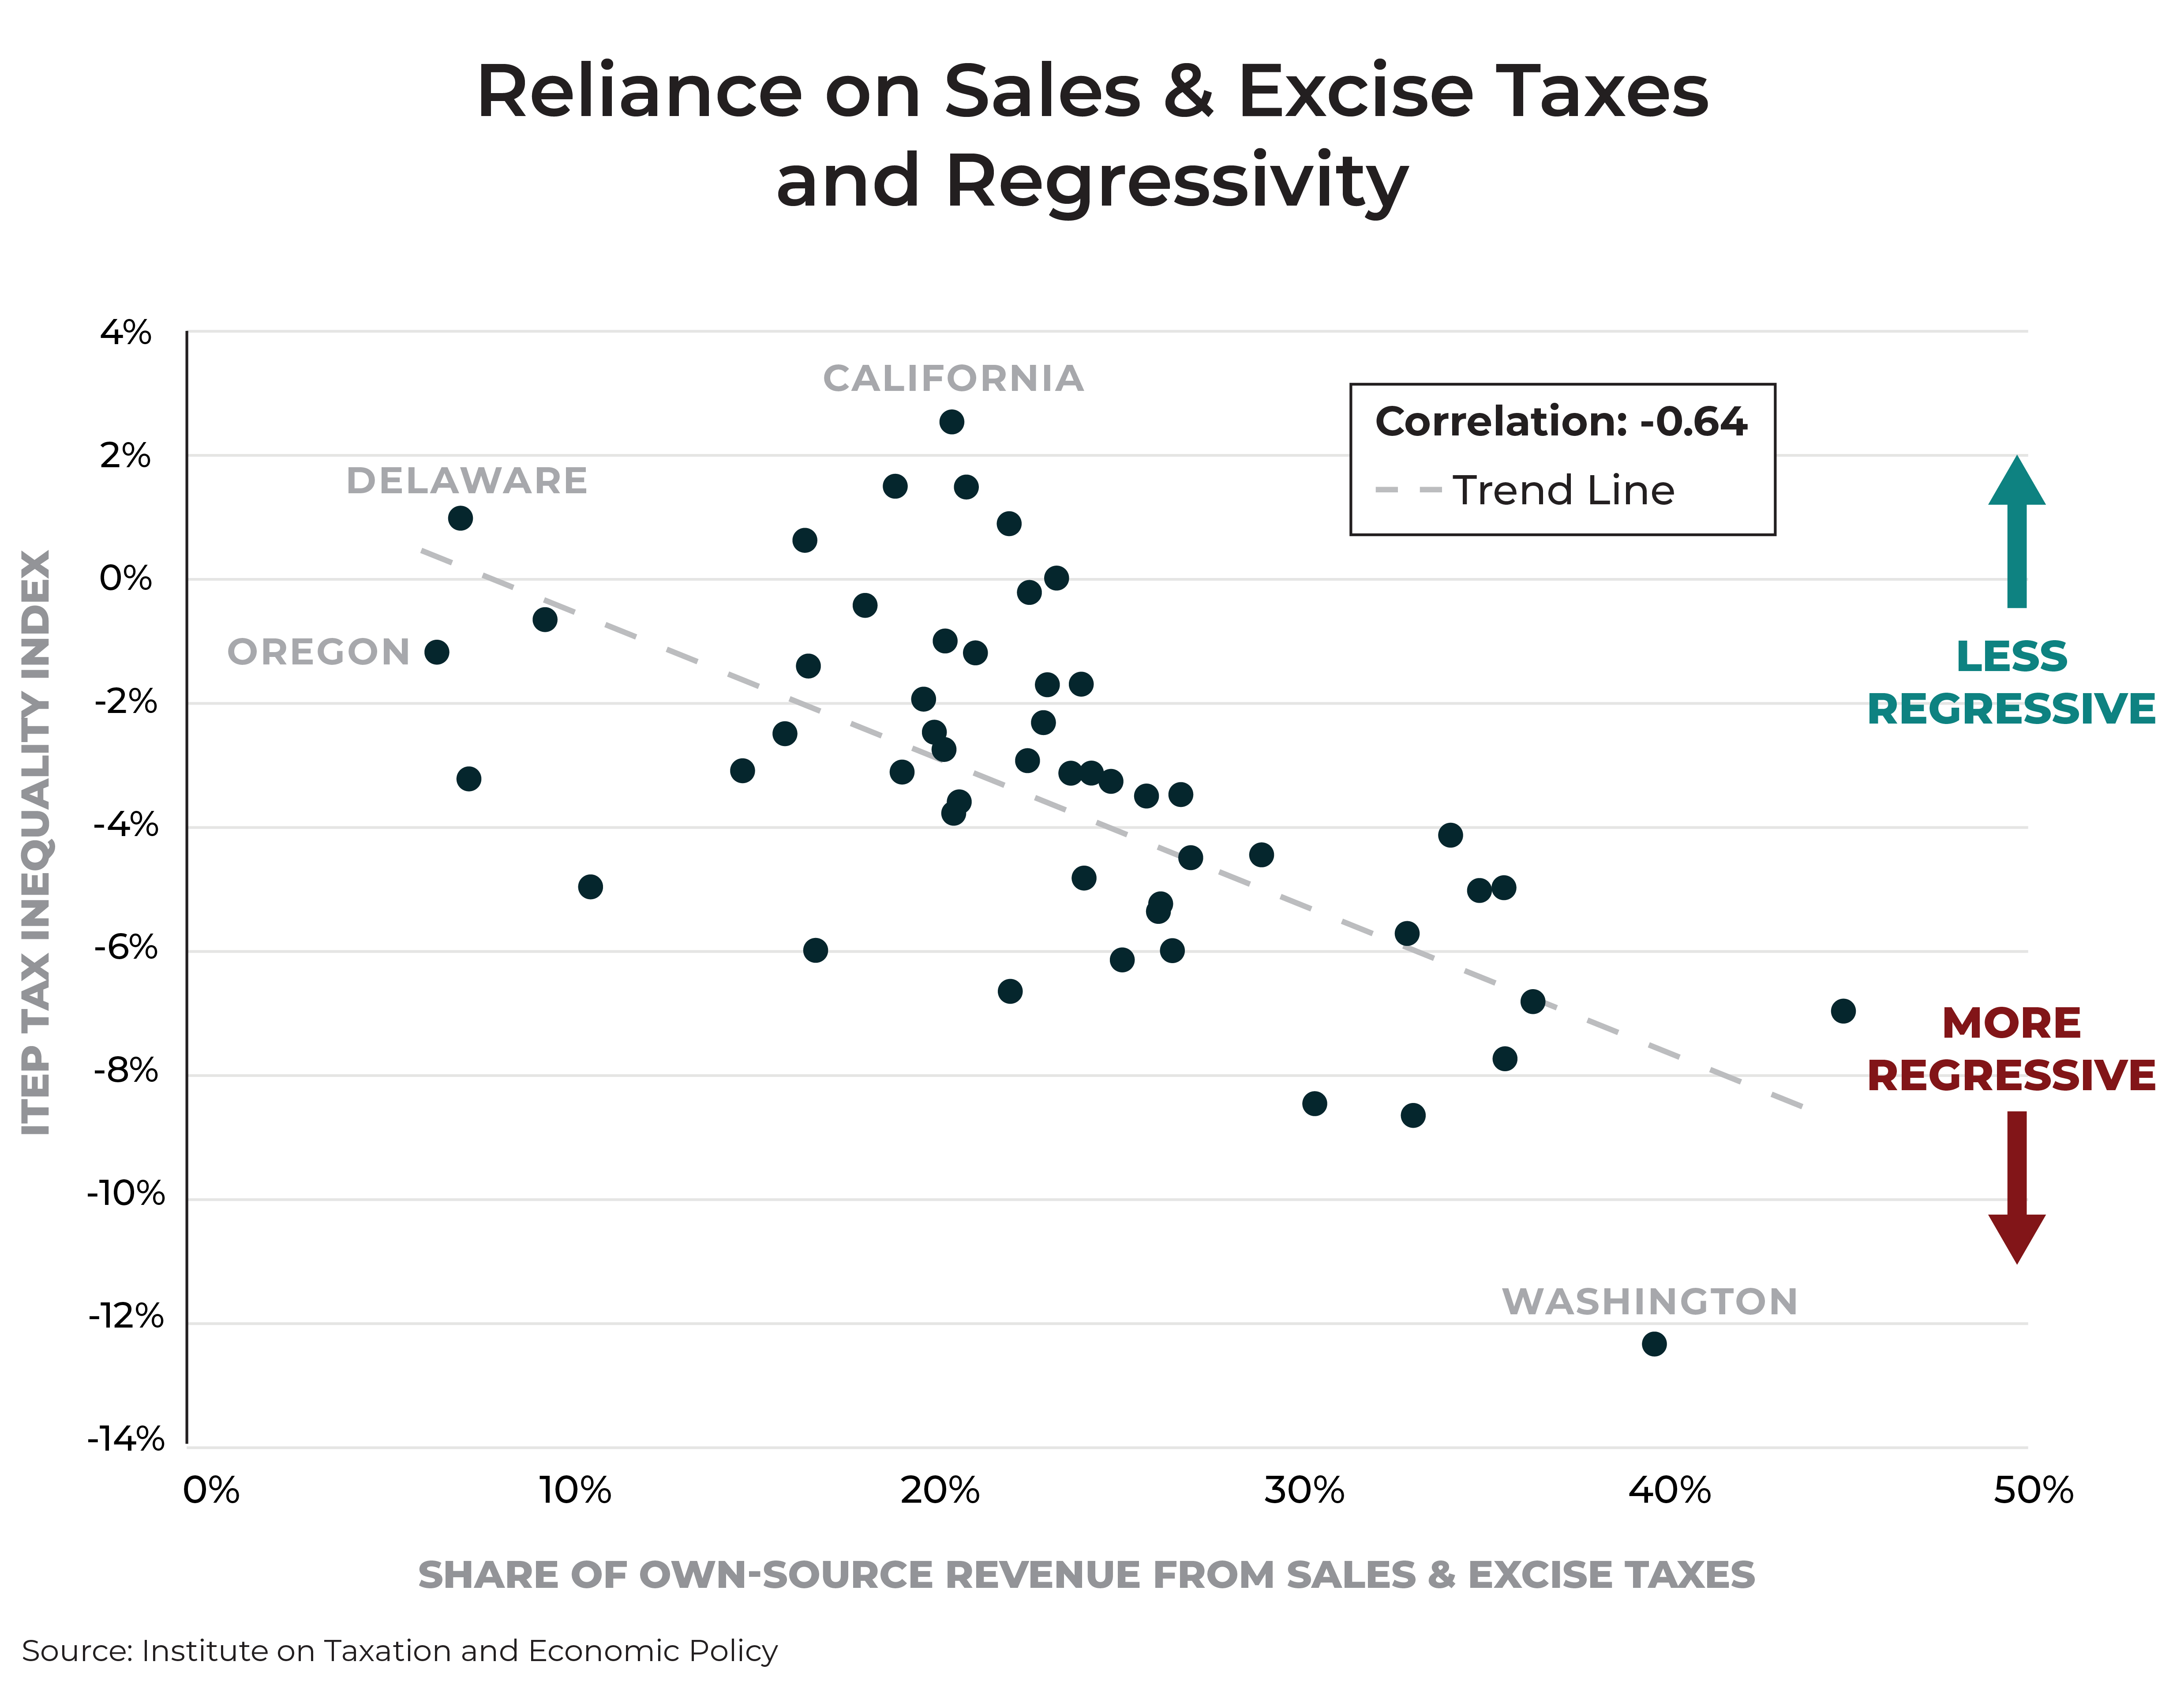
The scope of a government’s reliance on sales and excise tax to raise revenue, for example, is a key feature of regressive tax systems. States where a significant share of revenue is derived from taxes on consumption tend to receive lower scores in ITEP’s Tax Inequality Index, meaning that they fall disproportionately on low- and middle-income families rather than on families with large incomes.
Note: Reliance on state and local sales and excise taxes is measured relative to state and local own-source revenue in Fiscal Year 2016, as reported by the U.S. Census Bureau. An explanation of how the ITEP Tax Inequality Index is calculated is available in the methodology section of ITEP’s Who Pays? report.
13. Low-income taxpayers often pay state and local taxes at rates many times higher than high-income taxpayers.
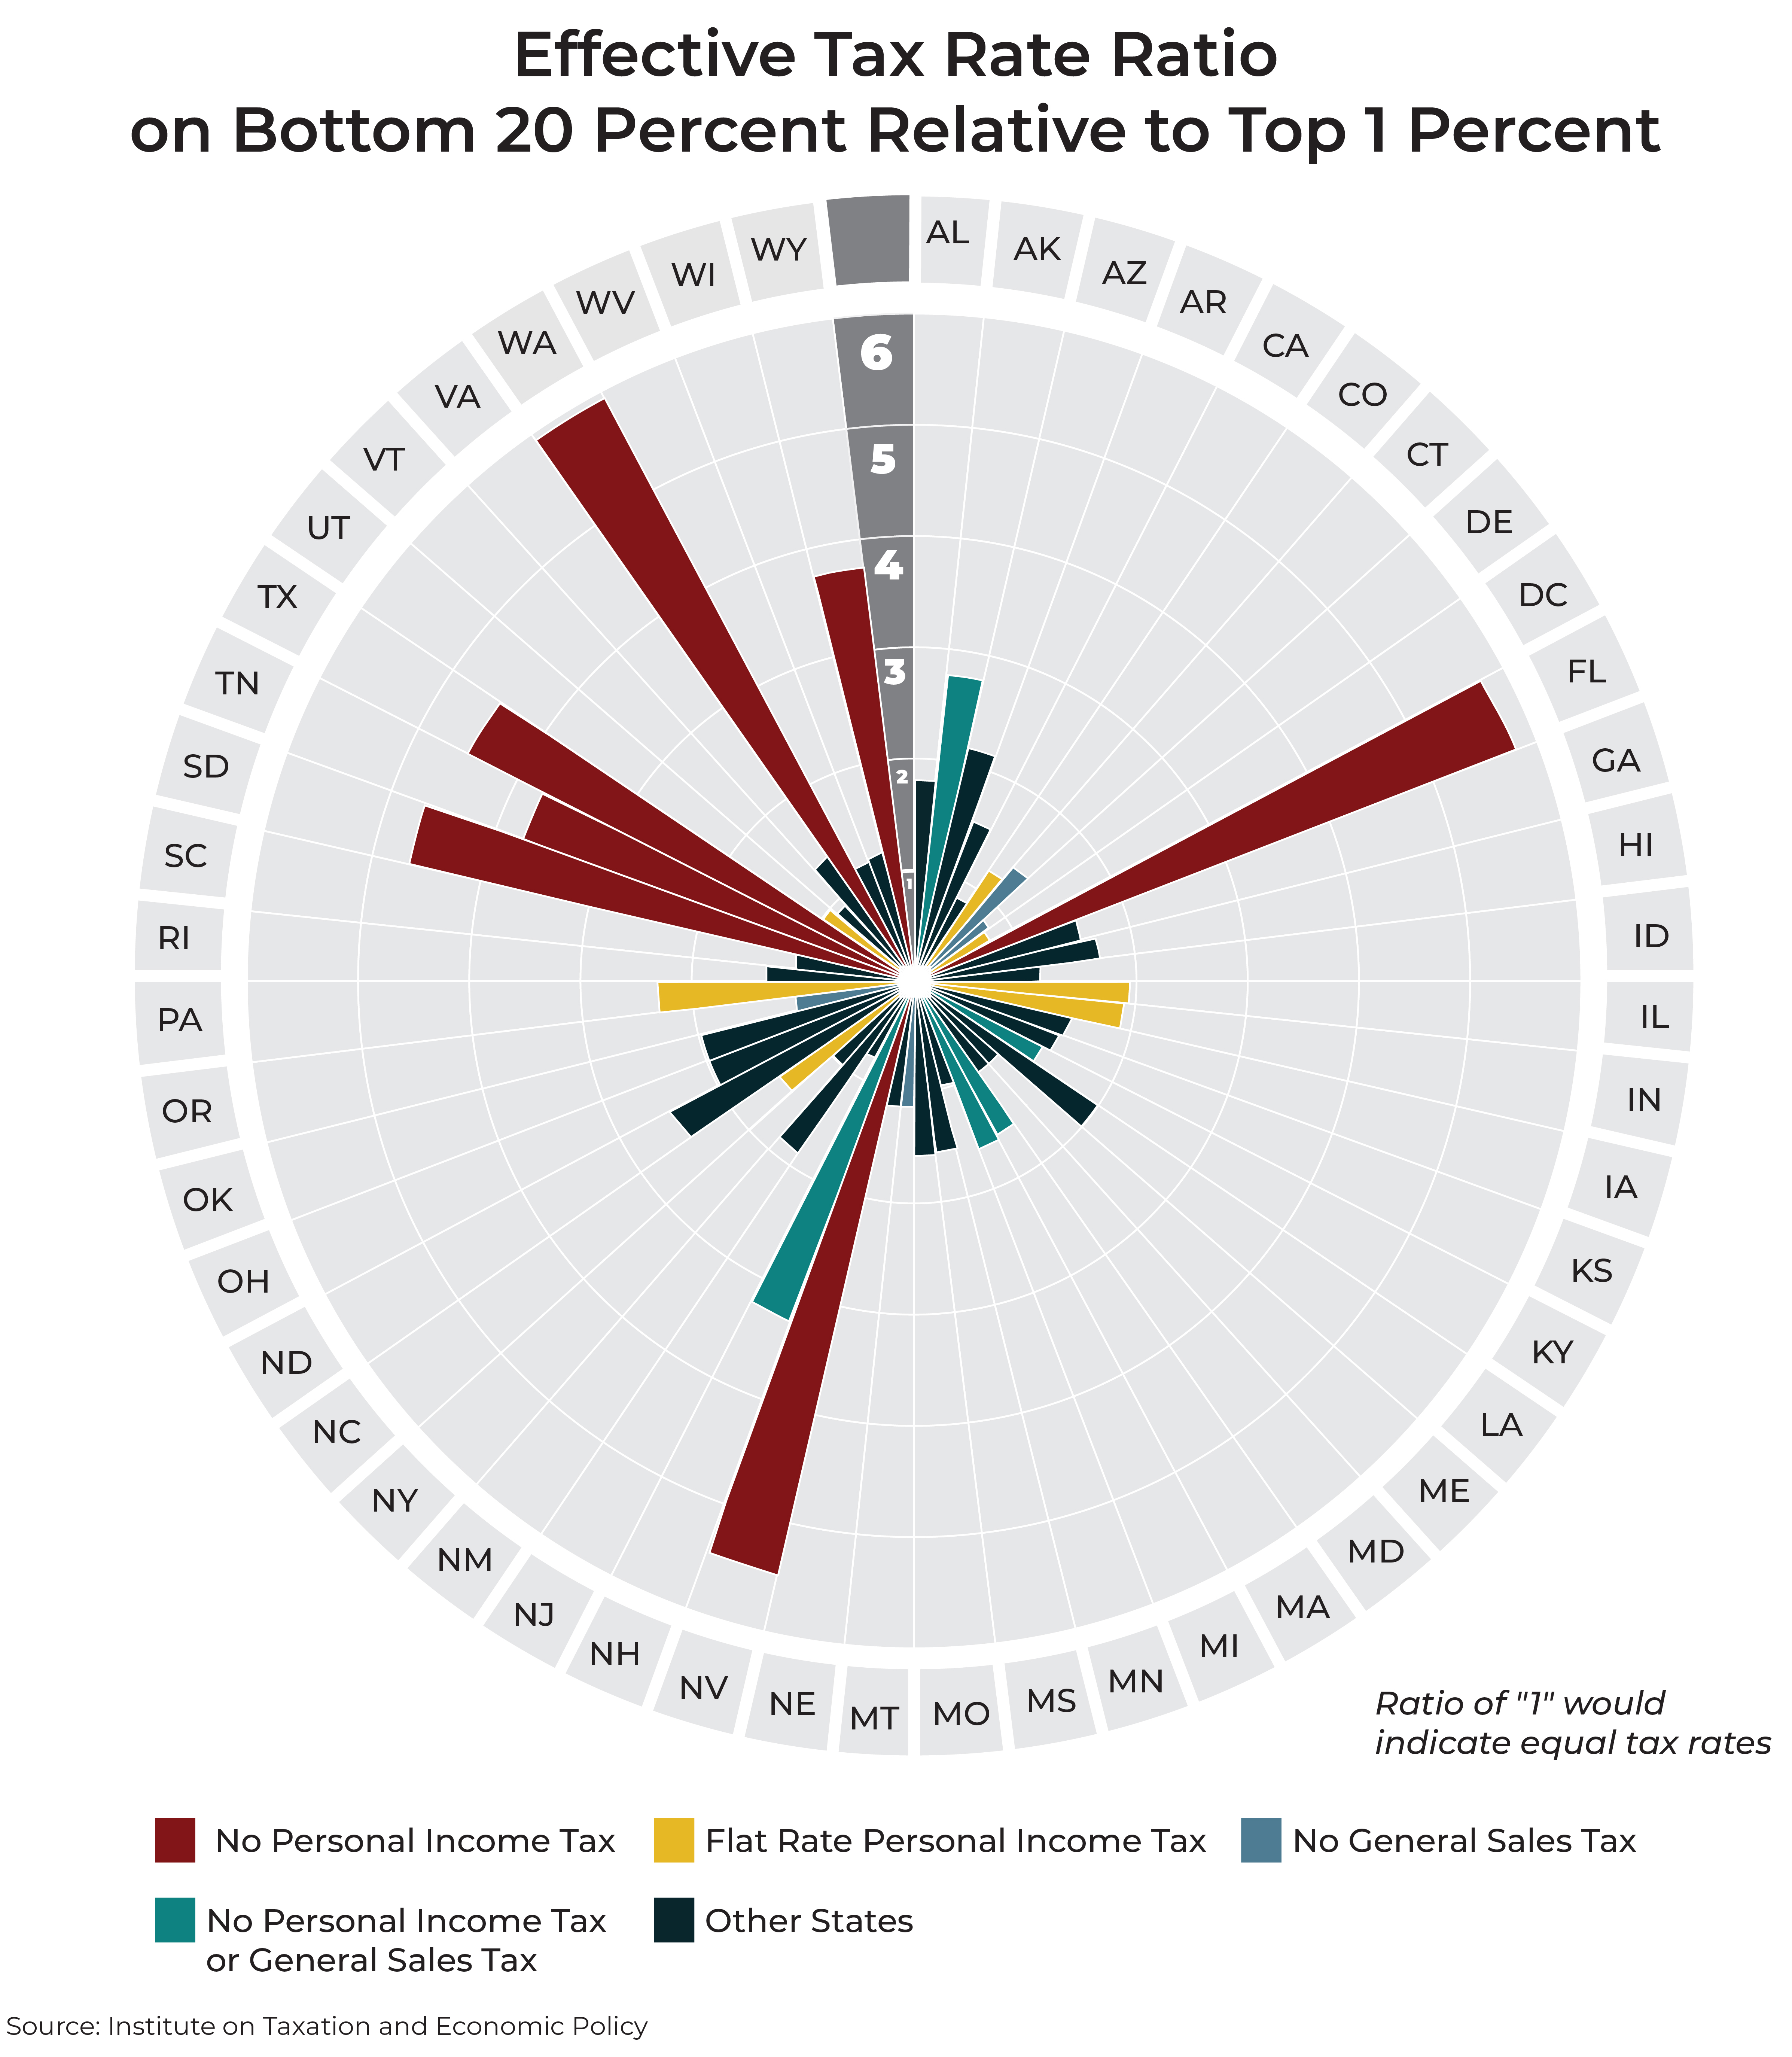
The gap in tax rates faced by low- and high-income residents varies considerably by state. At one end of the spectrum, states such as Washington, Florida, and Nevada tax their low-income residents at rates more than five times higher than rates charged to their high-income residents. At the other end of the spectrum, Delaware, Vermont, California, Minnesota, New Jersey, and the District of Columbia tax their lowest-income residents at a slightly lower rate than the wealthy.
Without exception, the largest disparities exist in states that fail to levy personal income taxes but that do levy general sales taxes. States with the smallest gaps, by contrast, levy graduated-rate personal income taxes.
Conclusion
This chart book illustrates that states lacking robust personal income taxes and relying heavily on consumption taxes have some of the most lopsided tax systems in the nation. These states require far higher payments, relative to income, from low- and moderate-income families than from the wealthy. They often levy above-average tax rates on families facing economic hardship and below-average rates on their most affluent residents. In other words, these states are effectively worsening income inequality through their tax policies.
Progressive taxes simply make better economic sense in the short and long term. Higher-income taxpayers are better equipped financially to pay higher rates and, furthermore, income is growing fastest among the wealthiest Americans. If states rely more on progressive taxes they are more likely to experience the revenue growth necessary to adequately fund their schools, infrastructure, and other public services that are essential to building thriving communities.
While there is room for improvement in every state’s tax code, the example set by states that have embraced robust, graduated-rate personal income taxes is a useful one for proponents of tax reform to keep in mind.
About the data in this chart book
Most data reflect combined state and local effective tax rates for non-elderly taxpayers as reported in ITEP’s report: Who Pays?, A Distributional Analysis of the Tax Systems in All Fifty States, 6th Edition. Analysts produced the report using ITEP’s microsimulation tax model.
Unless otherwise noted, any averages reported for groups of states are unweighted. Income group definitions vary by state in accordance with the distribution of income in each state. The District of Columbia is treated as a state in groupings of states.