Key Findings
- The recent runup in gasoline prices is on pace to cost American drivers an extra $9.4 billion per month. For context, this is more than triple the size of the $2.8 billion monthly tax cut on tips and overtime found in last year’s federal tax bill.
- Gasoline prices are up dramatically across the country, but the South has been hit hardest and is on pace to pay $4.2 billion more per month. The average driving-age person in the South will pay $39 more per month in higher gas prices, compared to $34 nationally or $24 in the Northeast. If gas prices remain elevated, the average additional cost for households will be several hundred dollars per year.
- Alabama is the most affected state in the nation, with residents spending $52 more per person, per month. The other most heavily impacted states are Mississippi ($51), Wyoming ($49), Kentucky ($47), and New Mexico ($44).
- Some lawmakers are discussing gas tax holidays to mitigate the pain drivers are feeling at the pump, but these holidays are largely symbolic and, in practice, will put money in the pocket of the oil industry, give little to people struggling with rising prices, and reduce funding for infrastructure projects that directly benefit drivers.
- A federal gas tax holiday would cost $2.4 billion per month in federal revenues, but the average monthly savings for those making less than $53,000 per year would be only $5 per family.
- State gas tax holidays will help corporations and visitors far more than those having a hard time paying for gas. In Georgia, a gas tax holiday recently enacted into law will cost $196 million per month and the bottom 60 percent of Georgia families will collect just 22 percent of the tax cuts—or $13 per family. Forty percent of the tax cut will flow to people who are not even residents of Georgia.
- A proposed gas tax holiday in Connecticut would cost $41 million per month and the bottom 60 percent of Connecticut families would receive just 21 percent of this tax cut—for an average of $8 per family.
Gas Price Increases
The Iran war has sent gas prices soaring by roughly $1.00 per gallon compared to a month ago. By combining gas price data from AAA with data on gas usage by state from the Federal Highway Administration, among other data sources, we are able to measure the impact of higher gas prices nationally, by state, and by region. We find that if current gas price increases persist, American drivers will pay an extra $9.4 billion per month for gasoline.
It bears noting that this figure understates the true economic impact of higher fuel prices because it examines only the impact of higher gasoline prices on individual drivers and it omits the impact that higher fuel prices paid by businesses and governments have on American consumers, business owners, and taxpayers.
While drivers in every state are paying substantially more for gasoline, the effect of these higher prices is being felt unevenly across the country. Partly this is because some states have seen more dramatic price increases than others. And partly it is because residents of some states purchase more gasoline because their populations are more dispersed, commutes are longer, transit service is sparser, and even the types of vehicles people own are different.
The impact of higher gas prices on the South is particularly severe because Southerners tend to purchase more gasoline than residents of other regions. In total, residents of the South will pay $4.2 billion of the $9.4 billion added nationwide expense created by higher gasoline prices. As seen in Figure 1, Southerners are also facing significantly higher impacts, per person, than residents of other regions.
Impacts Per Person
Our analysis of the impact of higher gas prices on the typical driving-age person is presented in Figures 2 and 3, which confirm that a disproportionate number of Southern states are among those most affected by higher gas prices.
Figure 2
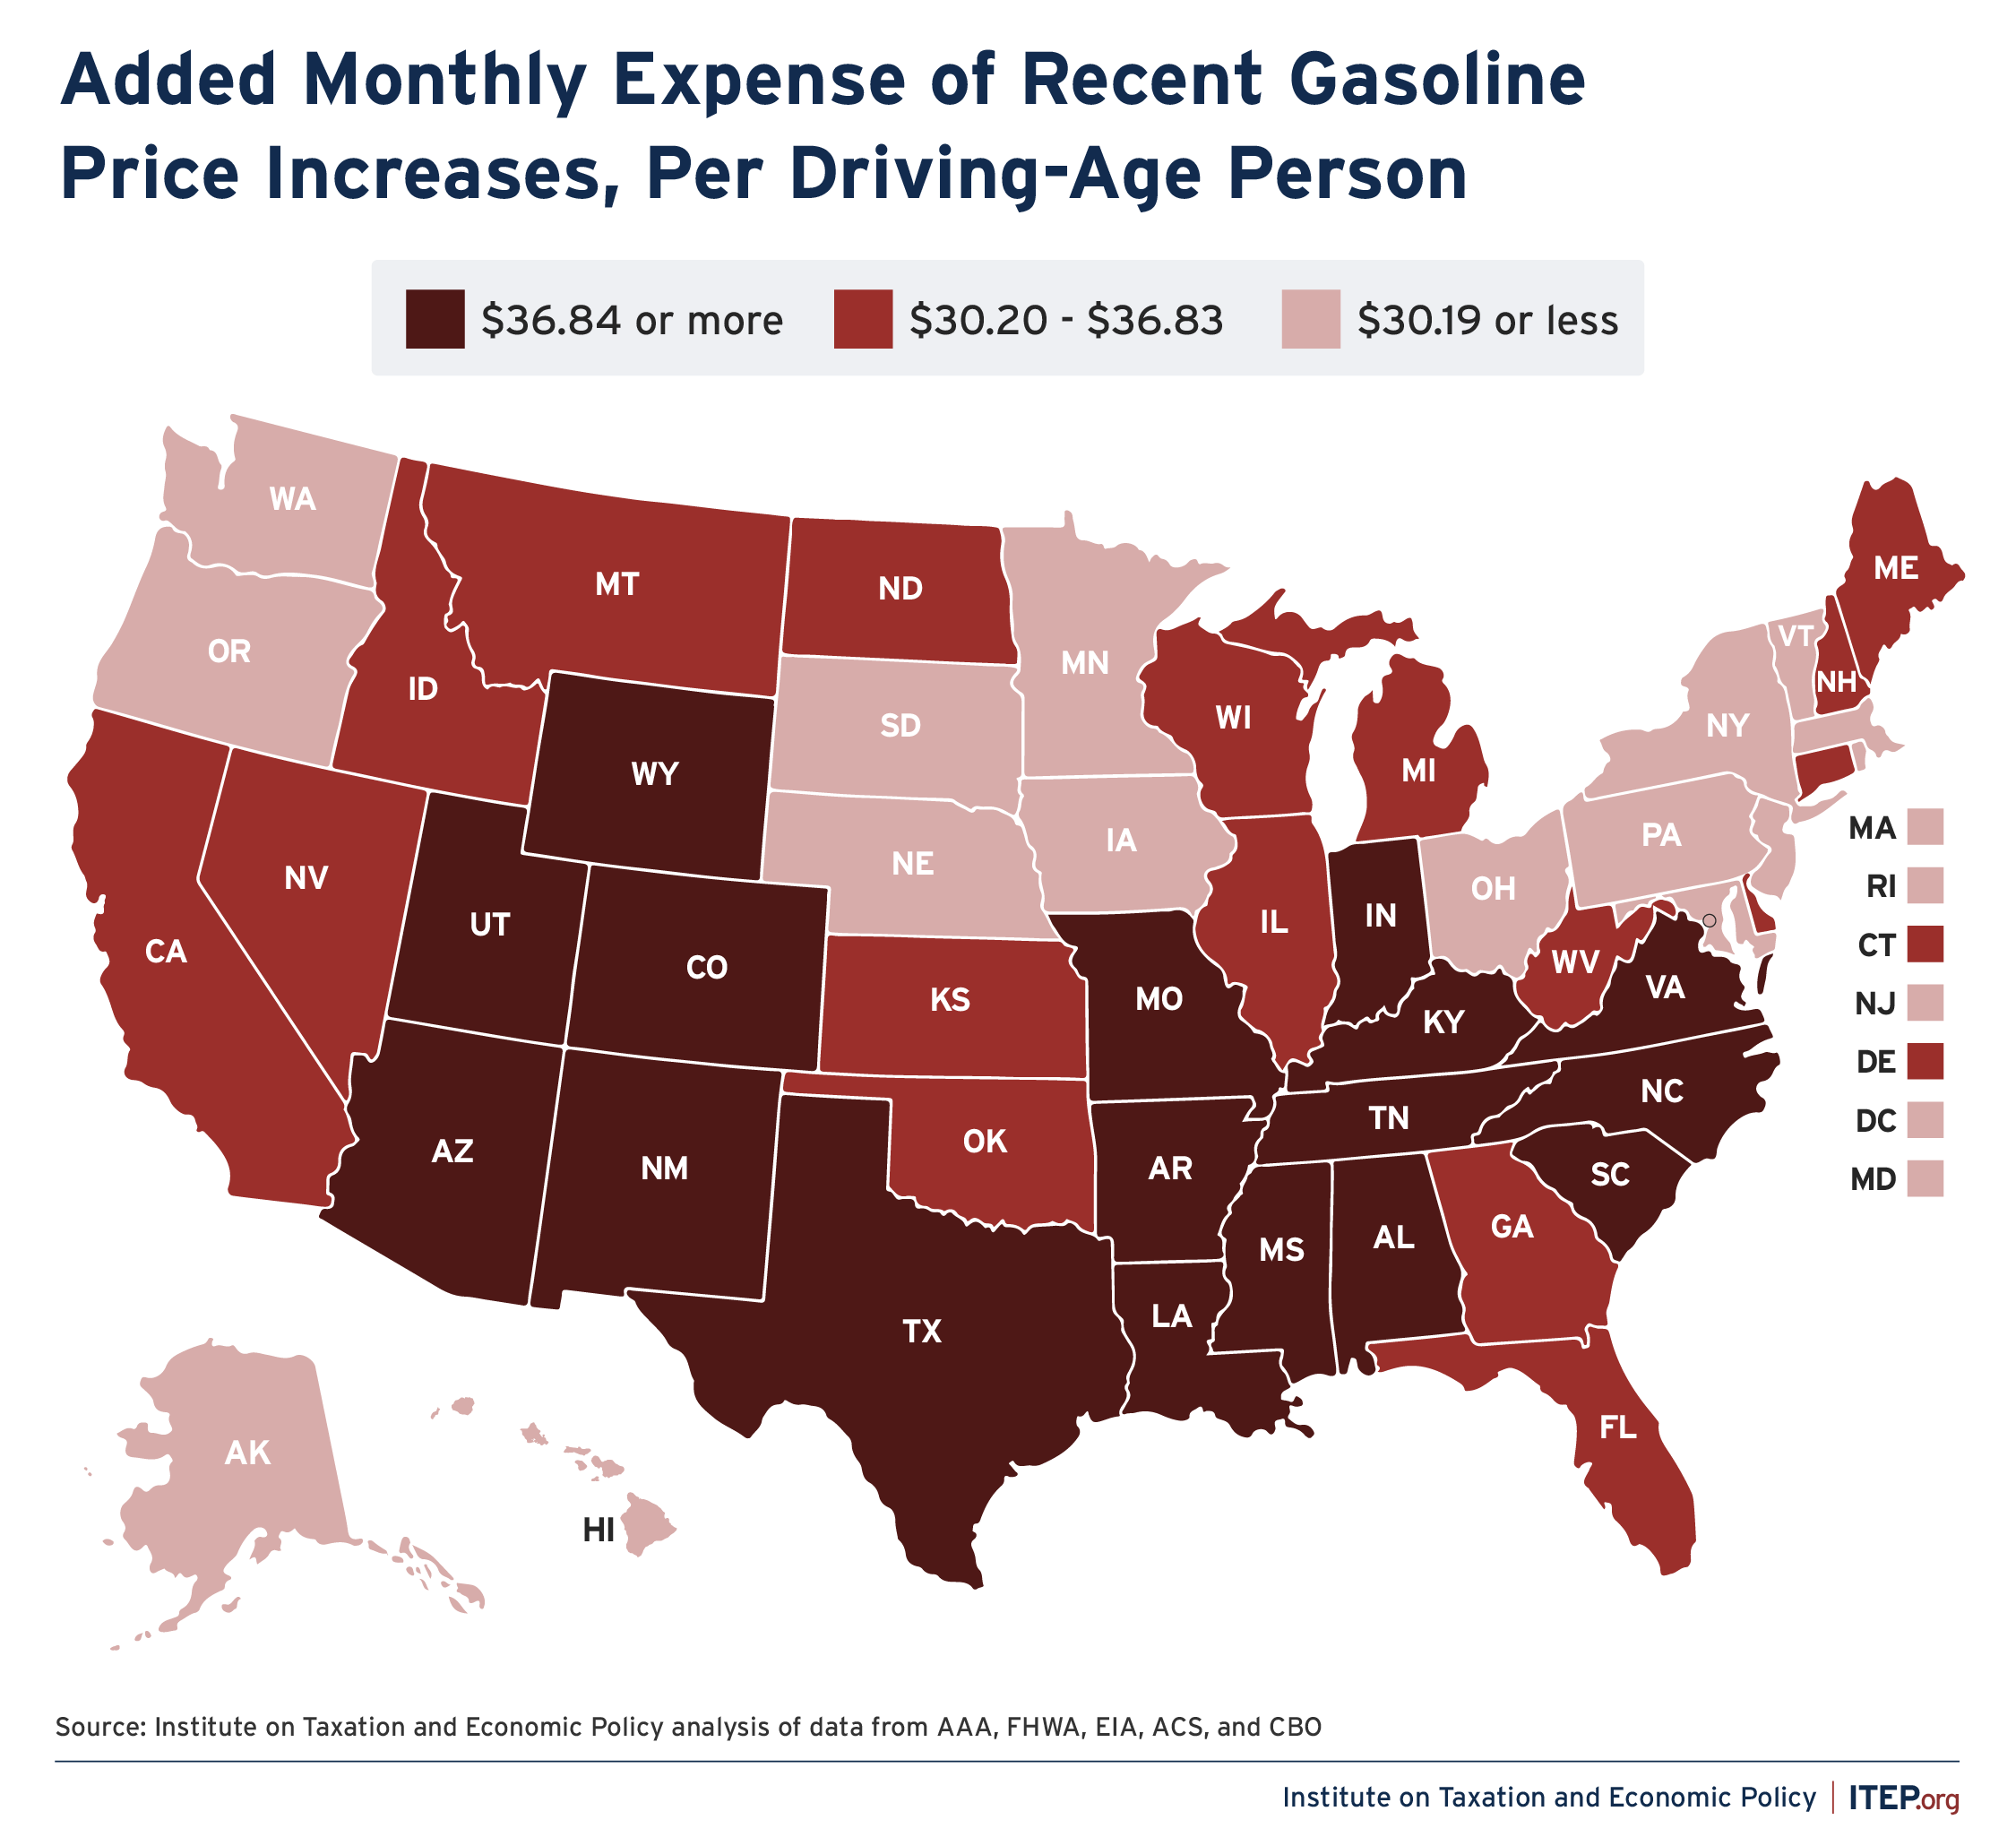
If current price increases are sustained, we find that the additional monthly expense is highest in Alabama ($52 per driving-age person), Mississippi ($51), Wyoming ($49), Kentucky ($47), and New Mexico ($44).
Across the country, the average impact is $34 per driving-age person. If these price increases persist, the average additional cost to households across the nation will be several hundred dollars per year.
Gas Tax Holidays
The federal government and every state levy fuel taxes on gasoline, diesel, and other fuels that help pay for the cost of building and maintaining the nation’s transportation infrastructure. Gas taxes in the U.S. are relatively low by international standards. The federal tax and many state gas taxes are levied as a fixed number of cents per gallon and their real (inflation-adjusted) value has eroded over time.
Gas taxes are not paid directly by drivers but are instead collected at the wholesale level. Typically, the cost of these taxes is passed along to retailers and then, finally, to consumers in the form of higher gas prices.
Some lawmakers are, understandably, looking for ways to lessen the financial strain on drivers by suspending federal or state gas taxes. While this could benefit drivers in theory, the reality is that gas prices do not fully adjust to temporary decreases in the gas tax rate, especially when oil supply is constrained, as it clearly is now. There is strong evidence that much of the tax savings resulting from previous gas tax holidays was captured by various actors within the oil industry rather than passed along to final consumers.
Because of this, one notable effect of gas tax holidays is to redirect dollars that should have been used to fund infrastructure projects, which benefit drivers, into the pockets of wealthy business owners in the oil and motor fuel industries.
Figure 4 presents our revenue and distributional analyses of proposed gas tax holidays at the federal level and in Connecticut, as well as an analysis of an enacted gas tax holiday in Georgia. The results show the impact over a 1-month period, though the duration of these holidays would likely vary. The Georgia holiday, for instance, is scheduled to last for 60 days.
While Georgia and Connecticut’s holidays would apply to both gasoline and diesel, the most prominent proposal for a federal holiday would only apply to gasoline. The calculations underlying Figure 4 reflect this difference.
Figure 4
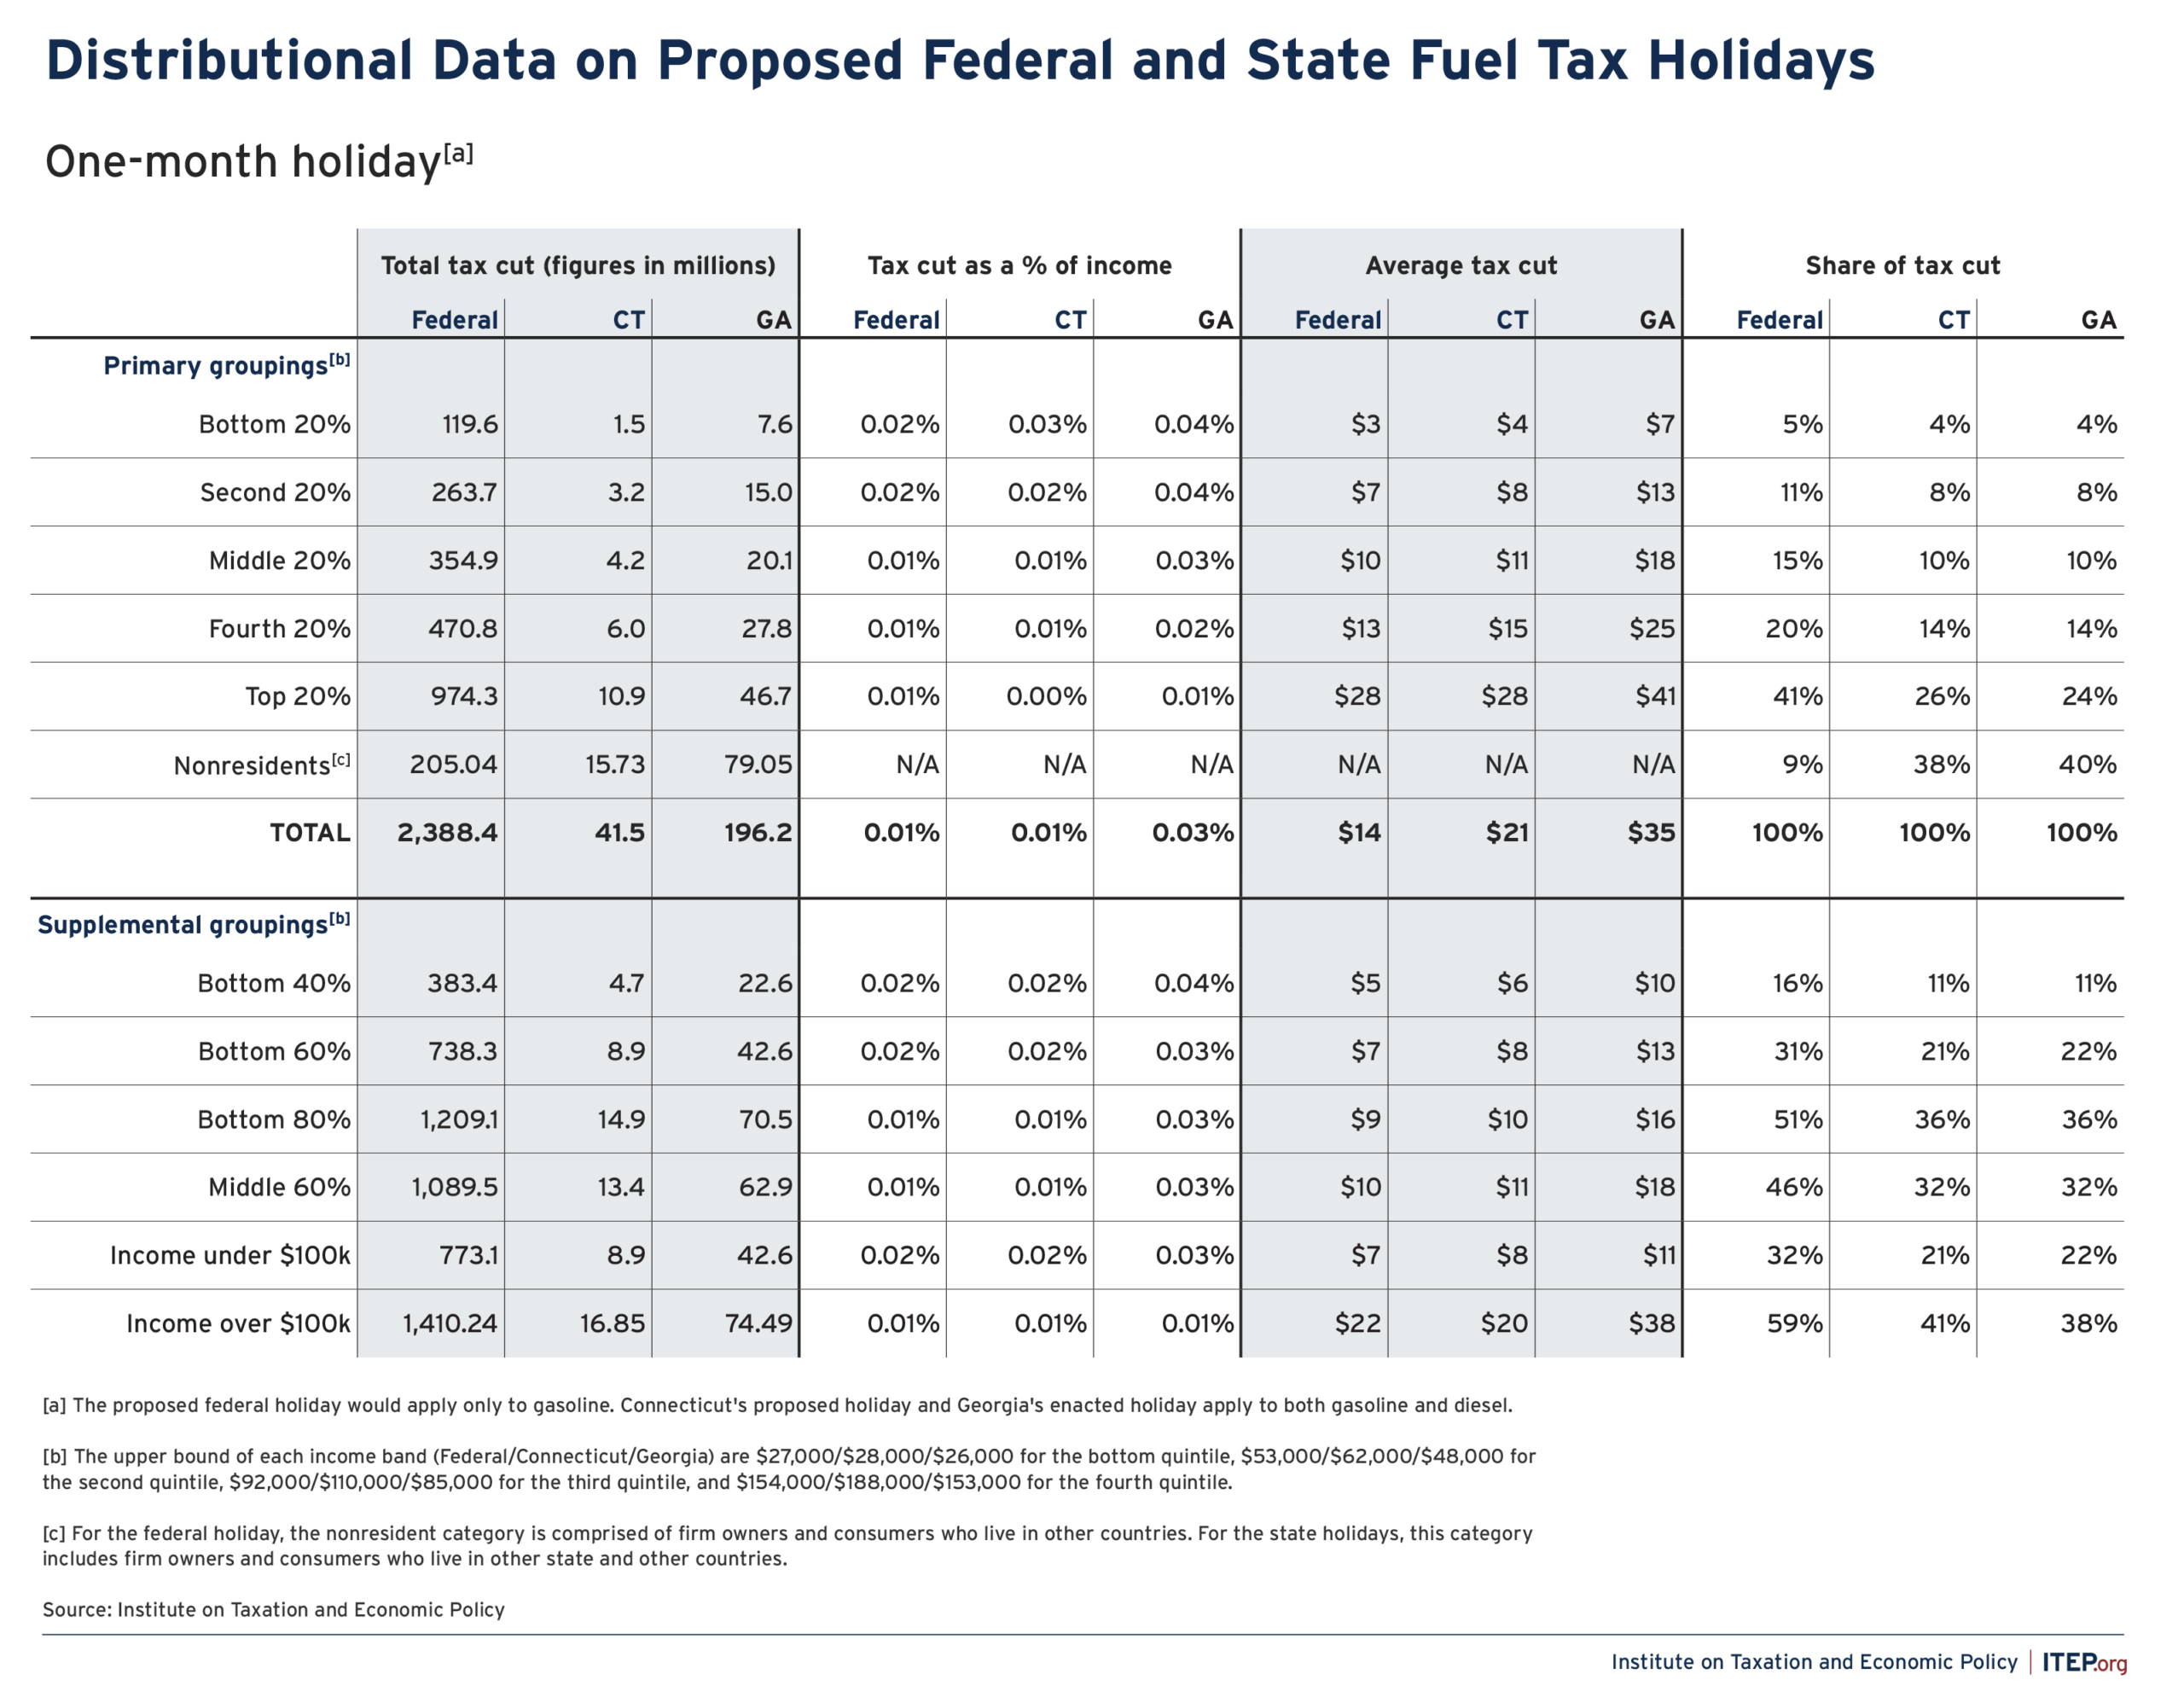
We estimate that a federal gas tax holiday would reduce federal revenues by $2.4 billion per month while a Connecticut holiday would cost $41 million and the Georgia holiday will cost $196 million. Our analysis indicates a total revenue loss associated with the Georgia holiday of $399 million over 60 days—an amount in line with official estimates.
Only a small portion of these holidays would flow to working-class families. We find that the bottom 40 percent of earners would receive just 16 percent of the tax cuts under a federal holiday, 11 percent of the tax cuts under a Georgia holiday, and 11 percent of the tax cuts under a Connecticut holiday. The average tax cut for this group would be between $5 and $10 per month under all three holidays.
The results are hardly more encouraging when looking at a broader swath of families throughout the bottom 60 percent of the income scale. This group would receive just 31 percent of the tax cut federally, 21 percent in Georgia, or 22 percent in Connecticut. Average tax cuts for this group would total $7 federally, $8 in Connecticut, and $13 in Georgia.
In total, just 32 percent of a federal gas tax holiday would flow to American families earning less than $100,000 per year, despite these families comprising more than 60 percent of the U.S. population. The comparable figures in Georgia and Connecticut are 21 and 22 percent, respectively.
Gas tax holidays are poorly targeted ways of reaching working class and middle-class drivers for a few reasons.
First, a significant share of the tax savings is captured by the oil industry and motor fuel dealers as higher profit, benefiting the owners of those companies who tend to be wealthier than average.
Second, much of the tax savings flow to businesses that use motor fuel to ship their products or provide services, and some of a temporary tax cut will be captured by those businesses’ owners rather than passed along to their customers.
Third, in the case of state gas taxes, a significant share of the holiday leaks outside of the state’s borders both when travelers purchase gasoline and when nonresident shareholders and customers benefit from the portion of the tax cut benefiting the oil industry and other businesses.
As seen in Figure 4, a significant share (38 to 40 percent) of the tax cuts generated by a state gas tax holiday will flow to nonresidents through these various channels.
Conclusion
Gas prices have increased dramatically in recent weeks, and the effects of those increases are being felt most acutely in the South where people rely more on gasoline for their day-to-day transportation needs. While a gas tax holiday has surface appeal as a means of blunting these price increases, the reality is that a sizeable share of this tax cut would be captured by the oil industry as even higher profits. Ultimately, gas tax holidays are not particularly well-targeted to those drivers least able to afford the higher price of gas. Rather than searching in vain for a quick fix to the affordability challenge created by higher gas prices, state lawmakers would be wise to use this moment to start a conversation around whether public investments in electric vehicle infrastructure, public transit, and other initiatives could make their residents less reliant on gasoline and less vulnerable to the financial hardship created by future gas price spikes.
Methodology for Measuring Gas Price Increase by State
Our approach to measuring the impact of gasoline price increases begins with AAA’s data on the average price of regular gasoline, by state, as of the morning of March 23, and compares it to AAA’s reported average price from one month prior. Every state has seen a significant increase in the average price of gas over this period, ranging from a low of 75 cents per gallon in Minnesota to a high of $1.31 per gallon in Arizona.
We then turn to the Federal Highway Administration (FHWA)’s state level data on the amount of gasoline used annually, on-road, by private and commercial drivers in 2024, which we convert into a monthly figure. Our analysis of fuel price increases focuses on the direct impact of higher gasoline prices on individual drivers, and thus we remove 10 percent of these gallons from our calculations to reflect the share made for commercial purposes, based on our analysis of data from the Energy Information Administration (EIA) and industry experts.
Our approach understates the true impact of higher fuel prices on the average person because we do not consider the direct impact of higher diesel prices on individual drivers who own diesel-powered vehicles, and because we do not include the indirect impact that higher gasoline and diesel prices paid by businesses and governments have on American consumers, business owners, and taxpayers.
Next, we divide each state’s private-use portion of monthly, on-road gasoline use by the number of state residents aged 16 or older, as reported in the U.S. Census Bureau’s American Community Survey (ACS), to derive the average number of gallons purchased per driving-age individual in 2024. We then update this figure to 2026 levels based on the EIA’s forecast of growth in the fuel-efficiency of the nation’s light-duty vehicle stock between 2024 and 2026, which we expect will slightly reduce the number of gallons purchased, per person, in 2026 relative to 2024.
It is then necessary to derive 2026-level estimates of the driving-age population in each state, which we do by applying aging factors to the 2024 ACS data constructed based on estimated and forecasted population data from the U.S. Census Bureau and the Congressional Budget Office.
Multiplying our 2026-level estimates of the number of gallons purchased per driving-age person by our estimate of the 2026-level driving-age population produces an estimate of total private-use gasoline gallons consumed in each state. And finally, multiplying this 2026 gallonage count by the average increase in the price of gasoline yields the total additional cost confronting American drivers, as reported in Figures 1 and 3.
To translate these figures into average impacts per driving-age person, we simply divide by our estimate of the 2026 driving-age population in each state.
Methodology for Distributional Analysis of Fuel Tax Holidays
Our analysis of federal and state fuel tax holidays begins from the FHWA’s data on the net volumes of gasoline and special fuel taxed by state. We age these amounts to the present using the EIA’s forecast of transportation-related fuel consumption, by region and fuel type. Multiplying these gallonage counts by the applicable tax rates for each fuel type yields an estimate of how federal and state fuel tax revenues are divided between gasoline and special fuels.
We then apply that split to the official fuel tax revenue estimates for 2026 reported by the Congressional Budget Office, the Connecticut Office of Policy and Management and the Office of Fiscal Analysis, and the Georgia Governor’s Office of Planning and Budget to arrive at annual estimates of fuel tax revenues by fuel type. We then convert these into single month revenue estimates using FHWA historical data on the share of annual fuel transactions, by volume, that take place in the month of April.
The next stage of the work involves distributing these revenue amounts across various market participants, with the aim of eventually arriving at estimates of final incidence for the fuel tax holiday. In line with the experience of past holidays, we assign 30 percent of the total revenue lost to the holiday to the fuel industry rather than to fuel consumers. This approach may understate the share retained by the industry in this current, supply-constrained environment. We distribute this 30 percent share according to capital income as estimated in the ITEP Microsimulation Tax Model.
The other 70 percent is then distributed to individual and business purchasers of fuel using the consumption tax module of the ITEP Model, which is described in the methodology section of our Who Pays? report. We use the ITEP Model to estimate the shares of on-road gasoline and diesel fuel purchased by state residents, visitors to the state, and businesses.
One modification we make to our traditional approach to modeling motor fuel taxes is to assign a larger than usual share (one half) of the portion of the fuel tax holiday flowing to business purchasers to those firms’ owners rather than their consumers. In general, the short-run incidence of taxes is more likely to remain with the payor of that tax, as opposed to being shifted to some other actor, as it takes time for firms to adjust their prices and other activities in the wake of a tax change.
One notable finding of our analysis is that a significant share of a state fuel tax holiday will flow to nonresidents. This is partly a reflection of the fact that a significant share of state motor fuel taxes, in general, is paid by people other than residents of the state in question. Minnesota’s Department of Revenue, for instance, has concluded that 27 percent of the state’s motor fuel tax is paid by nonresidents. Our estimates of the nonresident share for a temporary gas tax holiday in Connecticut (38 percent) and Georgia (40 percent) are somewhat higher than the Minnesota estimate primarily because temporary changes in fuel tax rates are not fully passed through to fuel purchasers and are instead retained by industry participants whose owners are geographically dispersed.