Below is written testimony delivered by ITEP Local Policy Director Kamolika Das before the Pennsylvania House Finance Subcommittee on Tax Modernization & Reform on March 1, 2024.
Good afternoon and thank you for this opportunity to testify. My name is Kamolika Das, I live in South Philly, and I’m the Local Tax Policy Director at the Institute on Taxation and Economic Policy or ITEP. ITEP is a non-profit, non-partisan tax policy organization. ITEP recently updated our flagship report, Who Pays?, which analyzes the distribution of state and local taxes across the income scale in all 50 states and D.C. This is the 7th edition of the study and the most thorough version yet. It covers 99.7% of all state and local taxes, including the most minute taxes like Pennsylvania’s fireworks tax and dry-cleaning tax.
Our research finds that across the US, low- and middle-income families pay higher tax rates than the wealthy on state and local taxes. Nationwide households making under $24,000 a year pay 11 percent of their income on state and local taxes while the top 1%, households making over $730,000 a year, pay 7 percent.
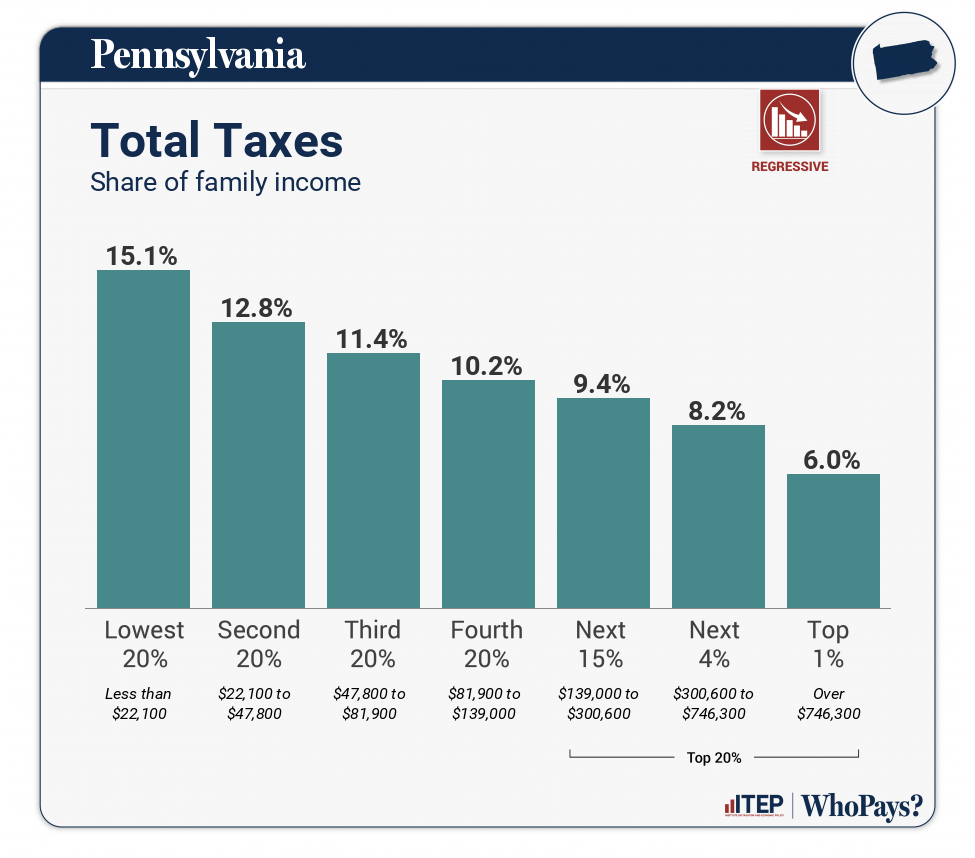
Definitions of what constitutes tax equity or tax justice differ. Some people argue for flat taxes, where everyone pays the same portion of their income on taxes. Of course, this leaves lower-income people with far less income after paying for basic necessities. Others believe the rich should pay more because they have a higher ability to pay and because they owe some of their good fortune to the public services and social stability that government provides. Regardless of your definition, most tax systems, including Pennsylvania’s, are not fair or equitable. In fact, Pennsylvania’s regressivity far exceeds that of the national average. In Pennsylvania, the lowest 20 percent of earners pay an effective tax rate 2.5x higher as a share of income than the top 1 percent. So Pennsylvania ranks the 4th most regressive tax system in the nation according to ITEP’’s Tax Inequality Index.
A common thread that we’ve identified in regressive tax systems is that state and local governments are heavily reliant upon regressive taxes on what people buy, or on their homes that they own or rent. Sales taxes inevitably require a larger share of income from low- and middle-income families than from wealthier families because sales taxes are levied at a flat rate and spending as a share of income falls as income rises. Since high earners can save a much larger share of their incomes than middle-income families—and since the poor can rarely save at all—the tax is inherently regressive. Same with housing since home values as a share of income tend to decline at higher incomes.
Often, when people think about state and local taxes, they solely focus on income taxes, but income taxes do not exist in isolation. This leads to the deep misconception that flat income taxes result in an overall flat tax structure. But in reality, given the fact that sales taxes and property taxes are both regressive, states need offsetting structures like graduated income tax rates to create an overall flat structure and satisfy the minimum standard of tax fairness.
Many states that are commonly perceived as “low tax” are often high tax for low-income families. ITEP analyzed flat tax states and graduated income tax states empirically and on average, low- and middle-income households pay lower rates in graduated income tax states. This is commonsense since flat tax states are not raising as much from the wealthy so they have to rely more heavily on everyone else. For example, households making $30,000 to $80,000 actually pay higher effective tax rates on all state and local taxes in Pennsylvania than they do in New Jersey.
Pennsylvania’s regressive taxes also makes it more difficult to invest in shared priorities like addressing the state’s inexcusable education opportunity gaps. Progressive taxation is positively correlated with higher overall tax revenue levels relative to the size of each state’s economy; taxing high-income families at lower rates will inevitably constrain revenue collections. While Pennsylvania’s wealthiest residents grew their collective wealth during the pandemic, the percent of families who are unable to afford the basics of housing, childcare, food, transportation, health care, and technology grew by 2 percentage points.
Tax policy is one tool to help reduce this inequality. If you look at the jurisdictions with the least regressive state and local tax systems (DC, Minnesota, Vermont, New York, New Jersey, Maine, and California) there are several common factors: graduated marginal income tax rates; targeted, refundable low-income credits; broad-based income taxes with limits on tax preferences for upper-income taxpayers; a higher reliance on taxes that take ability to pay into account; and a lower reliance on taxes on consumption.
Several states have made strides in lessening tax regressivity in the past few years.
New Mexico advanced 18 spots in our latest edition of Who Pays? by enacting a new state Child Tax Credit, a larger Earned Income Tax Credit for low-wage workers, a cut to the Gross Receipts Tax rate charged on the things New Mexicans buy every day, and a higher top income tax rate on the state’s wealthiest families. Washington state is no longer the single most regressive tax jurisdiction due to their recent enactment of a new tax on capital gains and the creation of a tax credit, similar to an EITC, for low- and moderate-income families. And Massachusetts voters dismantled their flat tax in November 2022 by adopting a constitutional amendment to impose a surtax on millionaires.
These decisions also have dramatic impacts on education funding. Massachusetts’ Fair Share Amendment is expected to raise more than $2 billion in revenue each year for public education and transportation infrastructure. This benefits the public, of course, but this is also a pro-business move since inadequate education and infrastructure revenues hurt economic growth. And just as a reminder, Pennsylvania policymakers in 2022 chose to cut the corporate income tax rate in half over eight years, with the cut not taking full effect until 2031. As a result, the cost will balloon from $127 million in 2023 to nearly $1.5 billion in 2031.
I realize that flat rate tax structures are enshrined in the state constitutions of Pennsylvania, Colorado, Illinois, and Michigan, therefore limiting the shovel-ready policy options available to this set of states. However, even within those limitations, lawmakers can take immediate steps to reduce the regressivity of Pennsylvania’s state and local tax system. Thank you and I’m happy to answer any questions.