
Recent Work
2146 items

Key Findings For families of modest means, California is not a high-tax state. California taxes are close to the national average for families in the bottom 80 percent of the income scale. For the bottom 40 percent of families, California taxes are lower than states like Florida and Texas. The highest earners usually pay higher […]
Fairness Matters: A Chart Book on Who Pays State and Local Taxes
April 11, 2024 • By ITEP Staff
State and local tax codes can do a lot to reduce inequality. But they add to the nation’s growing income inequality problem when they capture a greater share of income from low- or moderate-income taxpayers. These regressive tax codes also result in higher tax rates on communities of color, further worsening racial income and wealth divides.
These Three Local EITCs Are Boosting Family Incomes at Tax Time
April 10, 2024 • By Andrew Boardman
This tax season more than 800,000 households in New York City, Maryland's Montgomery County, and San Francisco are set to receive a boost through local refundable EITCs. These credits put dollars directly into the pockets of low-income households, equipping families with resources to better make ends meet and invest in their futures. In turn, they can help build stronger, fairer, and more resilient communities.
America's tax system is just barely progressive, and not nearly as progressive as many suggest or as progressive as it could be. There is plenty of room for lawmakers to improve the progressivity of the tax code to combat economic, wealth, and racial inequality.
State Rundown 4/3: Some States Buck the Trend on Foolish Tax Policy
April 3, 2024 • By ITEP Staff
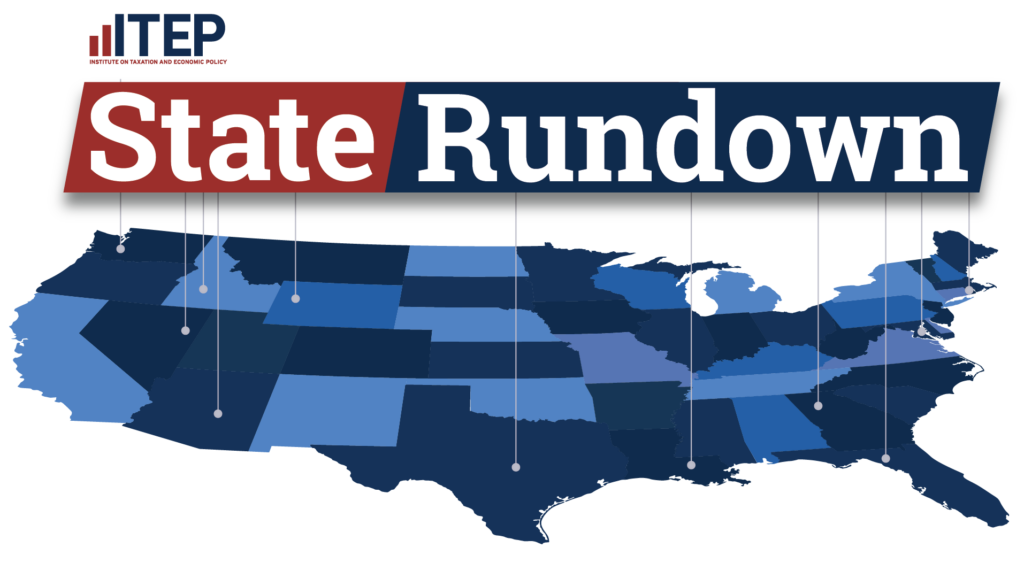
This week tax cuts were debated across the upper Midwest...
Five Things to Know About Tax Foundation’s Critique of Maryland’s Worldwide Combined Reporting Proposal
April 1, 2024 • By Carl Davis, Matthew Gardner
Maryland lawmakers are considering enacting worldwide combined reporting (WWCR), also known as complete reporting. This policy offers a more accurate, and less gameable, way to calculate the amount of profit subject to state corporate tax. Enacting WWCR in Maryland would represent a huge step toward eliminating state corporate tax avoidance as it neutralizes a wide […]
Biden Is Right: Corporate Tax Avoidance Has Big Problems That We Can Fix
April 1, 2024 • By Jon Whiten

Sensible reforms to the corporate tax system can help both crack down on corporate tax avoidance and ensure companies that are flourishing are paying their share for the public infrastructure that forms the building blocks of their success.
State Rundown 3/28: Tax Cut Madness, But Our Brackets Bet on Tax Fairness
March 28, 2024 • By ITEP Staff

While madness is typically reserved for basketball in March, several high-profile, regressive tax cuts are making their way through state legislatures this week...
Congress Should Enhance – Not Diminish – IRS Capability this Tax Season
March 28, 2024 • By Joe Hughes
While funding cuts to the IRS may have been necessary as a political matter to avoid harmful agency shutdowns, they are severely misguided as a policy matter. By all serious accounts, cuts to IRS funding increase the deficit due to uncollected taxes – mostly from big businesses and the very wealthy.

Every child deserves the opportunity to succeed in society – and tax policy has a huge role to play in making that happen. Better tax policy can help prepare our young children with skills to become successful and thriving adults.
The Estate Tax Should Help to Level the Playing Field. Instead it’s Letting the Rich Get Richer.
March 26, 2024 • By Amy Hanauer

The federal estate tax should ensure that family dynasties who’ve amassed enormous fortunes pay their fair share in taxes. But because policymakers have repeatedly doubled and tripled the immense sums that can be passed on before the tax kicks in, the estate tax today affects almost no one.

Over the past week Utah continued its slow march toward a more inequitable tax code...
These forward-thinking states are demonstrating the wide variety of options for policymakers who want to raise more from the wealthiest people, rein in corporate tax avoidance, create fair tax codes and build strong communities.

Governors and legislative leaders in a dozen states have made calls to fully eliminate their taxes on personal or corporate income, after many states already deeply slashed them over the past few years. The public deserves to know the true impact of these plans, which would inevitably result in an outsized windfall to states’ richest taxpayers, more power in the hands of wealthy households and corporations, extreme cuts to basic public services, and more deeply inequitable state tax codes.

Many state legislative sessions are in the final stretch...
