This report was updated in April 2018
Read as PDF (Includes Appendices of State-by-State Data)
View updated data as of December 2017
Introduction
The Trump administration’s immigration policies have broken apart families and removed established members of communities. The administration’s disregard for the contributions of immigrants, regardless of their legal status, is of real concern for young immigrants whose parents brought them to the United States as children. Many of those young immigrants qualify for deferred deportation action and legal work authorization under Deferred Action for Childhood Arrivals (DACA), a 2012 executive order under President Barack Obama.
While it remains unclear what actions, if any, President Trump will take to amend DACA, the policy guidance the president has given to federal agencies has resulted in detentions and deportations of individuals reportedly eligible for deferred action. The ambiguity of the Trump Administration’s statements and actions relating to the DACA program makes it essential that clear and accurate data about the DACA population is available.
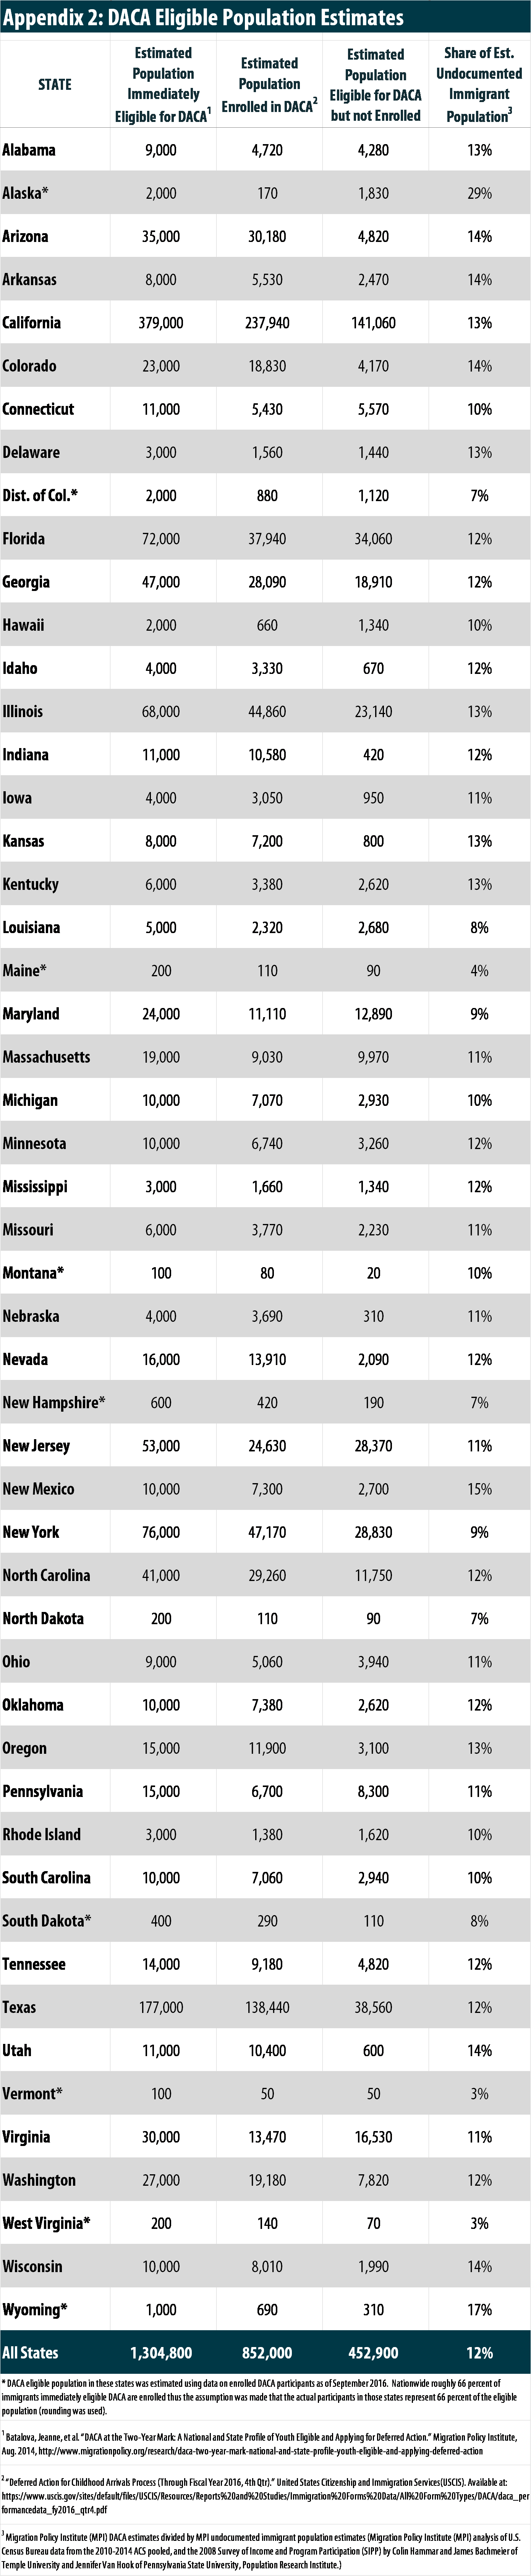
More than 1.3 million out of the 11 million undocumented immigrants living in the United States are eligible for DACA. As of September 2016, more than 852,000 individuals were enrolled in the program.[i] DACA offers eligible teenagers and young adults who were brought to the United States as children outside of their control temporary deferral from deportation and legal work authorization.[ii]
DACA enrollment has helped young immigrants become more engaged in their communities. A national survey of DACA enrollees in 2016 found that more than 40 percent of respondents secured their first job after enrollment in DACA, and more than 60 percent landed a job with better pay. DACA enrollment also allowed 60 percent of respondents to pursue educational opportunities that were previously unavailable to them. The young immigrants enrolled in DACA work in diverse industries, including educational and health services, wholesale and retail trade, and professional and business services.
The 1.3 million young immigrants eligible for deferred action contribute tax dollars to communities that help pay for schools, public infrastructure, and other services. Their contributions could be increased by taking steps to ensure that all individuals eligible for deferred action are enrolled, or even by offering a path to citizenship. Conversely, stripping their temporary lawful status or deporting them would decrease their tax contributions and deprive our country of a dedicated and diverse generation.
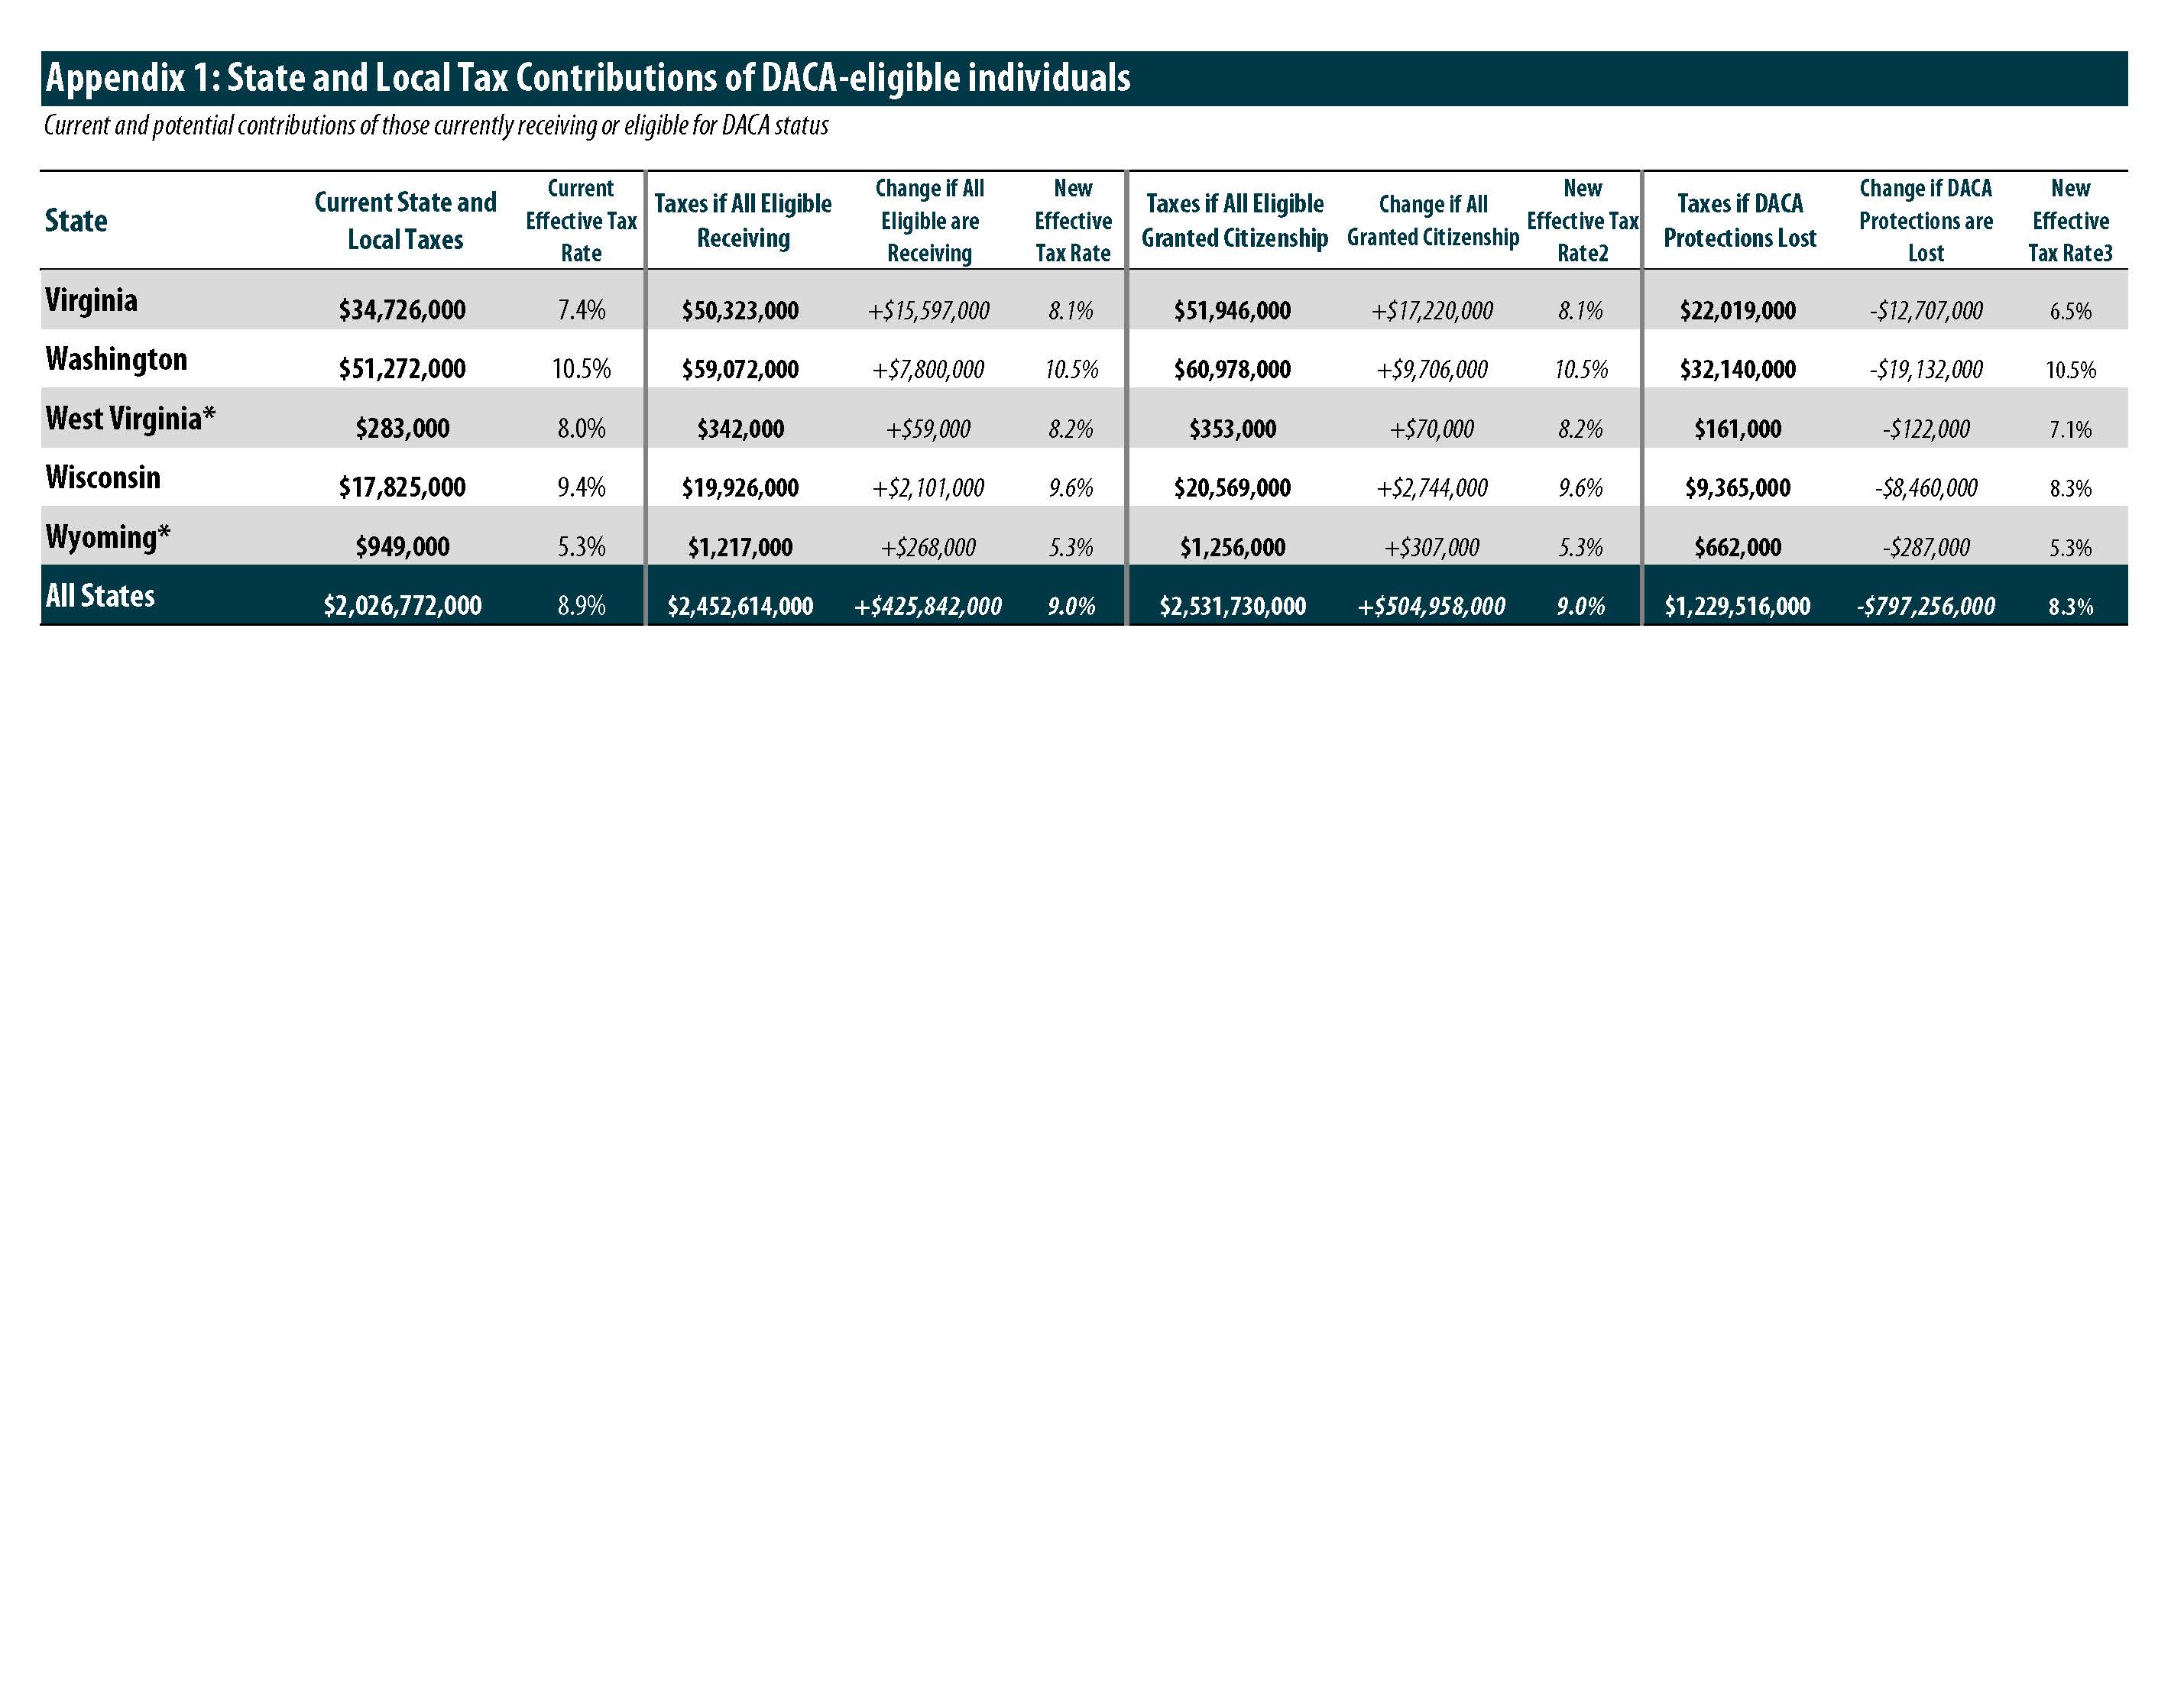
An ITEP report from March 2017 found the 11 million undocumented immigrants living and working in the United States contribute more than $11.74 billion in state and local taxes.[iii] This report specifically examines the state and local tax contributions of undocumented immigrants who are currently enrolled or immediately eligible for DACA and the fiscal implications of various policy changes. The report includes information on the national impact (Table 1) and provides a state-by-state breakdown (Appendix 1).
Key Findings
- The 1.3 million young undocumented immigrants enrolled or immediately eligible for DACA contribute an estimated $2 billion a year in state and local taxes.[iv] This includes personal income, property, and sales and excise taxes.
- DACA-eligible individuals pay on average 8.9 percent of their income in state and local taxes. Their effective tax rate is higher than the average rate paid by the top 1% of taxpayers in state and local taxes of just 5.4 percent and is on par with the average rate paid of 9.4 percent paid by the middle 20 percent of taxpayers.[v]
- Continuing DACA and ensuring all who are eligible for the program are enrolled would increase estimated state and local revenue by $425 million, bringing the total contribution to $2.45 billion, and increasing the effective tax rate for those enrolled to 9 percent.
- Replacing DACA with a path to citizenship could provide nearly $505 million in additional state and local taxes, increasing total contributions to at least $2.53 billion a year.
- Repealing the temporary legal status and work authorizations permitted by DACA would reduce estimated state and local revenues by nearly $800 million, and drop the total contributions to just over $1.2 billion annually.
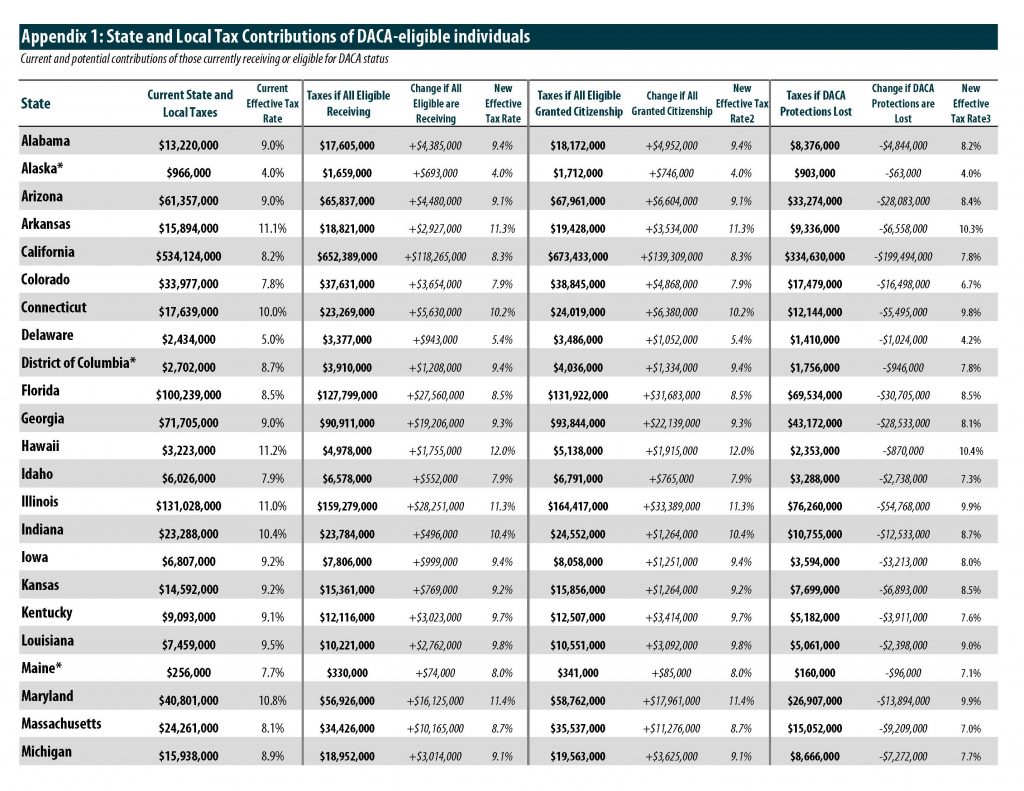
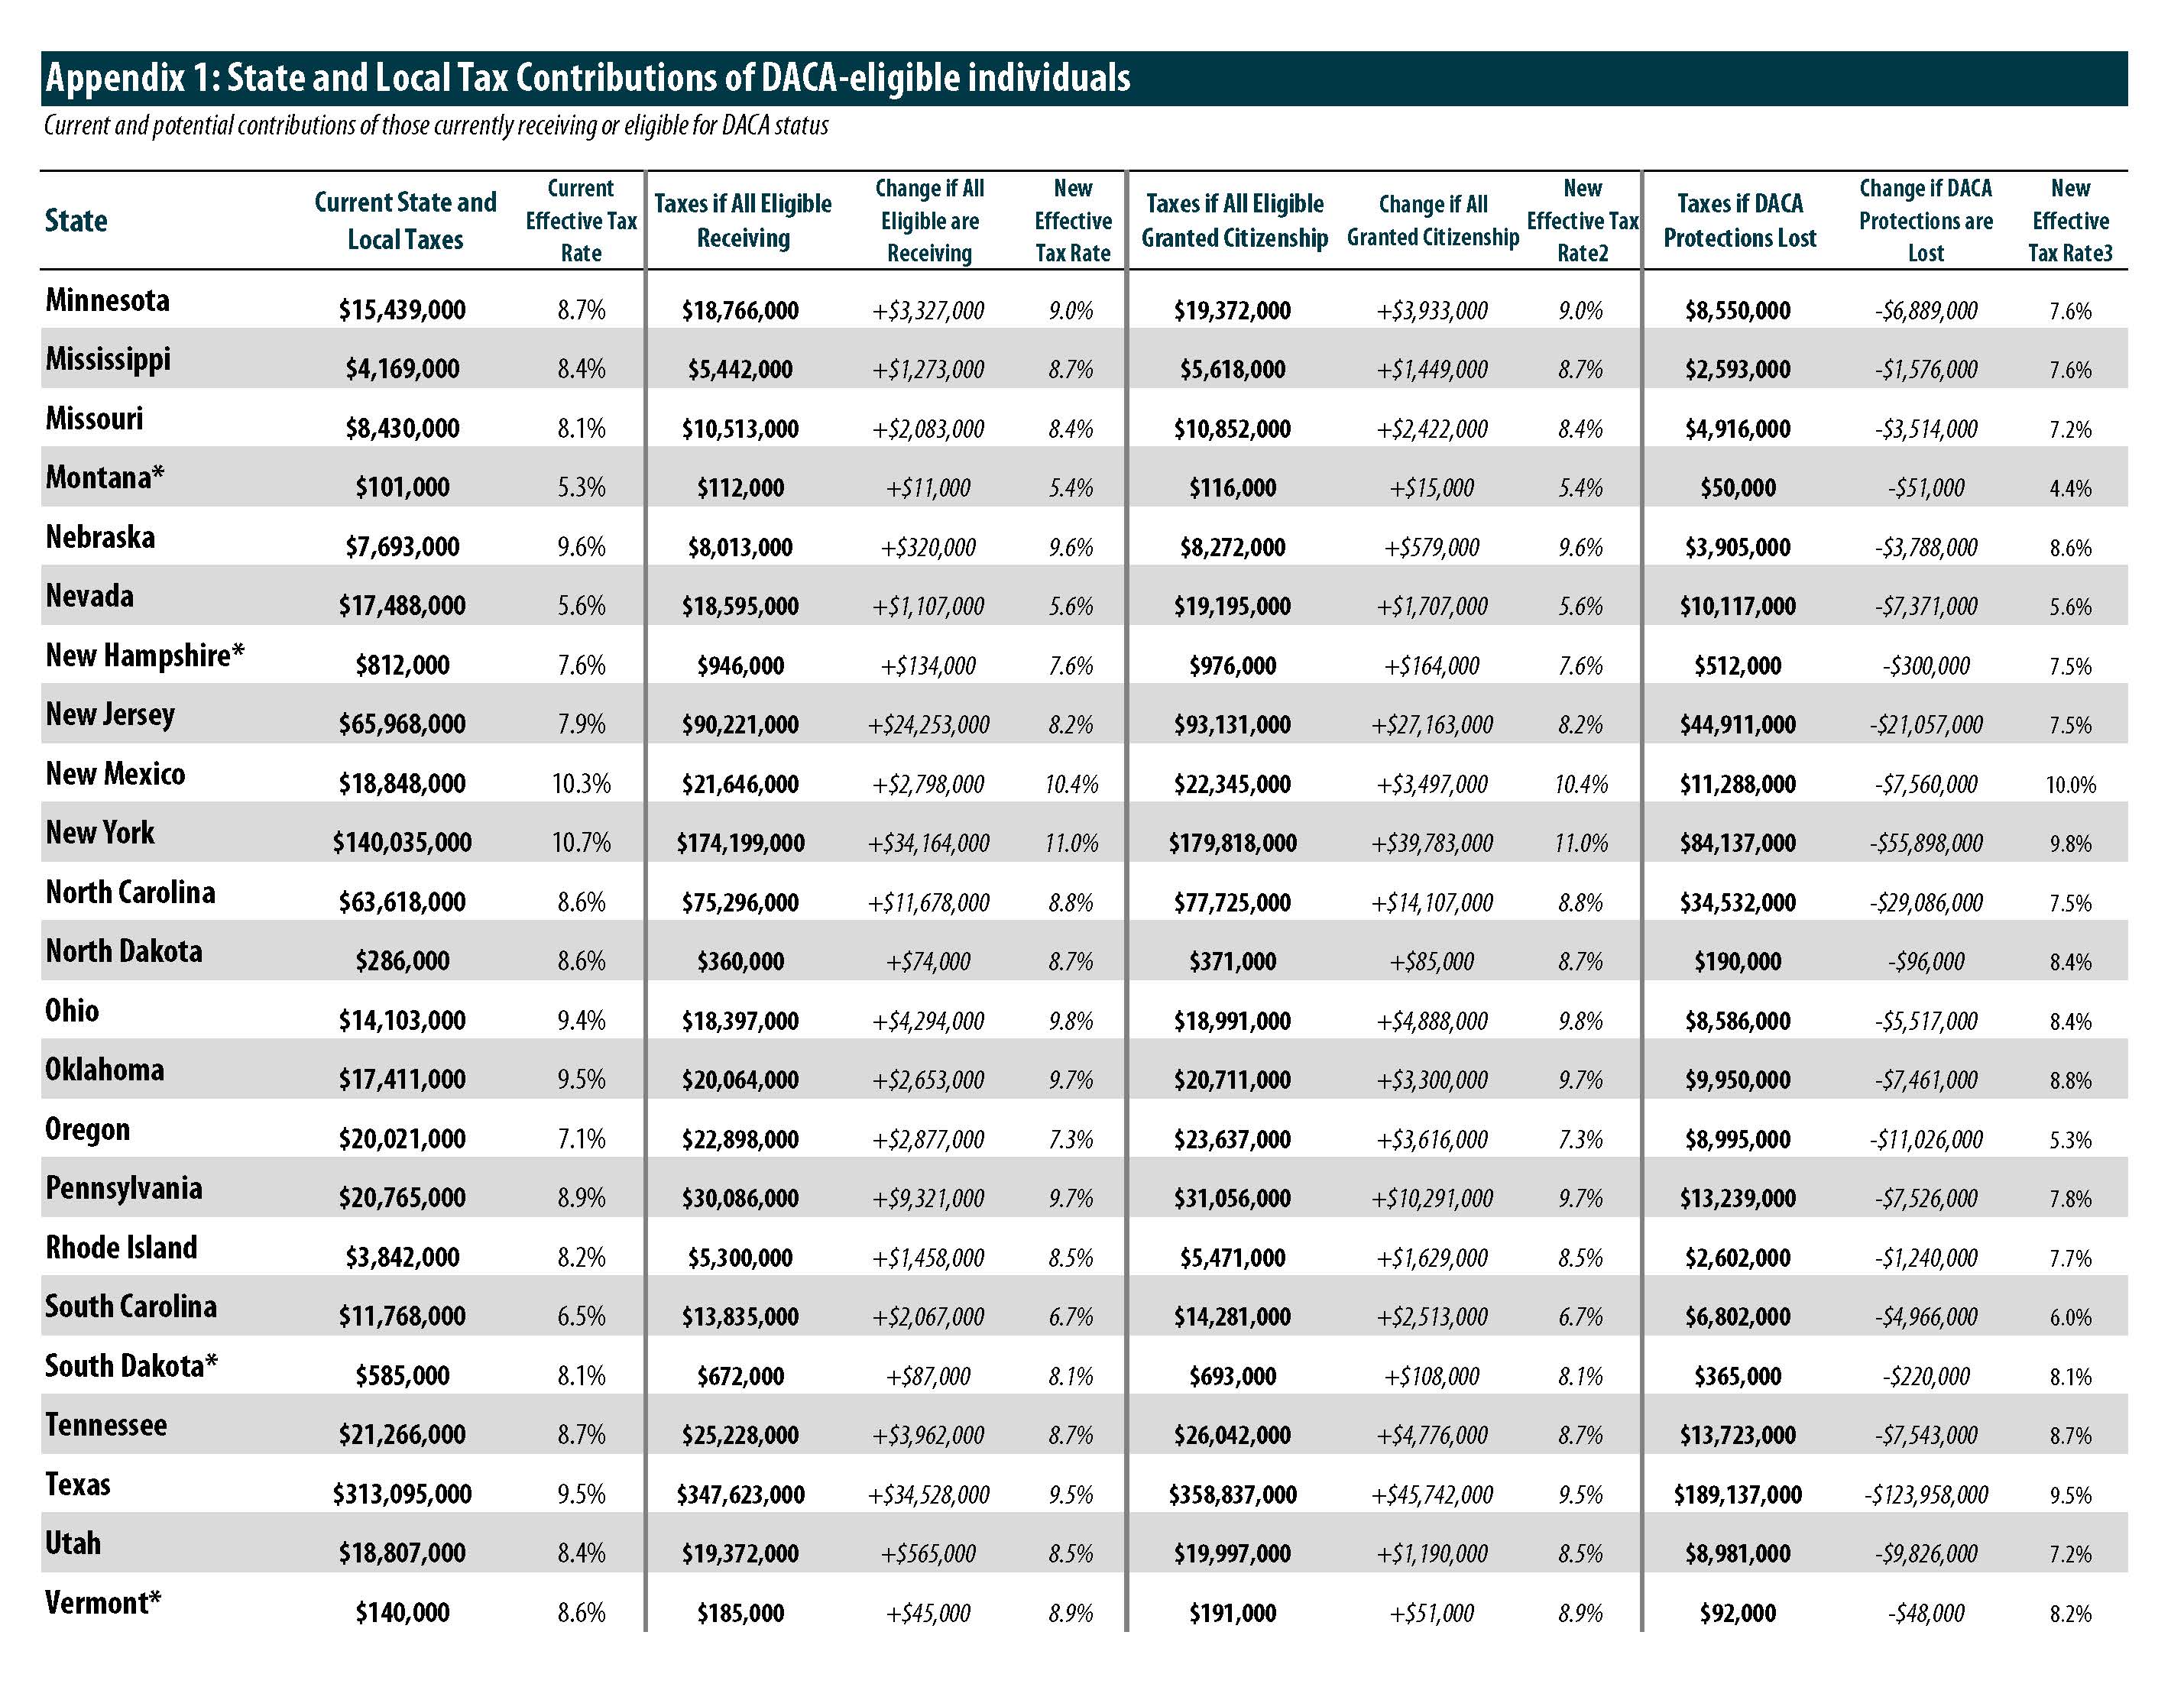
- Every state benefits from the economic contributions of the young immigrants eligible for DACA (see Appendices 1 and 2). For example, the 379,000 young immigrants living in California are contributing more than $534 million to the golden state while the 2,000 immigrants in our nation’s capital contribute $2.7 million to the District. Likewise, every state stands to lose considerable revenue if we do not maintain the protections and opportunities DACA has allowed.
How federal policy changes in the treatment of young immigrants affect state and local revenues
Questions have frequently been raised about the taxes paid by undocumented immigrants. Everyone living and working in the U.S. contributes to state and local taxes, regardless of their immigration status. We all pay sales and excise taxes when we purchase goods and services such as clothing or gasoline. We all pay property taxes either directly for our homes or indirectly as renters.
As ITEP’s March report demonstrated, about half of undocumented immigrants file income tax returns. They do this using Individual Taxpayer Identification Numbers (ITINs) in the absence of having valid Social Security numbers. Because DACA provides young immigrants with work authorization, recipients are subject to the same state and local personal income tax laws as all lawfully present workers. DACA recipients do have (temporary) Social Security numbers.
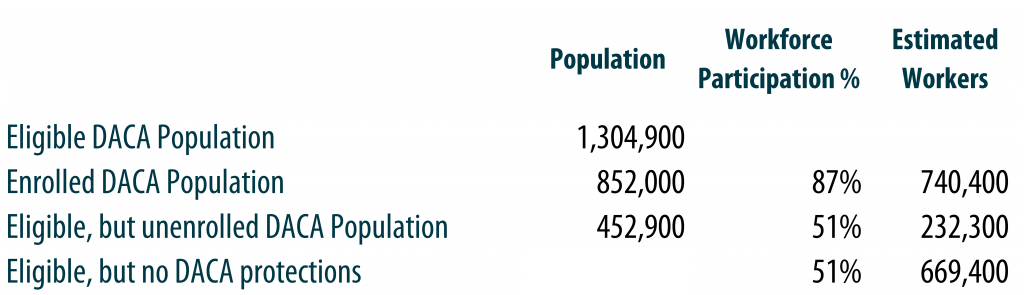
The tax revenues generated by DACA recipients are further boosted by the fact that DACA status boosts employment rates and wages. A national survey of DACA recipients found that employment rates increased by 36 percentage points after enrollment, from 51 percent of respondents employed to 87 percent.[vi] Evidence also shows that relief from deportation and temporary work permits through programs like DACA also boosts undocumented immigrants’ wages by at least 8.5 percent. When given the opportunity to work legally and a reprieve from deportation DACA recipients are able to work more, earn more wages, and are less likely to be victims of wage theft from unscrupulous employers.
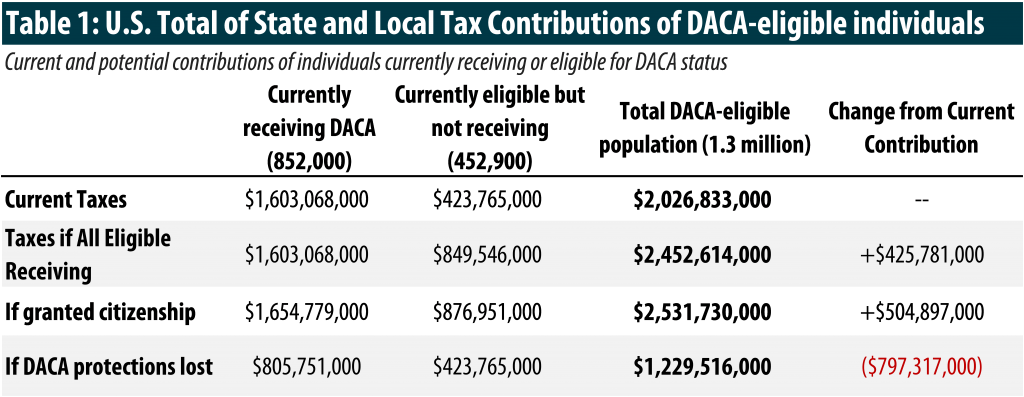
Based on this evidence, we assume that 87 percent of the 852,000 young immigrants currently enrolled in DACA are employed, and that they are earning, on average, 8.5 percent more than the estimated 452,900 young people eligible for but not receiving DACA. The higher earnings, higher employment rate, and higher tax compliance rate of individuals enrolled in DACA leads to their increased tax contributions and higher effective tax rate compared to those eligible for but not receiving DACA. The total contributions of individuals currently receiving or eligible for DACA status is just over $2 billion in state and local taxes annually. If all eligible individuals were enrolled in DACA, those state and local tax contributions would increase by more the $425 million due to higher earnings, higher employment rate, and 100 percent tax compliance for all DACA eligible immigrants (see Table 1).
Granting DACA eligible immigrants a path to citizenship would provide an even larger wage boost. A 2013 analysis by the Congressional Budget Office estimated a 12 percent wage boost for undocumented citizens who were granted a path to citizenship.[vii] State and local revenues would net an additional $505 million if the 1.3 million young people currently eligible for or receiving DACA were granted a path to citizenship (see Table 1).
In contrast, failing to maintain work authorizations and deportation relief of DACA would hurt state and local coffers. If the 852,000 young immigrants currently enrolled lost the protections of DACA, it would reduce their state and local tax contributions by nearly $800 million (see Table 1).
Just as every state benefits from the tax contributions of young undocumented immigrants every state has much more to lose if we remove the protections and work authorization granted to these young immigrants who were brought to the United States as children and have always considered it home. If the Trump administration fails to protect this population from deportation, the nation risks forcing them back into the shadows and losing the economic and societal contributions these engaged young people are making in their communities.
Methodology
ITEP estimates the state and local tax contributions of DACA-eligible immigrants under different policy options through the methodology detailed below.
1. Estimated DACA- eligible and enrolled population in each state
- The number of young immigrants in each state immediately eligible for DACA comes from the Migration Policy Institute.[viii] MPI estimated just under 1.3 million young immigrants nationwide are immediately eligible for DACA. MPI’s estimates are limited to 41 states and the District of Columbia. To calculate the eligible population in the nine missing states, ITEP used the enrollee data (see below) for each state to estimate a total eligible population (see Appendix 2).
- The number of people currently enrolled in DACA nationally (852,000) and in each state comes from the United States Citizenship and Immigration Services[ix]. (see Appendix 2).
2. Taxpaying units and employment status
- This analysis treats each DACA-eligible immigrant who is working as a single taxpaying unit.
- The employment rate of immigrants depends on legal status. A 2016 national survey of 1,308 DACA recipients found that 87 percent of respondents were employed, compared to only 51 percent before gaining lawful status. The assumed employment rate of DACA-eligible immigrants with legal status, either those participating in the program or granted a pathway to citizenship, is 87 percent. The assumed employment rate of DACA-eligible immigrants who are not enrolled in the program is 51 percent.[x] Additionally, to calculate the impact on tax contributions if DACA protections are removed, 51 percent was applied to the total DACA-eligible population.
- Here’s how the national numbers break down (see Appendix 2 for state numbers):
3. Income
- Immigrant wages change depending on legal status. Undocumented workers earn $22,029 a year on average and granting DACA status increases wages by 8.5 percent, according to a 2014 report by the Center for American Progress[xi]. Putting immigrants on a path to citizenship would carry a larger effect, since it grants rights and protections associated with permanent residence. The Congressional Budget Office estimates a path to citizenship would boost wages by 12 percent[xii]. The average wages applied to the estimated DACA working population in this analysis are:
o $23,901 for the DACA-eligible population working and enrolled in the program.
o $22,029 for the DACA-eligible population working, but not enrolled in the program.
o $24,673 for the DACA-eligible population working and granted a pathway to citizenship.
4. Estimated effective tax rates (taxes as share of income) for sales, income, and property taxes paid by DACA-eligible population in each state[xiii]
ITEP’s microsimulation computer model is a sophisticated program that applies the state and local tax laws in each state (including sales, excise, income, and property tax laws) to a statistically valid database of tax returns to generate estimates of the effective tax rates paid by taxpayers at various income levels under state and local tax law in place as of December 31, 2014. In January of 2015, ITEP released the 5th edition of Who Pays? which estimates the effect of the state and local tax laws as of January 2015 on taxpayers at 2012 income levels. This report applies effective tax rates calculated in the 2015 Who Pays? report to the DACA eligible population.
The following assumptions were made to calculate the sales and excise, income, and property taxes of the undocumented immigration population:
Sales and excise taxes: Sales and excise taxes are collected by retailers every time a purchase is made on a taxable good or service. It is reasonable to assume that DACA eligible immigrants pay sales and excise taxes at similar rates to U.S. citizens and legal immigrants with similar incomes thus the estimated rates in ITEP’s Who Pays? for each state were applied to the various estimated DACA-eligible population incomes.
Income tax: Eligible immigrants enrolled in DACA are required to pay personal income taxes using a temporary social security number. Thus, this study assumes the 740,400 DACA-enrolled workers are fully complying with state personal income taxes. 100 percent compliance is also assumed under the path to citizenship policy option. Personal income tax effective rates in each state were applied accordingly.
Various studies have estimated between 50 and 75 percent of undocumented immigrants currently pay personal income taxes predominantly using Individual Tax Identification (ITIN) numbers or with false social security numbers.[xiv] This analysis assumes a 50 percent compliance rate for DACA-eligible immigrants who are not enrolled and applies 50 percent compliance if DACA protections are lost. Personal income tax effective rates in each state were applied to 50 percent of the estimated income.
Enrolled DACA recipients are eligible to receive the federal Earned Income Tax Credit (EITC) and the state versions of the credit as well, however state EITC benefits were not included in this study for two reasons: 1) all DACA-eligible workers are treated as single taxpaying units and 2) the average income of the enrolled DACA population is above the EITC income eligibility amounts for single workers. The impact of state EITCs was also left out of the other policy options given that DACA-eligible immigrants not enrolled in the program are ineligible for the credit.
Property tax: The first step in calculating property taxes was to identify the share of DACA-eligible immigrants who are homeowners or renters in each state. This analysis used state-by-state data from the Migration Policy Institute to estimate homeownership rates for undocumented immigrants in each state. The model assumes that for renters, half of the cost of the property tax paid initially by owners of rental properties is passed through to renters.
[i] “Deferred Action for Childhood Arrivals Process (Through Fiscal Year 2016, 4th Qtr.).” United States Citizenship and Immigration Services (USCIS). Available at: https://www.uscis.gov/sites/default/files/USCIS/Resources/Reports%20and%20Studies/Immigration
%20Forms%20Data/All%20Form%20Types/DACA/daca_performancedata_fy2016_qtr4.pdf
[ii] Batalova, Jeanne, et al. “DACA at the Two-Year Mark: A National and State Profile of Youth Eligible and Applying for Deferred Action.” Migration Policy Institute, Aug. 2014, http://www.migrationpolicy.org/research/daca-two-year-mark-national-and-state-profile-youth-eligible-and-applying-deferred-action
[iii] Christensen Gee, et al. “Undocumented Immigrants’ State and Local Tax Contributions.” Institute on Taxation and Economic Policy, Mar. 2017, http://www.itep.org/pdf/immigration2017.pdf
[iv] See the methodology section for more information on the calculation of estimated undocumented immigrant state and local tax payments.
[v] Davis, Carl, et al. “Who Pays? A Distributional Analysis of the Tax Systems in All 50 States, 5th ed.”, Institute on Taxation and Economic Policy, Jan. 2015, www.whopays.org.
[vi] “Results of Tom K. Wong, United We Dream, National Immigration Law Center, and Center for American Progress National Survey.” Center for American Progress, https://cdn.americanprogressaction.org/content/uploads/2016/10/21111136/2016-daca_survey_draft_updated-FINAL2.pdf
[vii] “Economic Impact of S. 744, Border Security, Economic Opportunity, and Immigration Modernization Act.” Congressional Budget Office, Congressional Budget Office, Jun. 2013, www.cbo.gov/sites/default/files/113th-congress-2013-2014/reports/44346-Immigration.pdf.
[viii] See endnote 2 and Migration Policy Institute, “Deferred Action for Childhood Arrivals (DACA) Data Tools.” http://www.migrationpolicy.org/programs/data-hub/deferred-action-childhood-arrivals-daca-profiles#overlay-context=events
[ix] USCIS (see endnote i)
[x] Center for American Progress (see endnote vi)
[xi] Oakford, Patrick. “Administrative Action on Immigration Reform.” Center for American Program, September 2014. https://www.americanprogress.org/issues/immigration/reports/2014/09/04/96177/administrative-action-on-immigration-reform/
[xii] Congressional Budget Office (see endnote vii)
[xiii] Institute on Taxation and Economic Policy (see endnote iii)
[xiv] See among others: Feinleib, Joel, and David Warner. “Issue Brief #1: The Impact of Immigration on Social Security and the National Economy.” Social Security Advisory Board, Social Security Advisory Board, Dec. 2005, www.ssab.gov/Portals/0/OUR_WORK/REPORTS/Impact%20of%20Immigration%20on%20
Social%20Security%20Brief_2005.pdf;
Singer, Paula, and Linda Dodd-Major. “Identification Numbers and U.S. Government Compliance Initiatives.” Tax Analysts, 20 Sept, 2004; and Cornelius, Wayne, and Jessica Lewis. Impacts of Border Enforcement on Mexican Migration: The View from Sending Communities, La Jolla, Calif.: University of California at San Diego, Center for Comparative Immigration Studies, 2007.2017 State and Local Tax Contributions of Young Undocumented Immigrants.pdf