EXECUTIVE SUMMARY
The Trump Administration recently released its proposed budget for Fiscal Year 2018. The administration claims that its proposals would reduce the deficit in nearly every year over the next decade before eventually achieving a balanced budget in 2027, but the assumptions it uses to reach this conclusion are deeply flawed. This report explains these flaws and their consequences for the debate over major federal tax changes.
- The Trump Administration’s budget includes economic growth assumptions that flow from unrealistic projections rather than rigorous economic analysis. With top economist positions still unfilled in the administration, non-experts decided that the budget would include highly optimistic growth targets to create the illusion that the budget will achieve balance after 10 years.
- In the past, the addition of baby boomers and women to the workforce fueled an economic expansion that cannot be easily replicated. But as a growing share of the population reaches retirement age, job growth will slow in the years ahead. Moreover, the number of new workers will be further diminished if the administration succeeds in reducing the immigration rate.
- In the absence of a rapidly growing labor force, output per worker would have to grow at a nearly unprecedented rate for President Trump’s predicted level of economic growth to become a reality. Specifically, for the economy to grow at rates projected in the Trump budget, current growth in worker output would need to double to levels that either match or exceed its best rates of growth from the past 40 years.
- Independent analysts predict far slower economic growth than the Trump Administration. The administration’s budget predicts an average rate of economic growth roughly 50 percent faster than the rates forecasted by the Congressional Budget Office (CBO) and the Federal Reserve.
- It is not unusual for a presidential administration to assume a somewhat faster rate of growth than independent analysts such as the CBO. But the discrepancy between the Trump Administration’s long-run forecasts and those made by the CBO is the largest on record, going back to 1978. Throughout the last 25 years in particular, there has never been a gap of more than 0.4 percentage points between the CBO forecast and an administration’s forecast. The gap between the Trump budget and the CBO forecast, by contrast, is 1.1 percentage points.
- The administration’s economic exaggerations are designed, in part, to help pave the way for what President Trump has described as “maybe the biggest tax cut we’ve ever had.” By pairing fanciful economic forecasts with proposals for massive, top-heavy tax cuts, the Trump Administration’s basic political strategy bears a strong resemblance to that of Kansas lawmakers prior to their enactment of disastrous state tax cuts in 2012. This may prove helpful to the administration’s efforts to pass a major tax cut, but only because it obscures the tax cut’s true cost.
INTRODUCTION
President Donald Trump recently released a budget proposal for Fiscal Year 2018 that creates the appearance of reducing the deficit in nearly every year over the next decade and of achieving a balanced budget by 2027.[1] In a move that shocked many observers, however, the proposal showed no direct impact on federal revenues from most of the major tax policy changes that the President proposed just one month earlier.[2]
Days before the administration released its budget, Vice President Mike Pence stated that President Trump would “sign into law the most consequential tax cut in American history.”[3] For his part, President Trump has described his tax plan as “maybe the biggest tax cut we’ve ever had.” While a detailed estimate of the plan’s revenue impact has yet to be produced, an ITEP analysis of a similar plan released by the Trump campaign indicated that it would reduce federal revenues by up to $6.4 trillion over a decade. [4] And yet the budget not only lacked an acknowledgement of any drain on federal revenues, but in fact showed revenues increasing because of the exceptional economic growth that the President’s overall policy agenda would allegedly unleash.[5]
Many of the details surrounding this budget’s representation of the President’s tax plan defy comprehension. “Accounting trick,” “mystery money,” “magic math,” and “simply ludicrous” are just a few of the phrases uttered in the days following the budget’s release.[6] After initially trying to sidestep these criticisms by claiming that the President had not proposed a tax cut at all, the administration’s budget director, Mick Mulvaney, ultimately made the astonishing admission that “I wouldn’t take what’s in the budget as indicative of what our [tax policy] proposals are.”[7]
But while the budget’s inaccurate portrayal of the President’s tax plan has rightly sparked controversy, an even more fundamental manipulation of the budget has taken place with equally significant implications for the debate over federal tax policy. Specifically, the economic growth forecasts contained in President Trump’s budget are unreliable and should not be taken seriously by anyone seeking to understand the nation’s true budget outlook, and the impact of tax changes on that outlook.
THE TRUMP ECONOMIC FORECAST
To create the illusion of a balanced budget, the Trump Administration assumes that the economy will grow at an unrealistically rapid rate that is not supported by the findings of independent analysts who have closely examined the factors likely to impact the economy in the years ahead.
Specifically, as seen in Figure 1, the Trump White House posits that the economy will grow 2.3 percent in 2017, 2.4 percent in 2018, 2.7 percent in 2019, 2.9 percent in 2020, and 3.0 percent between 2021 and 2027.[8] Although 3 percent growth has been achieved twice over the past 17 years, this report explains that there is no reason to believe that such growth can be sustained over a longer time horizon going forward.
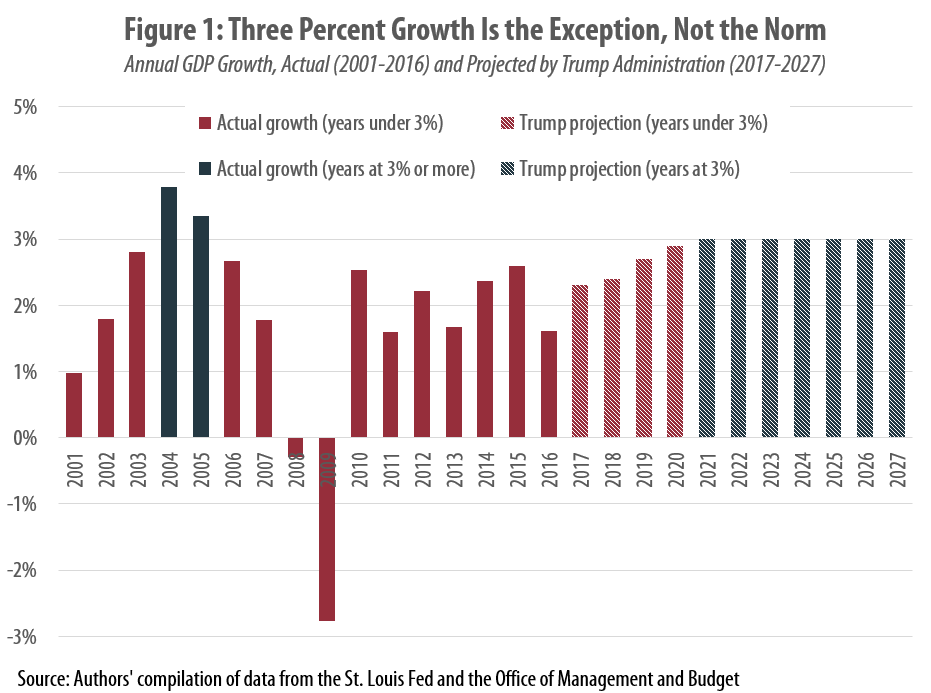
By assuming the economy will grow at these rates, the Trump Administration shaved trillions of dollars off its accounting of the nation’s debt and created the impression that the budget is more capable of absorbing large, top-heavy tax cuts for corporations and high-income individuals than is actually the case.[9],[10]
TRUMP ECONOMIC FORECASTS ARE ROOTED IN WISHFUL THINKING, NOT RIGOROUS ANALYSIS
The Trump Administration did not arrive at its rosy economic projections through conventional means. Normally, an administration will begin formulating its budget based in part on an economic forecast prepared by economists within the Council of Economic Advisers (CEA). Since the CEA’s top positions have yet to be filled, however, the role of formally trained economists was dramatically reduced in this year’s estimating process.
This development troubled Douglas Holtz-Eakin, an economist in both Bush administrations and president of the conservative American Action Forum. After the Trump Administration first began releasing its forecasts, Holtz-Eakin said:
The biggest thing I’m surprised about is they don’t have the people in place to do this … No one is at the CEA, so how is this getting done?[11]
Reporting by Nick Timiraos of the Wall Street Journal provided the answer. Rather than rely on rigorous economic analysis, the growth targets were dictated by political officials:
Normally, the executive branch starts with a baseline forecast prepared by career staff of the CEA … Discussions for the Trump Administration unfolded differently, with transition officials telling the CEA staff the growth targets that their budget would produce and asking them to backfill other estimates off those figures.[12]
This report was later confirmed by Mick Mulvaney, the Director of the Office of Management and Budget (OMB), who stated in a briefing with reporters:
Everything is keyed to getting us back to 3 percent. The ugly truth is this: You can never balance the budget at 1.9 percent growth. Just not going to happen. So those out there who say you’re never going to grow beyond 1.9 percent are condemning us to a future filled with nothing but debts and deficits.[13]
The next day, Mulvaney responded to what he characterized as “attacks” on this 3 percent assumption by stating that economists who viewed the figure as unrealistic were taking “a pessimistic look at what the potential for this country and for what this country’s people is. We reject that pessimism.”[14]
In reality, there are clear long-run economic trends that make achieving 3 percent growth in the years ahead highly unlikely. But as former Treasury Secretary Larry Summers explained, “the Trump economic team has not engaged in serious analysis or been in dialogue with those who are capable of it so they have had nothing to say in defense of their forecast except extravagant claims for their policies.”[15]
ACHIEVING GROWTH LEVELS IN TRUMP FORECAST WOULD REQUIRE AN UNPRECEDENTED SURGE IN OUTPUT PER WORKER
While 3 percent economic growth is far from unprecedented in U.S. history, there are clear demographic reasons that this level of growth will be very difficult to achieve in the years ahead. Recent experience has already begun to make this clear. Since 2001 the economy has reached a 3 percent growth rate on just two occasions—3.8 percent in 2004 and 3.3 percent in 2005. The average rate of growth since 2001 has been just 1.8 percent.
The basic challenge
Throughout the second half of the twentieth century, the addition of baby boomers to the workforce led to an increase in employment that helped fuel economic growth. From 1950 to 2007, the “prime-age” population – Americans between the ages of 25 and 54, who are considered to be in their prime working years – more than doubled from 60.9 to 125.7 million people.[16] This rapid growth was amplified by the fact that a growing share of women in this age group also decided to enter the workforce for the first time.[17]
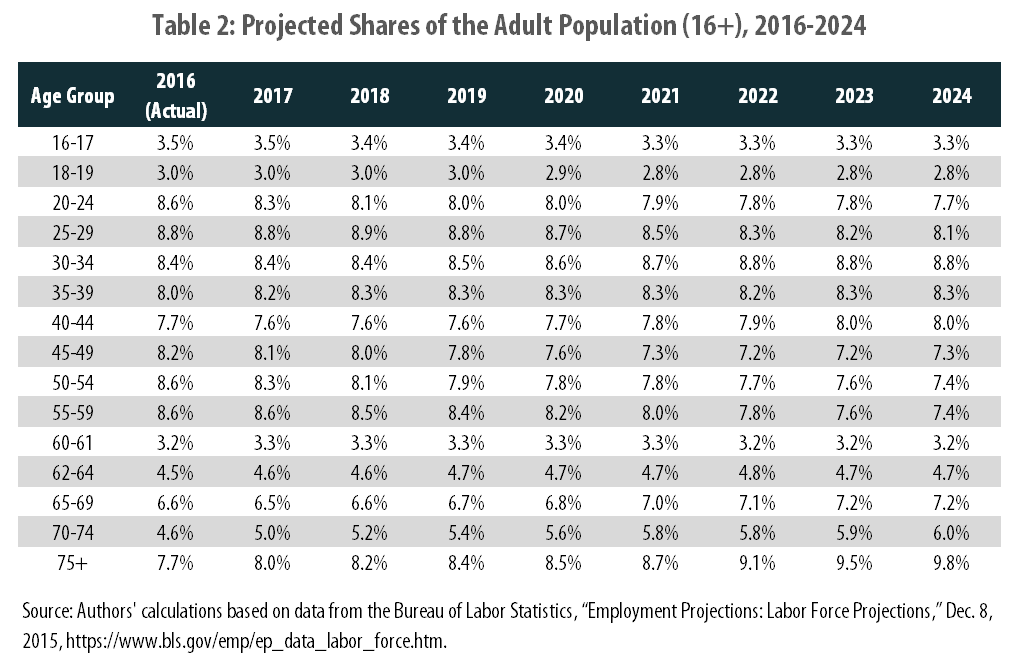
But this rapid growth has come to an end. Between 2007 and 2016, the prime-age population increased by just 65,000 people.[18] The aging of the population will continue to significantly hamper employment growth over the next decade. Between 2016 and 2024, the share of the adult population aged 60 and older is projected to increase from 26.6 percent to 30.9 percent (see Table 2 in the appendix). Because Americans in this age range are typically retired rather than working, this shift will decrease the employment rate of the adult population. (Note that in this report, “adult” refers to people age 16 and older.)
Immigration & employment growth
Options for boosting employment growth in the face of this demographic shift are very limited. Under a different President, employment growth could be accelerated by allowing working-age immigrants into the country. President Trump, however, made opposition to immigration a central feature of his campaign. As Dr. Dale Jorgenson of Harvard University explains, “if you slow the immigration rates a bit, it’s going to cost you in terms of growth.”[19]
Immigration has played a key role in propping up job growth over the past decade.[20] America’s foreign-born population has been responsible for 49 percent of the country’s employment growth since 2005, and 52 percent since 2007. Moreover, immigration has helped negate the adverse effects of recent demographic changes. From 2005 to 2016, the native-born, prime-age population in the United States declined by 2.7 million people, while the foreign-born, prime-age population rose by 4.3 million. This means that without a growing foreign-born population, total prime-age employment would have declined by about 3.5 million workers over this period.
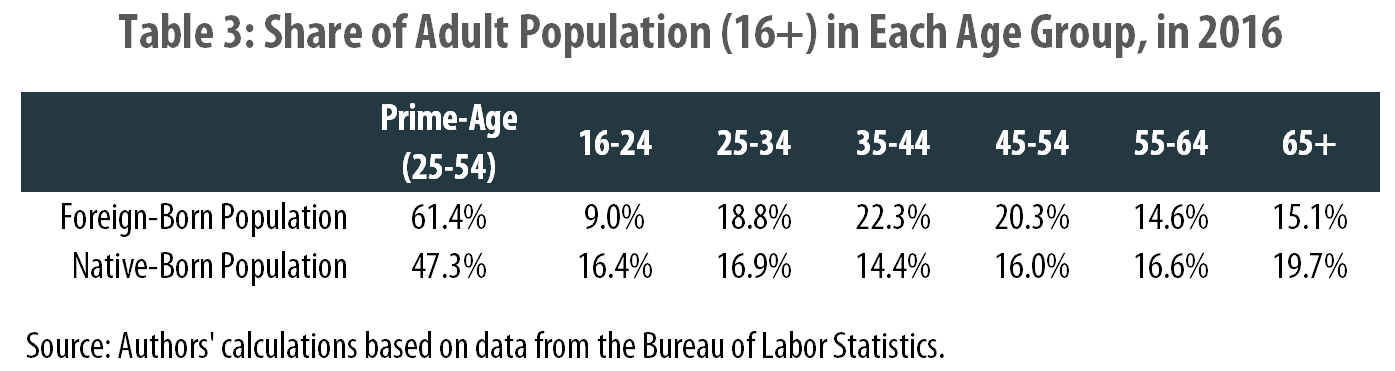
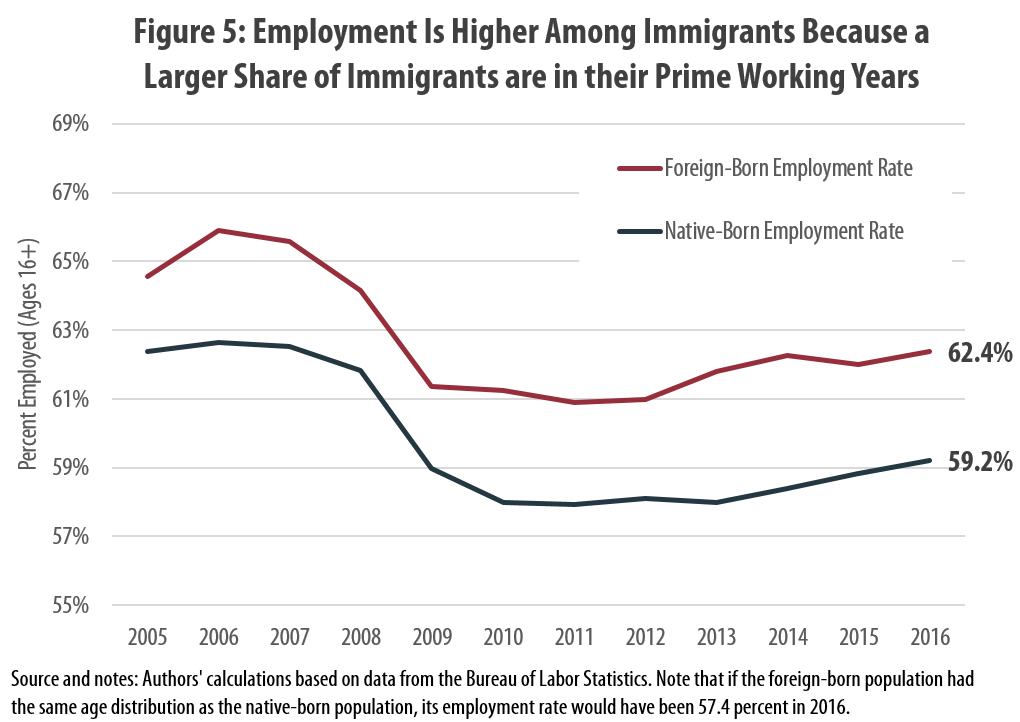
A recent paper from the International Monetary Fund (IMF) indicates that immigration can be especially important to advanced economies with aging populations. [21] The IMF noted that, across highly developed countries, immigration tends to have a positive effect on GDP per capita. This is because immigrants are more likely to be of working age than their native-born counterparts, meaning that on net, immigrants boost the employment rate of the overall population. This higher employment rate in turn raises GDP per capita, simply because there are more workers per capita. This logic is clearly applicable to the United States, where foreign-born persons have a higher employment rate than native-born persons because of differences in age (see Table 3 and Figure 5 in the appendix). If the Trump Administration succeeds in reducing immigration, there will be a slowdown in the rate of job gains, making the President’s economic growth targets all the more difficult to achieve in the coming years.
Employment scenarios
Figure 2 shows the employment rate of the U.S. adult population from 1995-2016 along with projected 2017-2024 employment rates under three different scenarios.
- In the first and most pessimistic scenario, all fifteen age groups displayed in Table 2 (appendix) maintain their respective 2016 employment rates between 2017 and 2024. Under such a scenario, all changes to the overall employment rate are driven purely by demographic shifts rather than by rising or falling rates of employment for any given age group.
- The second scenario shows the employment rates projected by the Congressional Budget Office (CBO) in its 2017 Long-Term Budget Outlook.[22]
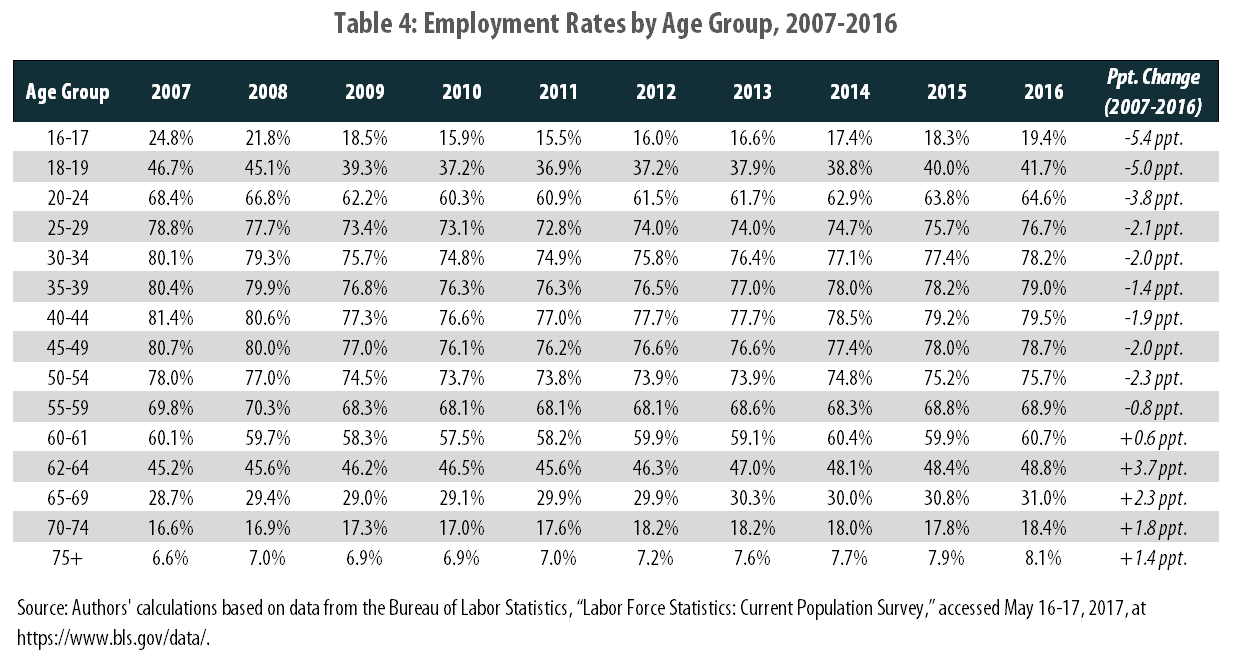
- The third scenario assumes that the labor market will fully recover from the Great Recession by 2019. As can be seen in Table 4 (appendix), employment is still down relative to 2007 for Americans ages 16-59. However, based on recent improvements in the labor market, the economy is on track to recover all of its lost employment by 2019.[23] This third “recovery” scenario therefore makes two assumptions about employment growth from 2017-2024: first, for Americans ages 60 and over, employment rates will not change between 2016 and 2024. Second, for Americans under the age of 60, each age group will recover one-third of its lost employment by 2017, two-thirds of its lost employment by 2018, and all of its lost employment by 2019; employment rates will thereafter remain constant.[24]
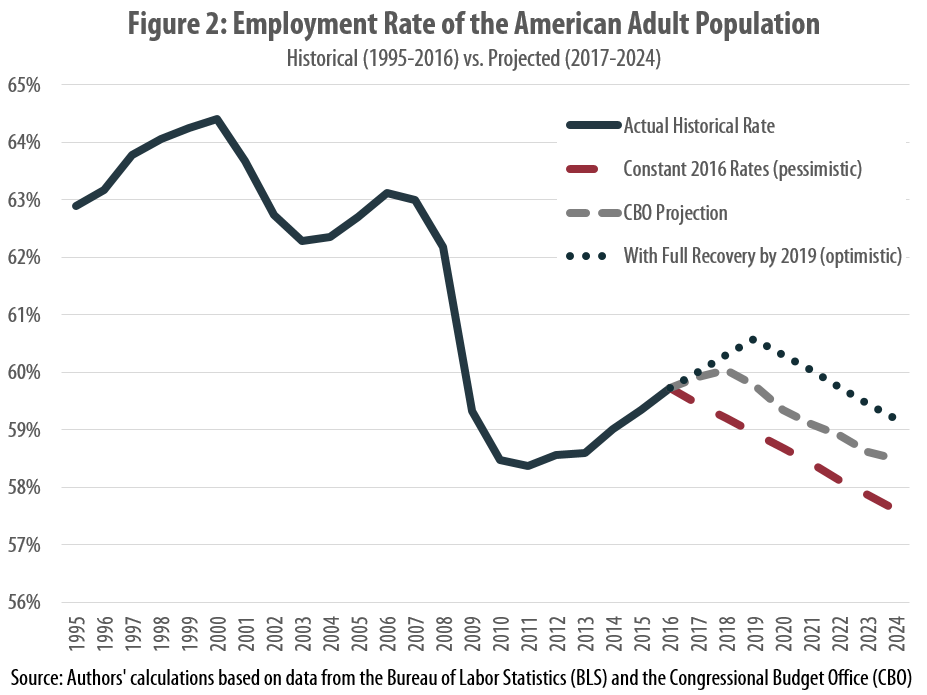
As Figure 2 shows, even if more working-age Americans return to the labor market and gain jobs, the aging of the population will nonetheless result in a low-employment economy. The employment rate may rise over the next 2 to 3 years, but soon thereafter the effects of demographic change will inevitably pull that rate back down.
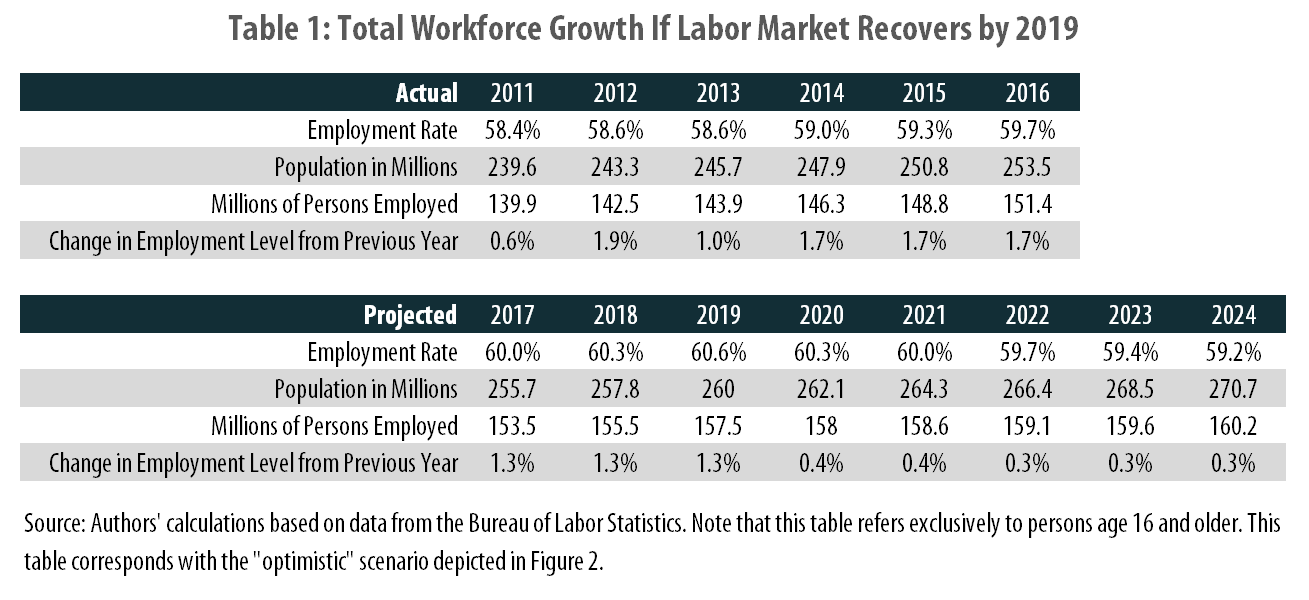
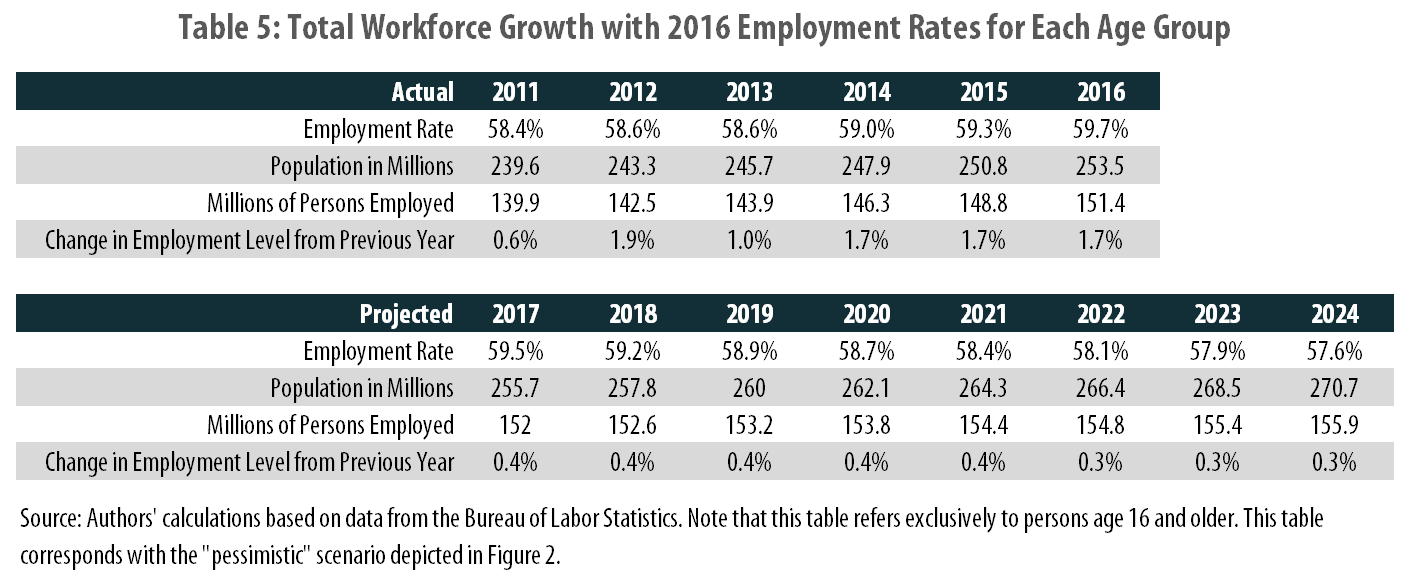
Table 1 shows how the size of the adult workforce would change under the optimistic “recovery” scenario depicted in Figure 2. (Table 5 in the appendix shows the same results under the most pessimistic scenario.) Since hitting a low of 139.1 million workers in 2010, the workforce has grown by an average of 1.4 percent per year, and in each of the past three years it has grown 1.7 percent. However, after 2019, the workforce is projected to grow less than 0.5 percent per year, a slowdown that will subtract roughly a percentage point from the overall rate of GDP growth.
Need for an unprecedented surge in worker output
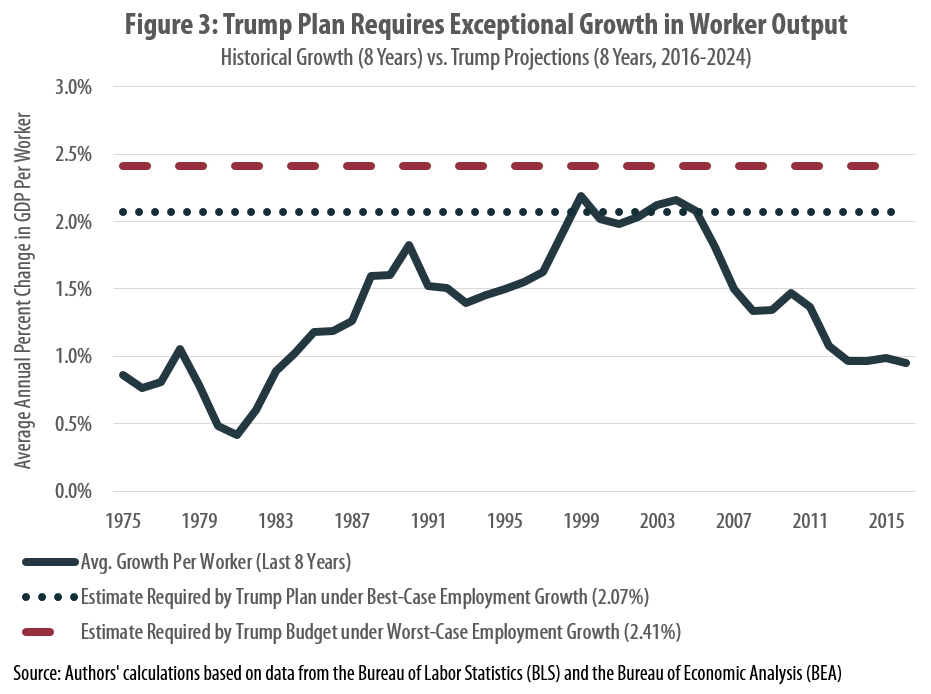
Given that the workforce will grow at only a tepid pace going forward, the rates of total output growth projected by the Trump Administration will require extraordinary growth in output per worker. Recall that the Trump Administration is projecting 2.3 percent GDP growth in 2017, 2.4 percent GDP growth in 2018, 2.7 percent GDP growth in 2019, 2.9 percent GDP growth in 2020, and 3.0 percent GDP growth thereafter. Even if we assume that employment will grow according to the optimistic projections presented in Table 1, GDP per worker would need to grow by an average of 2.07 percent for the economy to grow at the rate the Trump Administration has projected. If we assume that employment will grow in line with the more pessimistic projections presented in Table 5, then GDP per worker will need to grow at an average rate of 2.41 percent per year to achieve Trump’s projected GDP growth.
Worker output has rarely increased at such rates. GDP per worker has grown at a rate of 2 percent or higher in just 13 of the past 47 years (1970-2016) and three of the past 17 years (2000-2016). Moreover, in two of these three years – 2002 and 2010 – the measure achieved these levels of growth not because GDP was rising especially quickly, but because employment was falling. In other words, growth in worker output of 2 percent or higher is uncommon, and achieving such growth in an era of job creation is exceptional. Yet implicit in the Trump Administration’s growth projections is a presumption that this would occur every year starting in 2020.
Furthermore, there is no historical evidence to suggest that such remarkable growth can be sustained over the long-run. Figure 3 contrasts the historical record on growth in worker output with the growth rates that would need to occur to realize the administration’s forecasts under both the optimistic and pessimistic labor market scenarios described above. This figure reports an eight-year running average of worker output growth, rather than single year figures, to illuminate the longer-run nature of this issue.[25] Achieving the Trump Administration’s forecasted rate of growth will require sustained, rapid growth in worker output, not just a few sporadic years of strong growth.
Even if the economy recovers all the jobs that were lost during the Great Recession, GDP per worker will still need to roughly tie its all-time fastest growth rates in order to match the projections from the Trump plan; and if employment growth is weaker, GDP per worker will have to rise faster than it has at any point over the past forty years.
It should be noted that this level of growth in GDP per worker will be even more difficult to achieve if, as the CBO currently projects, average working hours decline over the next eight years.[26] GDP per worker is a product of both GDP per hour worked and hours worked per worker, meaning that a decline in workers’ average hours will push down GDP per worker.
Finally, it will be difficult to achieve higher rates of worker output growth if the rate of immigration is slowed, or if a large number of immigrants are deported. Immigrants generally enhance the level of innovation in their adopted home countries.[27] In the United States, immigrants start their own businesses at higher rates than native-born Americans, and also patent new inventions at a disproportionally high rate.[28],[29] In fact, during each of the past eight years for which data are available (2008-2015), foreign-born individuals – be they immigrants or foreign investors – have accounted for half or more of all U.S. patents.[30] Insofar as reduced immigration diminishes the creation of both new businesses and new products, it will likely decrease the growth rate of worker output.
In sum, for GDP to grow at the rates projected in the Trump budget, worker output will have to either tie or exceed its very best rates of growth from the past forty years. Current growth rates of worker output will have to more than double in order to make this happen. Furthermore, this spike in the growth rate of worker output will have to occur at a time when both immigration and workers’ hours are expected to decline, making it even less likely that there will be an ahistorical surge in worker output.
INDEPENDENT ANALYSTS PREDICT FAR LOWER GROWTH RATES
The Congressional Budget Office (CBO) and the Federal Reserve (or “Fed”) produce some of the most respected economic forecasts in the nation. The CBO creates its projections primarily to assist legislators who are working on fiscal policy; the Fed produces its projections to set monetary policy that will properly accommodate the path of future growth. Both groups rely on economists who assess economic data, labor markets, international trends, current events, and other factors that will affect future rates of economic growth.[31]
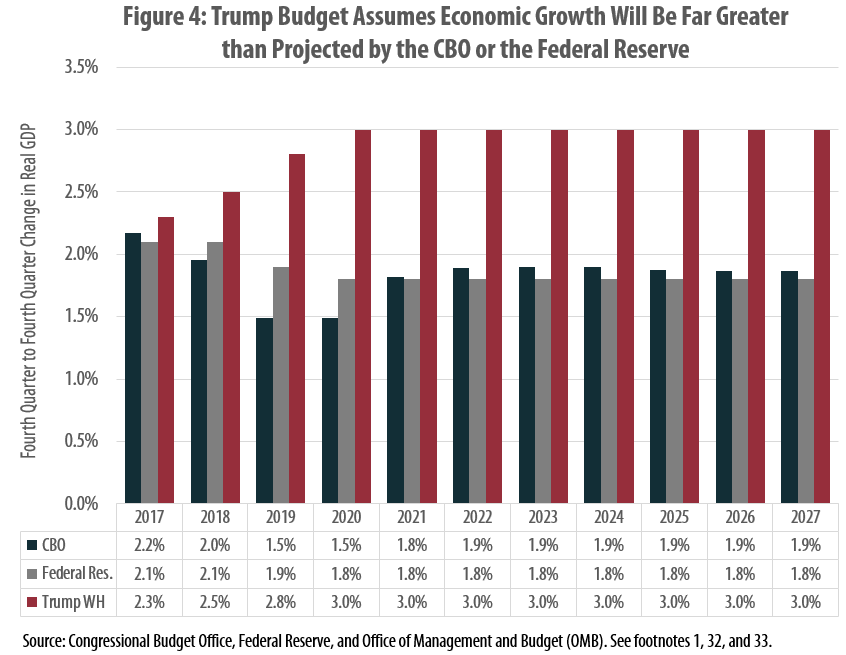
The CBO predicts that, under current law, the economy will grow 2.2 percent in 2017, 2.0 percent in 2018, and between 1.5 and 1.8 percent from 2019 to 2021. It expects that the economy will thereafter settle into a steady-state growth rate of 1.9 percent.[32]
The Fed projects that the economy will grow 2.1 percent in both 2017 and 2018, then will grow 1.9 percent in 2019.[33] In the long run, the Fed foresees annual GDP growth stabilizing at 1.8 percent. Of the Fed’s sixteen Federal Open Market Committee (FOMC) members who submitted their own individual projections for future growth, the highest long-run projection was 2.2 percent, well below the Trump projection of 3 percent.
Notably, although the CBO and the Fed disagree about how steady growth will be, both groups predict that GDP growth will average 1.8 to 1.9 percent between 2017 and 2027. By contrast, over the same period, the Trump Administration assumes that annual GDP growth will average 2.9 percent – 50 percent faster than the rate projected by the other two organizations. This discrepancy becomes most visible in the later years, as can be seen in Figure 4.[34] If the CBO and the Fed are correct, then the Trump budget exaggerates annual economic growth over the next decade by over 1 percentage point.
TRUMP ADMINISTRATION FORECASTS ARE UNUSUAL IN DEPARTING SO DRAMATICALLY FROM INDEPENDENT FORECASTS
It is not unusual for a presidential administration to produce an economic forecast that is somewhat more optimistic than those prepared by outside analysts, in part because administrations often assert that their policies will accelerate economic growth. But as Nick Timiraos of the Wall Street Journal reported, “while there are often disparities between the White House and other agencies on growth projections, they are rarely this large.”[35]
Research by the Center on Budget and Policies Priorities (CBPP) revealed that the current discrepancy in long-run forecasts between the Trump Administration and the CBO is the largest on record, going back to 1978.[36] In fact, throughout the last 25 years there has never been a gap of more than 0.4 percentage points between a presidential administration’s long-run forecast and the one produced by the CBO. The long-run gap in the Trump Administration’s budget, by contrast, stands at 1.1 percentage points.
UNREALISTIC ECONOMIC GROWTH CLAIMS WERE A CENTRAL FEATURE OF KANSAS’S FAILED TAX CUTTING EXPERIMENT AS WELL
The Trump Administration included unreasonably optimistic economic growth assumptions in its budget to create the erroneous impression that the administration has a plan for balancing the federal budget. As a rule of thumb, each 0.1 percent increase in the rate of economic growth reduces the federal deficit by roughly $300 billion over a decade.[37] The Trump Administration’s roughly 1 percentage point exaggeration, therefore, is an essential component of its budget balancing claims which shaves at least $3 trillion off its cumulative deficit estimates.[38] Under a more reasonable projection of economic growth, the Trump budget would fail to balance.
Manipulating the government’s fiscal outlook in this way is helpful to the administration’s aim of enacting large tax cuts that will primarily benefit the wealthy. Among the President’s preferred tax policy changes are reduced tax rates for corporations, business owners, successful investors, high-income taxpayers, and large estates.[39] Regardless of how many tax deductions and carve-outs the administration is willing to end to help fund its tax cuts, the sheer size of these proposed cuts virtually guarantees that they will add to the nation’s debt. Making the federal budget outlook appear as favorable as possible is therefore part of a larger strategy aimed at boosting the tax plan’s political appeal.
Unfortunately, one need not look very far for evidence of what happens when tax cuts are enacted by lawmakers viewing the economy through rose-colored glasses. In 2012, state lawmakers in Kansas enacted massive tax cuts at the urging of supply-side economists Arthur Laffer and Stephen Moore, whom President Trump has since looked to for inspiration for his own tax plan.[40] Laffer and Moore argued that lawmakers need not be overly concerned with the revenue loss associated with the cuts because “cutting taxes can have a near immediate and permanent impact” on the economy that would significantly improve Kansas’s fiscal standing.[41]
Five years later, the economic gains on which Kansas lawmakers had pinned their hopes have failed to materialize.[42] Economic growth, job growth, and small business formation have all trailed the national average. Revenues have repeatedly fallen short of projections, which has led to steep spending cuts and credit rating downgrades. In response to this fiscal catastrophe, the state’s solidly Republican legislature eventually opted to repeal most of the tax cuts by a wide margin over the veto of Gov. Sam Brownback. But years of inadequate revenue collections will have a lasting impact on the state’s schools, roads, and other priorities. As State Rep. Melissa Rooker explained, “It’s hard to celebrate because Kansas is in such shambles. The magnitude of the problems that we have to correct is so great.”[43]
The lessons for federal tax reform could not be clearer. Tax cuts should never be enacted without a clear and credible plan for how to deal with the resulting revenue loss. Obscuring the true cost of tax cuts with an unrealistic economic forecast may improve the political odds of enactment. But when the bill comes due, lawmakers and the public will find that the true cost of the cuts is more than they bargained for.
CONCLUSION
The Trump Administration is predicting that the economy will grow much more rapidly than any credible forecasting organization has predicted. In fact, the gap between the administration’s forecast and the one produced by the nonpartisan Congressional Budget Office (CBO) is larger than any on record.
To realize the Trump Administration’s forecasts in the face of an aging (and retiring) population, output per worker would have to surge to unprecedented levels. Such a surge is unlikely to materialize.
The Trump Administration has chosen to rely on an unrealistic economic forecast because doing so is helpful for fostering the impression that the federal budget will be on sounder footing than is actually the case, and because that impression will prove useful in the administration’s mission to dramatically reduce federal taxes for corporations and high-income taxpayers.
Rather than adapting its policies to reflect current economic realities, the administration has opted to distort reality to put its preferred policies in an undeservedly flattering light.
APPENDIX
[1] Office of Management and Budget, “Budget of the U.S. Government: A New Foundation for American Greatness, Fiscal Year 2018,” page 26, Executive Office of the President of the United States, May 23, 2017, at https://www.whitehouse.gov/sites/whitehouse.gov/files/omb/budget/fy2018/budget.pdf.
[2] For the tax policy proposal, see: CNN, “The 1-page White House handout on Trump’s Tax Proposal,” CNN Politics, April 26, 2017, at http://www.cnn.com/2017/04/26/politics/white-house-donald-trump-tax-proposal/. President Trump’s proposed tax reforms are discussed on pages 13-14 of the budget, yet less detail is provided in these two pages than in Treasury Secretary Mnuchin’s outline. The budget discusses repeal of the ACA tax on investment income, the federal estate tax, and the AMT; it also says that tax rates on individual income, corporate income, and pass-through business income should be cut, but it leaves out the slightly more specific figures that are included in the Mnuchin outline.
[3] Tweet by Vice President Mike Pence on May 18, 2017, at https://twitter.com/VP/status/865242666690383874
[4] Citizens for Tax Justice, “The Distributional and Revenue Impact of Donald Trump’s Revised Tax Plan,” Sept. 26, 2016, at http://ctj.org/pdf/trumprevised0926.pdf.
[5] See note 1. Tables S-3 and S-4 of President Trump’s FY2018 budget show revenues under current law of $44.581 trillion, and revenues under the President’s proposals equal to $45.751 trillion.
[6] Ehrenfreund, Max, “President Trump’s ‘Balanced’ Budget Relies on $2,062,000,000,000 in Mystery Money,” Washington Post, May 23, 2017, at https://www.washingtonpost.com/news/wonk/wp/2017/05/23/trumps-balanced-budget-relies-on-2062000000000-in-mystery-money/. Levin, Bess, “Trump’s Entire Budget Is Based on a $2 Trillion Accounting Trick,” Vanity Fair, May 23, 2017, at http://www.vanityfair.com/news/2017/05/trumps-entire-budget-is-based-on-a-2-trillion-accounting-trick. Bump, Philip, “The Impossible Magic Math of Trump’s Budget Proposal, Explained,” Washington Post, May 23, 2017, at https://www.washingtonpost.com/news/politics/wp/2017/05/23/the-impossible-magic-math-of-trumps-budget-proposal-explained/. Summers, Larry, “Trump’s Budget Is Simply Ludicrous,” Washington Post, May 23, 2017, at https://www.washingtonpost.com/news/wonk/wp/2017/05/23/larry-summers-trumps-budget-is-simply-ludicrous/.
[7] Davidson, Kate, and Richard Rubin, “Trump Officials Offer Differing Views on Tax Plan,” Wall Street Journal, May 25, 2017, at https://www.wsj.com/articles/trump-officials-offer-differing-views-on-tax-plan-1495732724. Rogan, Tom, “Mick Mulvaney: OK if Tax Reform Increases Deficit,” Washington Examiner, May 31, 2017, at http://www.washingtonexaminer.com/mick-mulvaney-ok-if-tax-reform-increases-deficit/article/2624625.
[8] See note 1. Table S-9, page 45.
[9] As a rule of thumb, every 0.1 percentage point gain in annual economic growth can be expected to reduce the deficit by $300 billion, after accounting for increased revenues and lower expenditures resulting from that growth. In the context of the Trump Administration’s specific degree of overestimation, this suggests roughly $3 trillion in deficit reduction that is unlikely to occur in practice. See: Stone, Chad, “In Forthcoming Trump Budget, Rosy Forecasts of Economic Growth Likely to Produce Highly Unrealistic Budget Estimates,” Center on Budget and Policy Priorities, May 3, 2017 at http://www.cbpp.org/research/federal-budget/in-forthcoming-trump-budget-rosy-forecasts-of-economic-growth-likely-to.
[10] While the lack of detail in the 1-page outline released by the Trump Administration makes it impossible to precisely measure the plan’s distributional impact, the outline’s inclusion of tax cuts for corporations, business owners, successful investors, high-income taxpayers, and large estates is clearly designed to benefit the nation’s wealthiest taxpayers. For an ITEP Model analysis showing that a similar tax plan proposed by Donald Trump during his presidential campaign was steeply regressive, see: Citizens for Tax Justice, “The Distributional and Revenue Impact of Donald Trump’s Revised Tax Plan,” Sep. 26, 2016, at http://ctj.org/pdf/trumprevised0926.pdf.
[11] Timiraos, Nick, “Trump Team’s Growth Forecasts Far Rosier Than Those of CBO, Private Economists,” Wall Street Journal, February 17, 2017, at https://www.wsj.com/articles/trump-teams-growth-forecasts-far-rosier-than-those-of-cbo-private-economists-1487356278.
[12] Ibid.
[13] Mulvaney, Mick, “Off-Camera Briefing of the FY18 Budget by Office of Management and Budget Director Mick Mulvaney,” White House Office of the Press Secretary, May 22, 2017, at https://www.whitehouse.gov/the-press-office/2017/05/22/camera-briefing-fy18-budge-omb-director-mulvaney.
[14] Mulvaney, Mick, “Press Briefing on the FY2018 Budget,” White House Office of the Press Secretary, May 23, 2017, at https://www.whitehouse.gov/the-press-office/2017/05/23/press-briefing-fy2018-budget.
[15] Summers, Larry, “Another ‘Great Mystery’ in Trump’s Budget Proposal,” CNBC, May 30, 2017, at http://www.cnbc.com/2017/05/30/larry-summers-trump-budget-3-percent-growth-forecast-a-joke-commentary.html.
[16] Based on data from Bureau of Labor Statistics, Current Population Survey, series LNU00000060.
[17] Between 1948 and 2000, the employment rate of prime-age women rose from 33.7 to 74.2 percent (Bureau of Labor Statistics, Current Population Survey, series LNU02300062). However, drawing women into the workforce is more of a one-time event than a repeatable occurrence. Since the turn of the century, the employment gap between prime-age men and prime-age women has been stuck at around 11-15 percentage-points, and the employment rate of prime-age women has consistently stayed in the low seventies.
[18] Based on data from Bureau of Labor Statistics, Current Population Survey, series LNU00000060.
[19] Timiraos, Nick, “Trump Team’s Growth Forecasts Far Rosier Than Those of CBO, Private Economists,” Wall Street Journal, February 17, 2017, at https://www.wsj.com/articles/trump-teams-growth-forecasts-far-rosier-than-those-of-cbo-private-economists-1487356278.
[20] All calculations in this section are based on data from the Bureau of Labor Statistics.
[21] Jaumotte, Florence, Ksenia Koloskova, and Sweta Chaman Saxena, “Impact of Migration on Income Levels In Advanced Economies,” pg. 1, 2, & 17, International Monetary Fund, Oct. 24, 2016, at https://www.imf.org/en/Publications/Spillover-Notes/Issues/2016/12/31/Impact-of-Migration-on-Income-Levels-in-Advanced-Economies-44343.
[22] Congressional Budget Office (CBO), “Long-Term Budget Projections: Mar 2017,” March 30, 2017, at https://www.cbo.gov/about/products/budget-economic-data#1. The CBO’s projected 2017-2024 employment rates can be calculated based on the Office’s projected 2017-2024 Labor Force Participation Rates and Unemployment Rates. See Table 2, “Econ and Demographic Vars,” rows 21 and 23.
[23] The prime-age employment rate rose nearly 0.7 percentage-points between 2015 and 2016, yet is still down 2.0 percentage-points relative to 2007. Adjusting for prime-age population growth, this puts the economy on track to fully recover from the Great Recession by 2019.
[24] This scenario may somewhat understate the overall employment rate if employment continues rising among seniors. In BLS data going back to 1994, employment rates were at their all-time highs in 2016 for 60-64 year-olds, 65-69 year-olds, 70-74 year-olds, and persons age 75 & older. However, while the assumptions in the third scenario may understate job growth among seniors, they almost certainly overstate job growth for younger Americans. From 1985 to 2007, rising rates of school enrollment pushed down employment among 16-24 year-olds. School enrollment continued rising between 2007 and 2016, meaning that even if the labor market fully recovers by 2019, the employment rates of 16-17 year-olds, 18-19 year-olds, and 20-24 year-olds will still likely be lower than they were in 2007. See: Buffie, Nick, “Trends in Employment and School Enrollment Among 16–24 Year-Olds,” Center for Economic and Policy Research, March 14, 2017, at http://cepr.net/blogs/cepr-blog/trends-in-employment-and-school-enrollment-among-16-24-year-olds. Also see: Krueger, Alan, “Where Have All the Workers Gone?”, page 14, Federal Reserve Bank of Boston, Oct. 4, 2016, link not available.
[25] The average is taken over eight years because current data only allow for an eight-year projection. Note that the use of an eight-year timeframe in the context of the Trump Administration’s budget somewhat understates the growth in worker output that will be needed to achieve Trump’s growth targets through 2027 because the years omitted from this timeframe (2025, 2026, and 2027) are forecast at 3.0 percent growth, despite the fact that the aging of the population will dampen the rate of job growth even more significantly in these years than in the 2016-2024 timeframe.
[26] CBO projects that average hours per worker will decline 0.1 percent per year from 2017 to 2046. See Table 2 of the CBO’s most recent long-term budget outlook at https://www.cbo.gov/about/products/budget-economic-data#1.
[27] Jaumotte, Florence, Ksenia Koloskova, and Sweta Chaman Saxena, “Impact of Migration on Income Levels In Advanced Economies,” pg. 1, 2, & 17, International Monetary Fund, Oct. 24, 2016, at https://www.imf.org/en/Publications/Spillover-Notes/Issues/2016/12/31/Impact-of-Migration-on-Income-Levels-in-Advanced-Economies-44343.
[28] For more on new business formation, see: Kerr, Sari Pekkala, and William Kerr, “Immigrant Entrepreneurship,” National Bureau of Economic Research, July 2016, at http://www.nber.org/papers/w22385. For short write-ups of their paper’s findings, also see the authors’ summaries of their paper at the Harvard Business Review and at VoxEU.
[29] For more on immigrants’ disproportionate share of American patents, see: Akcigit, Ufuk, John Grigsby, and Tom Nicholas, “Immigration and the Rise of American Ingenuity,” National Bureau of Economic Research, Feb. 2017, at http://www.nber.org/papers/w23137. Sequeira, Sandra, Nathan Nunn, and Nancy Qian, “Migrants and the Making of America: The Short- and Long-Run Effects of Immigration during the Age of Mass Migration,” National Bureau of Economic Research, March 2017, at http://www.nber.org/papers/w23289. Partnership for a New American Economy, “Patent Pending: How Immigrants Are Reinventing the American Economy,” June 2012, at http://www.newamericaneconomy.org/wp-content/uploads/2013/07/patent-pending.pdf.
[30] https://www.uspto.gov/web/offices/ac/ido/oeip/taf/us_stat.htm
[31] To allow for a comparison of the most recent available figures, this section is based on growth from the fourth quarter of the previous calendar year to the fourth quarter of the year indicated. This slightly affects the growth numbers reported in the Trump budget; GDP growth goes from 2.4 to 2.5 percent for 2018, 2.7 to 2.8 percent for 2019, and 2.9 to 3.0 percent for 2020. All other years remain the same.
[32] Congressional Budget Office (CBO), “An Update to the Budget and Economic Outlook: 2017 to 2027,” June 29, 2017, at https://www.cbo.gov/about/products/budget-economic-data.
[33] The growth rates presented in this paragraph reflect the growth rates projected by the median member of the Federal Reserve’s Federal Open Market Committee (FOMC). See: Federal Open Market Committee, “Economic Projections of Federal Reserve Board Members and Federal Reserve Bank Presidents Under their Individual Assessments of Projected Appropriate Monetary Policy, March 2017,” Board of Governors of the Federal Reserve System, March 15, 2017 at https://www.federalreserve.gov/monetarypolicy/files/fomcprojtabl20170315.pdf.
[34] In Figure 4, it is assumed in the Federal Reserve projection that the economy will begin growing at the FOMC’s “Longer run” growth rate beginning in 2020.
[35] Timiraos, Nick, “Trump Team’s Growth Forecasts Far Rosier Than Those of CBO, Private Economists,” Wall Street Journal, February 17, 2017, at https://www.wsj.com/articles/trump-teams-growth-forecasts-far-rosier-than-those-of-cbo-private-economists-1487356278.
[36] Stone, Chad, “Gap Between Trump, CBO Predictions on Economic Growth the Largest on Record,” Center on Budget and Policy Priorities, May 22, 2017, at http://www.cbpp.org/research/federal-budget/gap-between-trump-cbo-predictions-on-economic-growth-the-largest-on-record.
[37] Stone, Chad, “In Forthcoming Trump Budget, Rosy Forecasts of Economic Growth Likely to Produce Highly Unrealistic Budget Estimates,” Center on Budget and Policy Priorities, May 3, 217 at http://www.cbpp.org/research/federal-budget/in-forthcoming-trump-budget-rosy-forecasts-of-economic-growth-likely-to.
[38] Stone, Chad, “Gap Between Trump, CBO Predictions on Economic Growth the Largest on Record,” Center on Budget and Policy Priorities, May 22, 2017, at http://www.cbpp.org/research/federal-budget/gap-between-trump-cbo-predictions-on-economic-growth-the-largest-on-record.
[39] See notes 2 and 10.
[40] Chait, Jonathan, “As Voodoo Economics Collapses in Kansas, Trump Takes It National,” New York Magazine, June 8, 2017, at http://nymag.com/daily/intelligencer/2017/06/as-voodoo-economics-fails-in-kansas-trump-takes-it-national.html. Goldmacher, Shane, “How Trump Gets His Fake News,” Politico, May 15, 2017, at http://www.politico.com/story/2017/05/15/donald-trump-fake-news-238379.
[41] Mazerov, Michael, “Kansas’ Tax Cut Experience Refutes Economic Growth Predictions of Trump Tax Advisors,” Center on Budget and Policy Priorities, August 12, 2016, at http://www.cbpp.org/research/federal-tax/kansas-tax-cut-experience-refutes-economic-growth-predictions-of-trump-tax.
[42] Ehrenfreund, Max, “Kansas’s Conservative Experiment May Have Gone Worse than People Thought,” Washington Post, June 15, 2017, at https://www.washingtonpost.com/news/wonk/wp/2017/06/15/kansas-conservative-experiment-may-have-gone-worse-than-people-thought/.
[43] Shorman, Jonathan and Daniel Salazar, “Lawmakers Override Brownback Veto of Tax Increases, Rolling Back 2012 Cuts,” The Wichita Eagle, June 6, 2017, at http://www.kansas.com/news/politics-government/article154684809.html.