Income inequality has reached its highest level since the U.S. Census Bureau began tracking the measure more than 50 years ago, according to data released this week.
While recent Census data show modest increases in median household income and average hourly wages—numbers anti-tax politicians and pundits have used to deny rising inequality—a deeper look at some of the latest numbers reveals a decades-long trend of widening economic inequality.
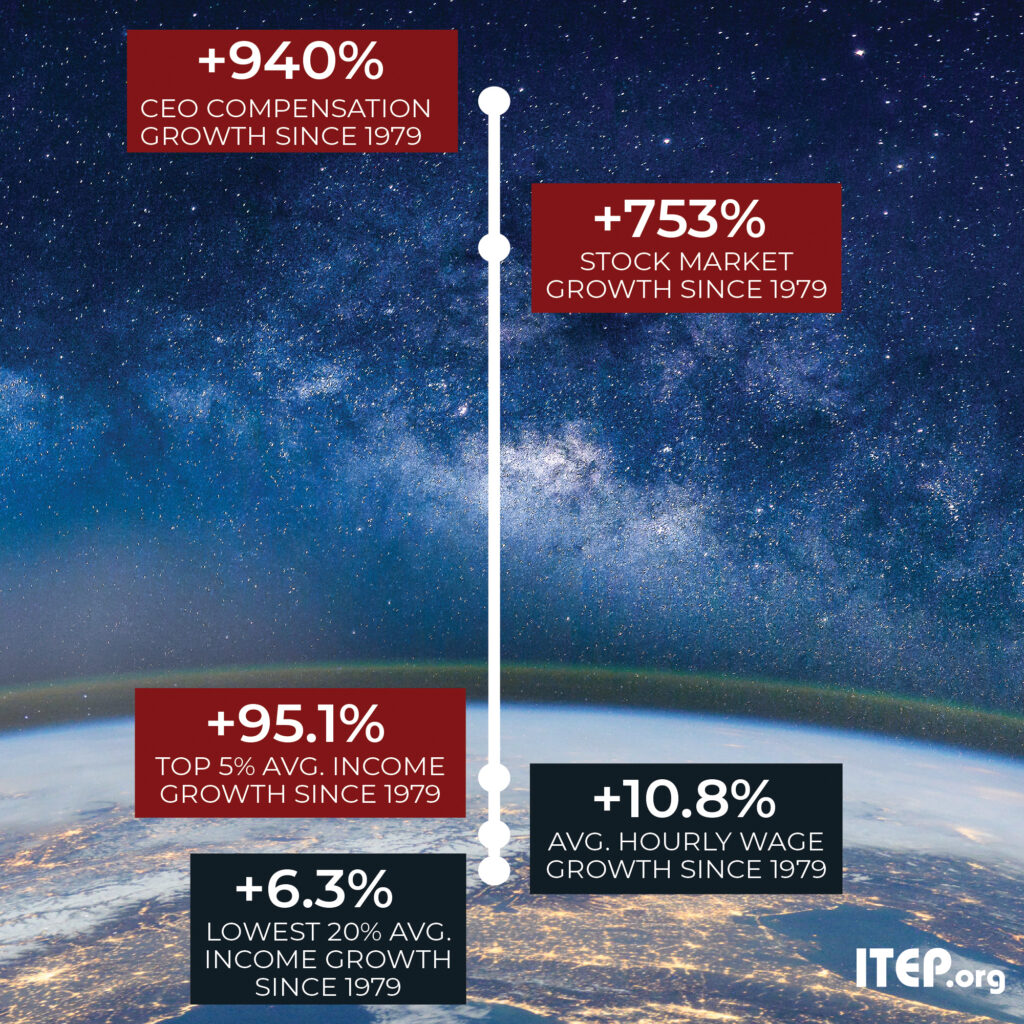
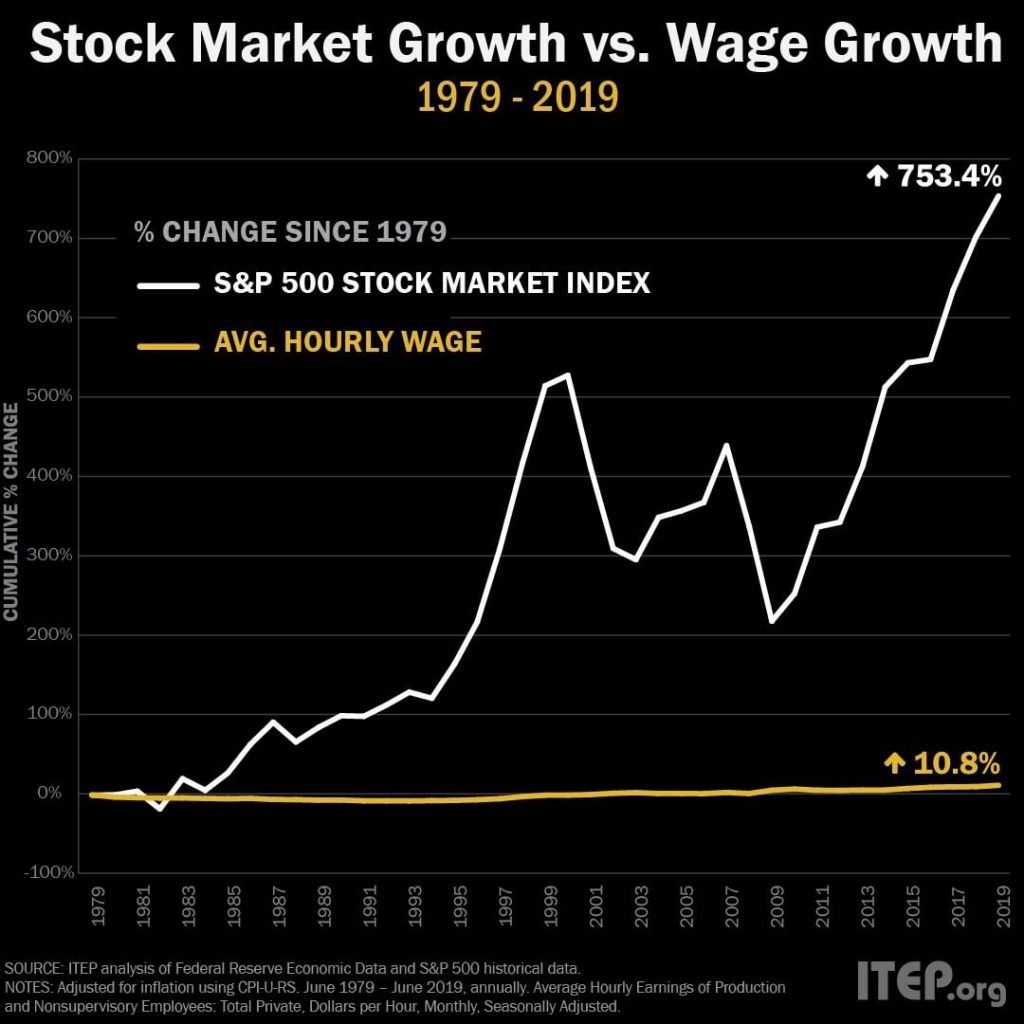
Take a look at the chart below. Over the past 40 years, CEOs’ compensation and stock market growth has climbed astronomically compared to average hourly wage growth for all workers and income growth for the bottom 20 percent.
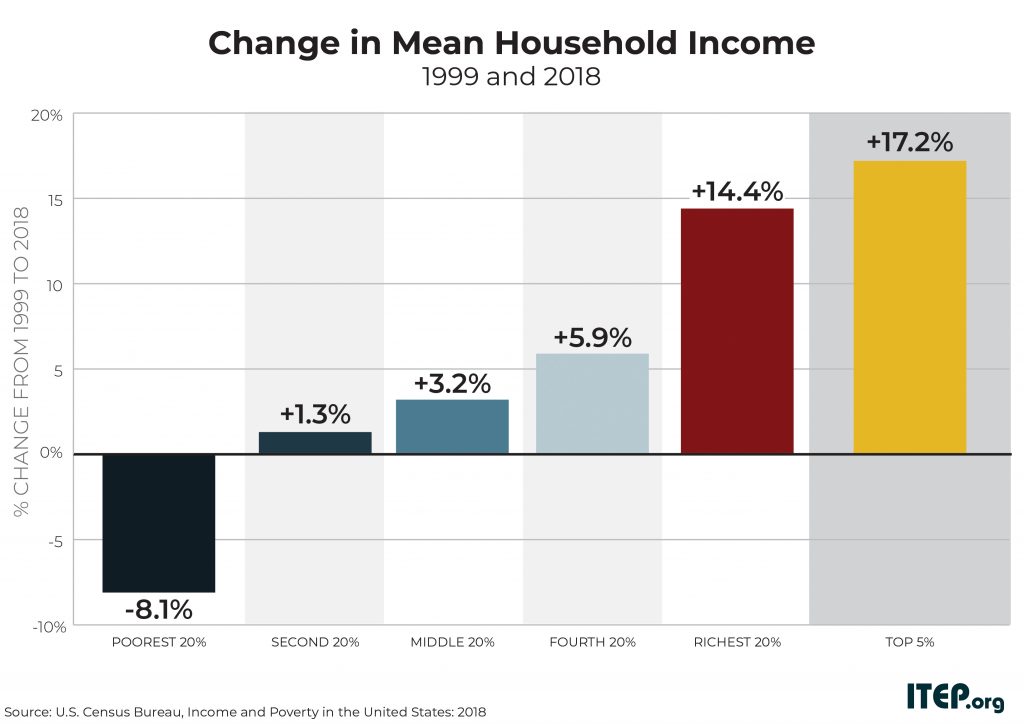
Census data released earlier this month show that average household incomes increased for all income groups in 2018. But changes in household income since 1999 (when it peaked for the lowest-income families) shows average household incomes are increasing for every group except the bottom 20 percent. It has increased most for the richest 20 percent, with an even steeper increase for the top 5 percent.
Stock market growth is not a reliable indicator of how working people and ordinary families are faring. Increases in wages have lagged behind the rate of inflation, and workers have the same purchasing power today that they did 40 years ago.
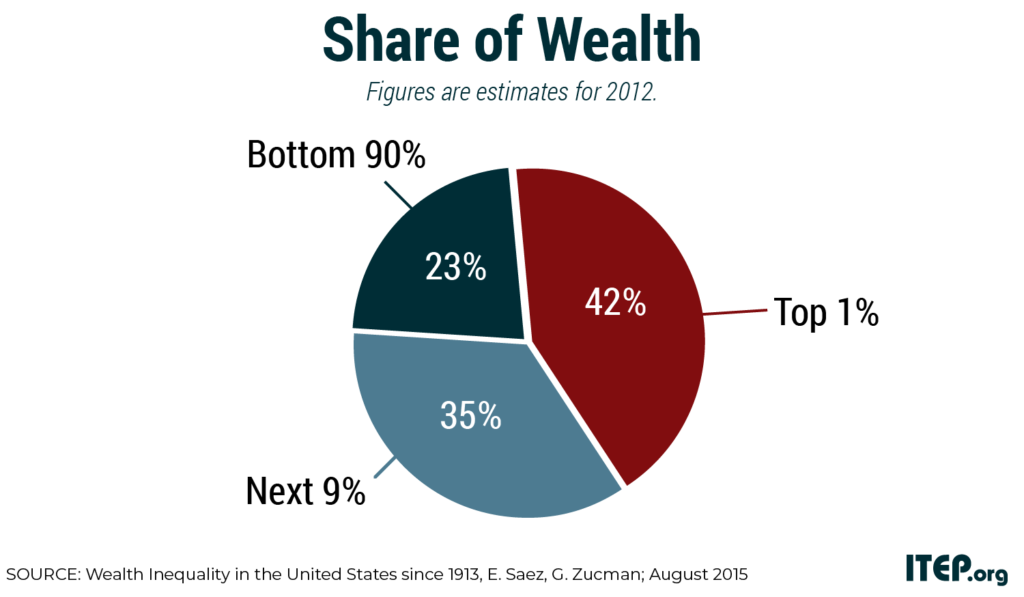
In addition to income inequality, wealth inequality has been intensifying for decades with the top 1 percent owning a bigger slice than ever. Among the richest 400, which constitute the top 0.00025 percent, the gap is even greater. This tiny group holds a greater share of wealth than the 150 million adults in the bottom 60 percent of income earners. In fact, an early 2019 study found that share of wealth among the richest 400 Americans has tripled since the early 1980s.
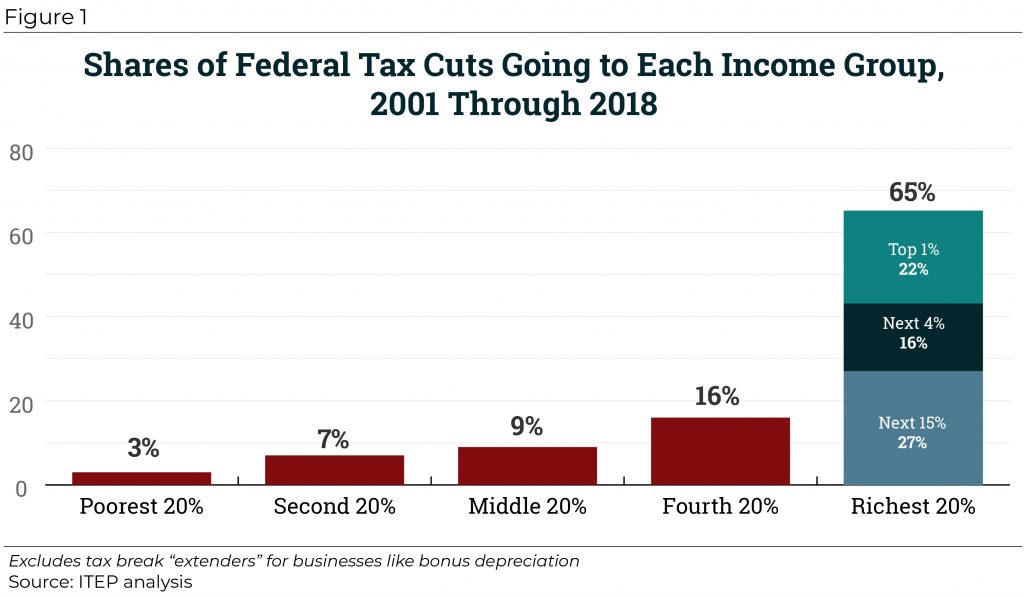
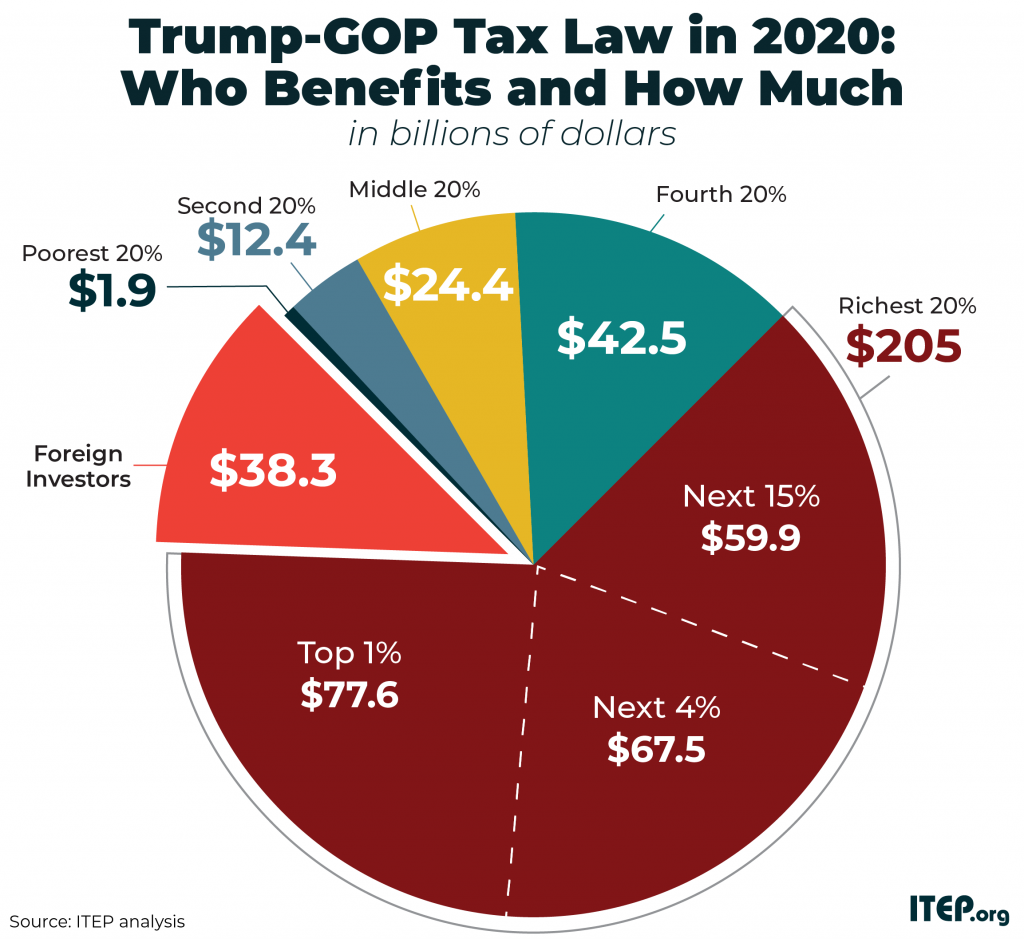
All of these indicators prove the nation has a worsening economic inequality problem. Top-heavy federal tax cuts and upside-down state tax systems make it worse.
The most recent example is the Tax Cuts and Jobs Act. Some economists say the 2017 law may have contributed to last year’s increase in income inequality.
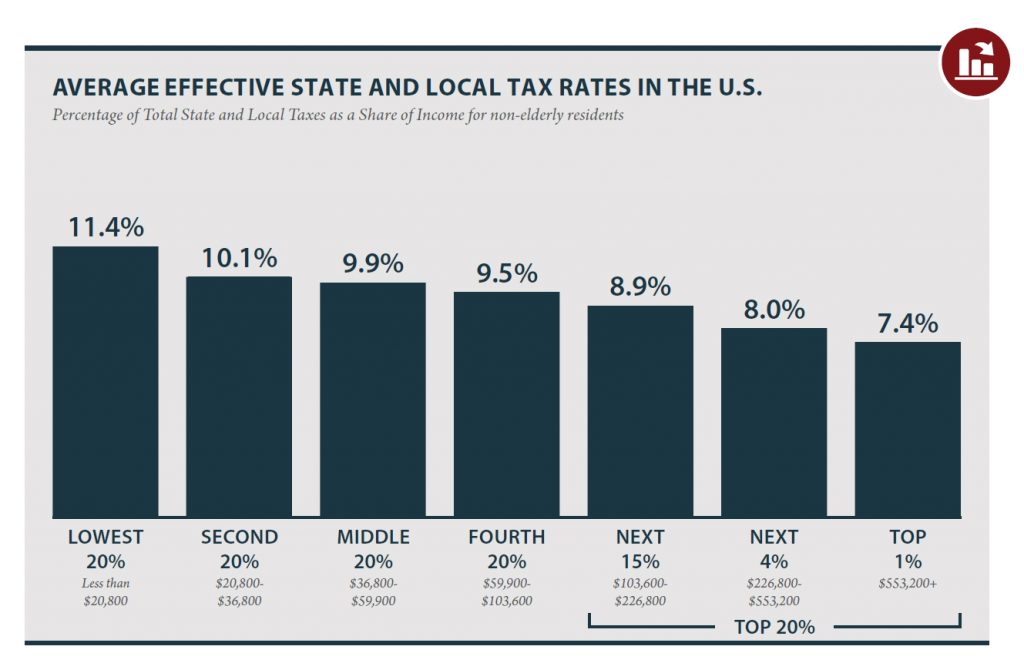
Upside-down state tax systems also exacerbate economic inequality. ITEP’s flagship report, Who Pays?, found that on average, the poorest 20 percent pay a 50 percent higher effective state and local tax rate than the top 1 percent, making income more unequal after taxes in nearly every state.
Instead of denying the problem exists, we need to talk about solutions. An ITEP report earlier this year outlines multiple progressive revenue-raising options—including implementing a wealth tax on the top 0.1 percent—to help alleviate inequality and restore fairness in a tax code that benefits the country’s wealthiest families and corporations.

