As we close out 2024, we want to lift up the tax charts we published this year that received the most engagement from readers. Covering federal, state, and local tax work, here are our top charts of 2024.
Who Pays?
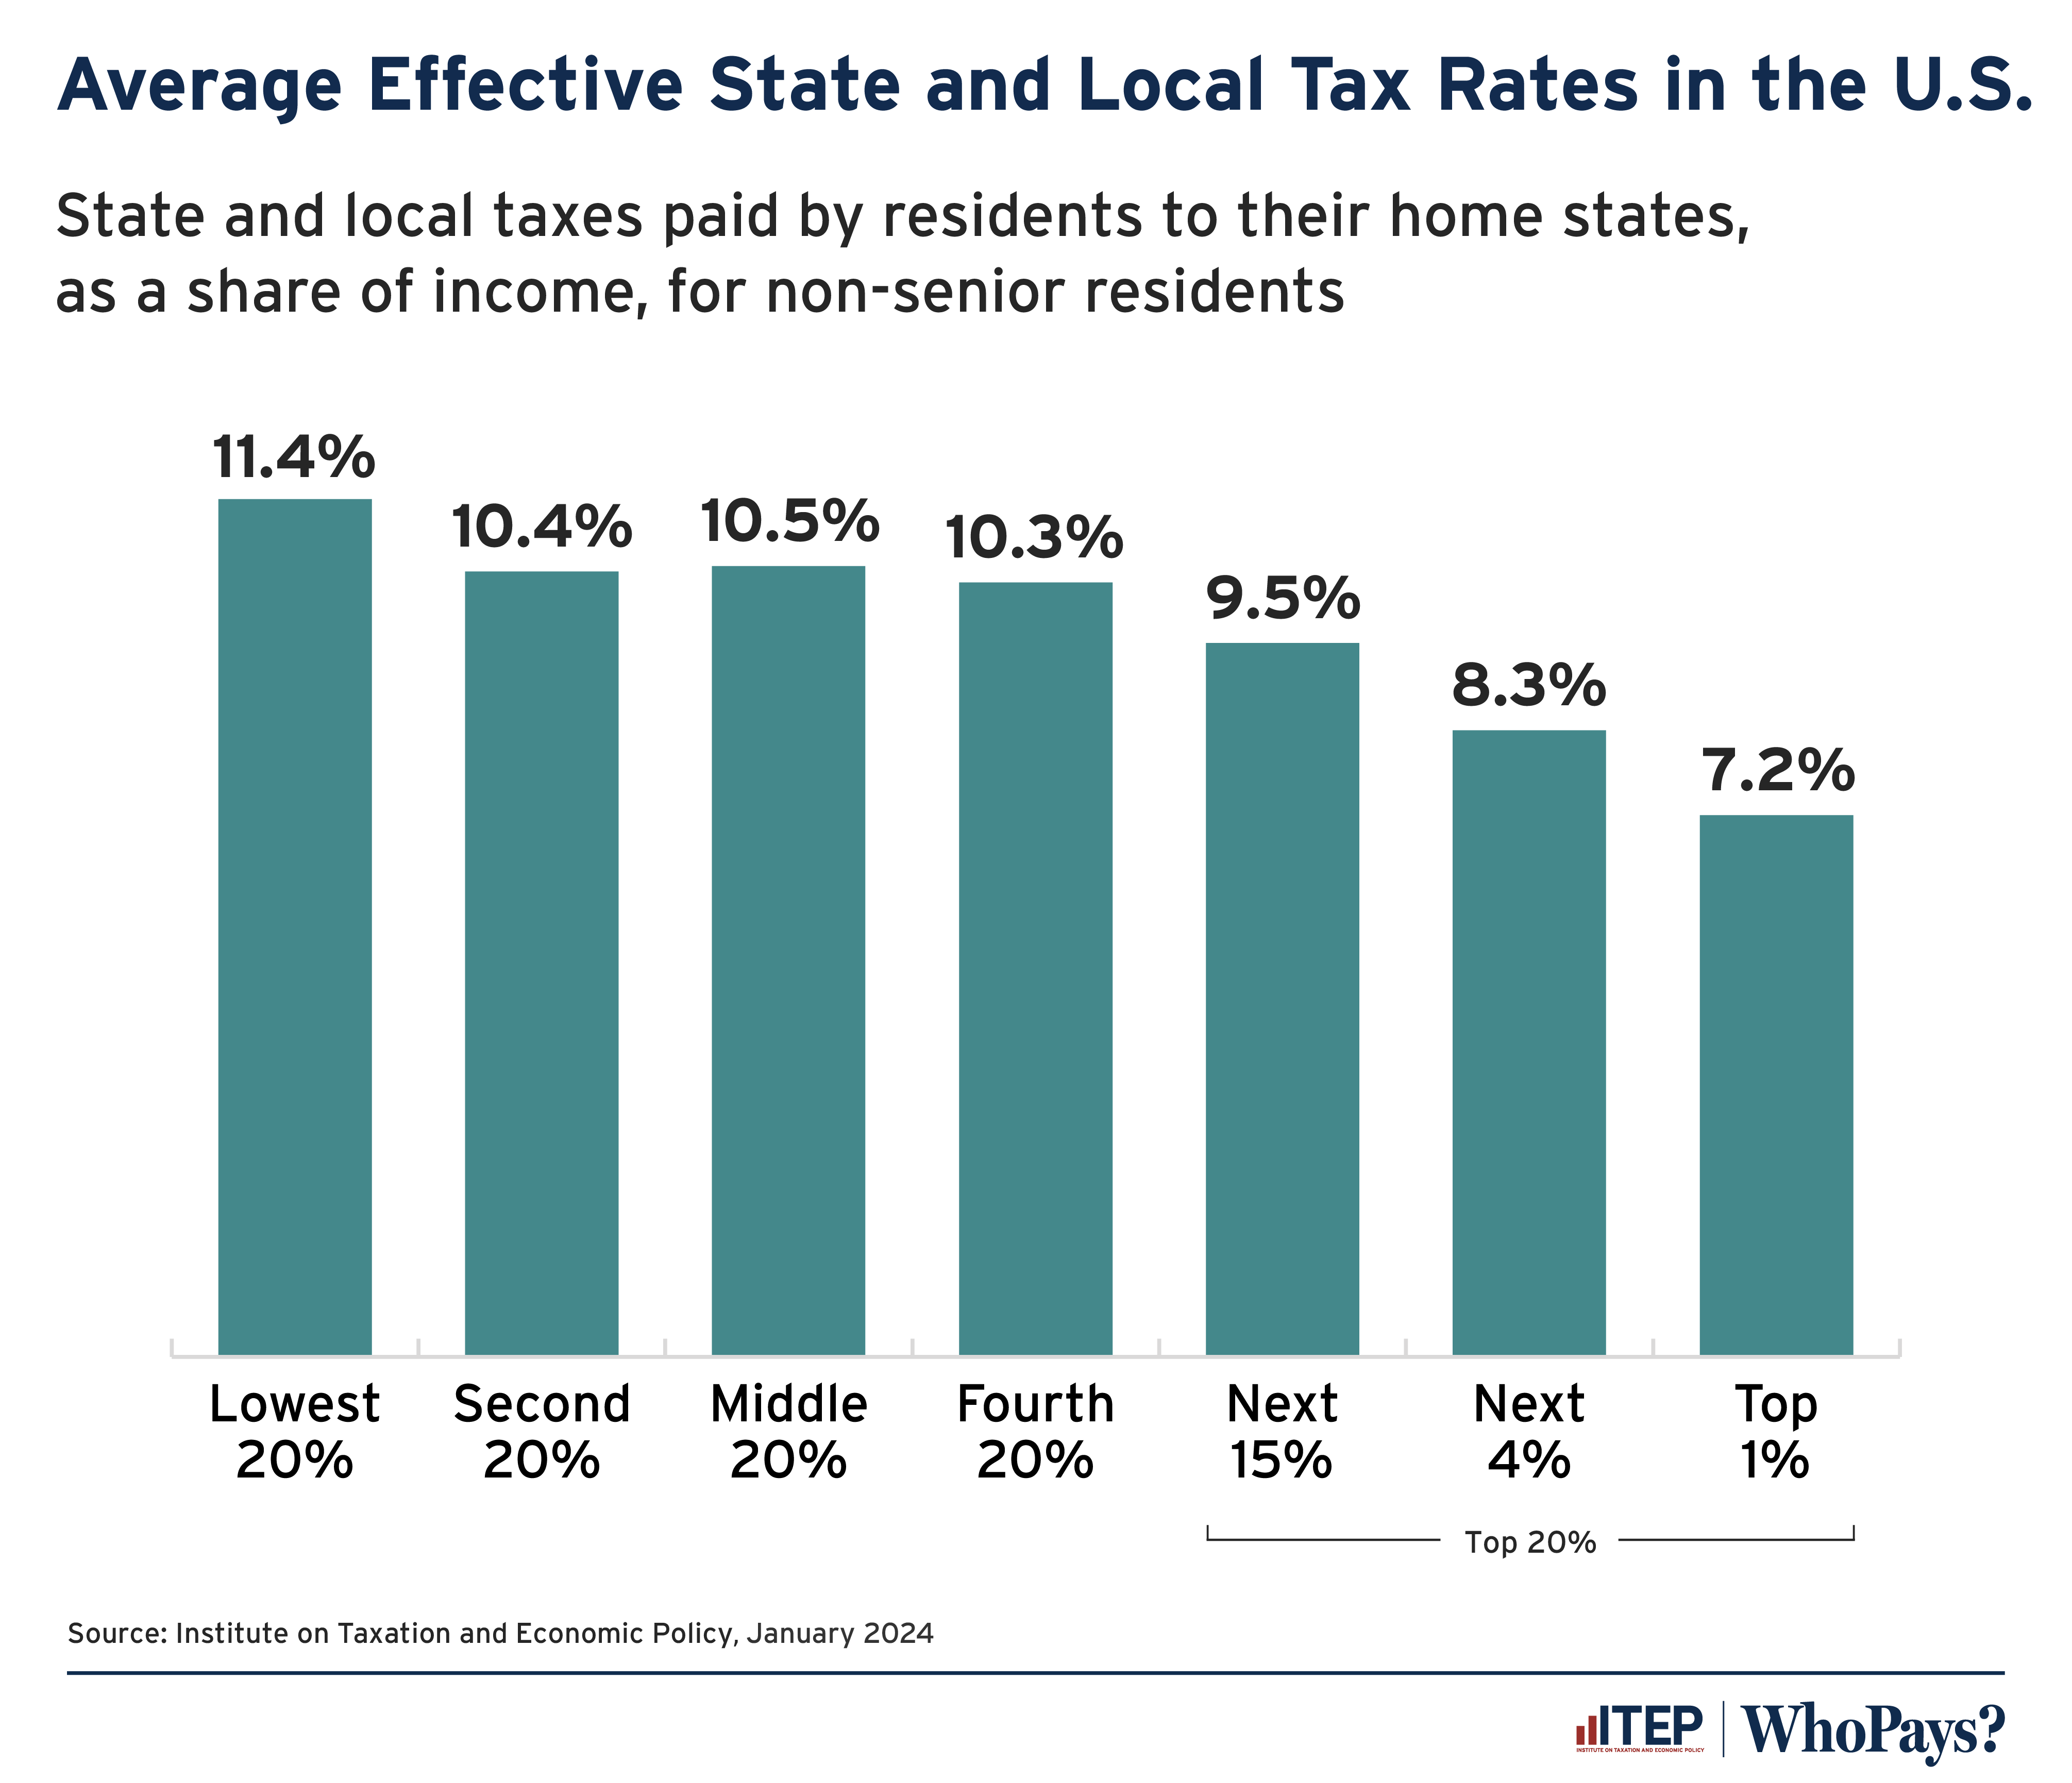
To start 2024, we published the seventh edition of Who Pays?, the only distributional analysis of tax systems in all 50 states and the District of Columbia. One major finding from that report: The vast majority of state and local tax systems are regressive, or upside-down.
This means states and local governments are asking low- and middle-income families to pay a much greater share of their income in taxes. Nationally, the average state levies an effective state and local tax rate of 11.4 percent for its lowest-income 20 percent of residents; 10.5 percent for the middle 20 percent; and 7.2 percent for the top 1 percent.
This means the top 1 percent contribute 37 percent less of their incomes toward funding state and local services in their states than the poorest families.
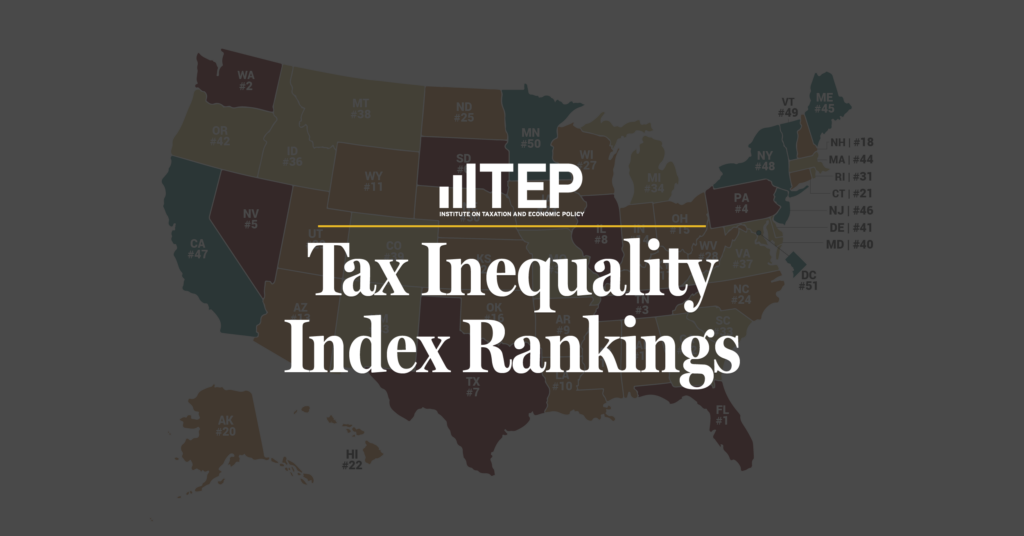
You can view tax rates in every state here. You can also share this map of ITEP’s Tax Inequality Index Rankings.
Tax Payments by Undocumented Immigrants
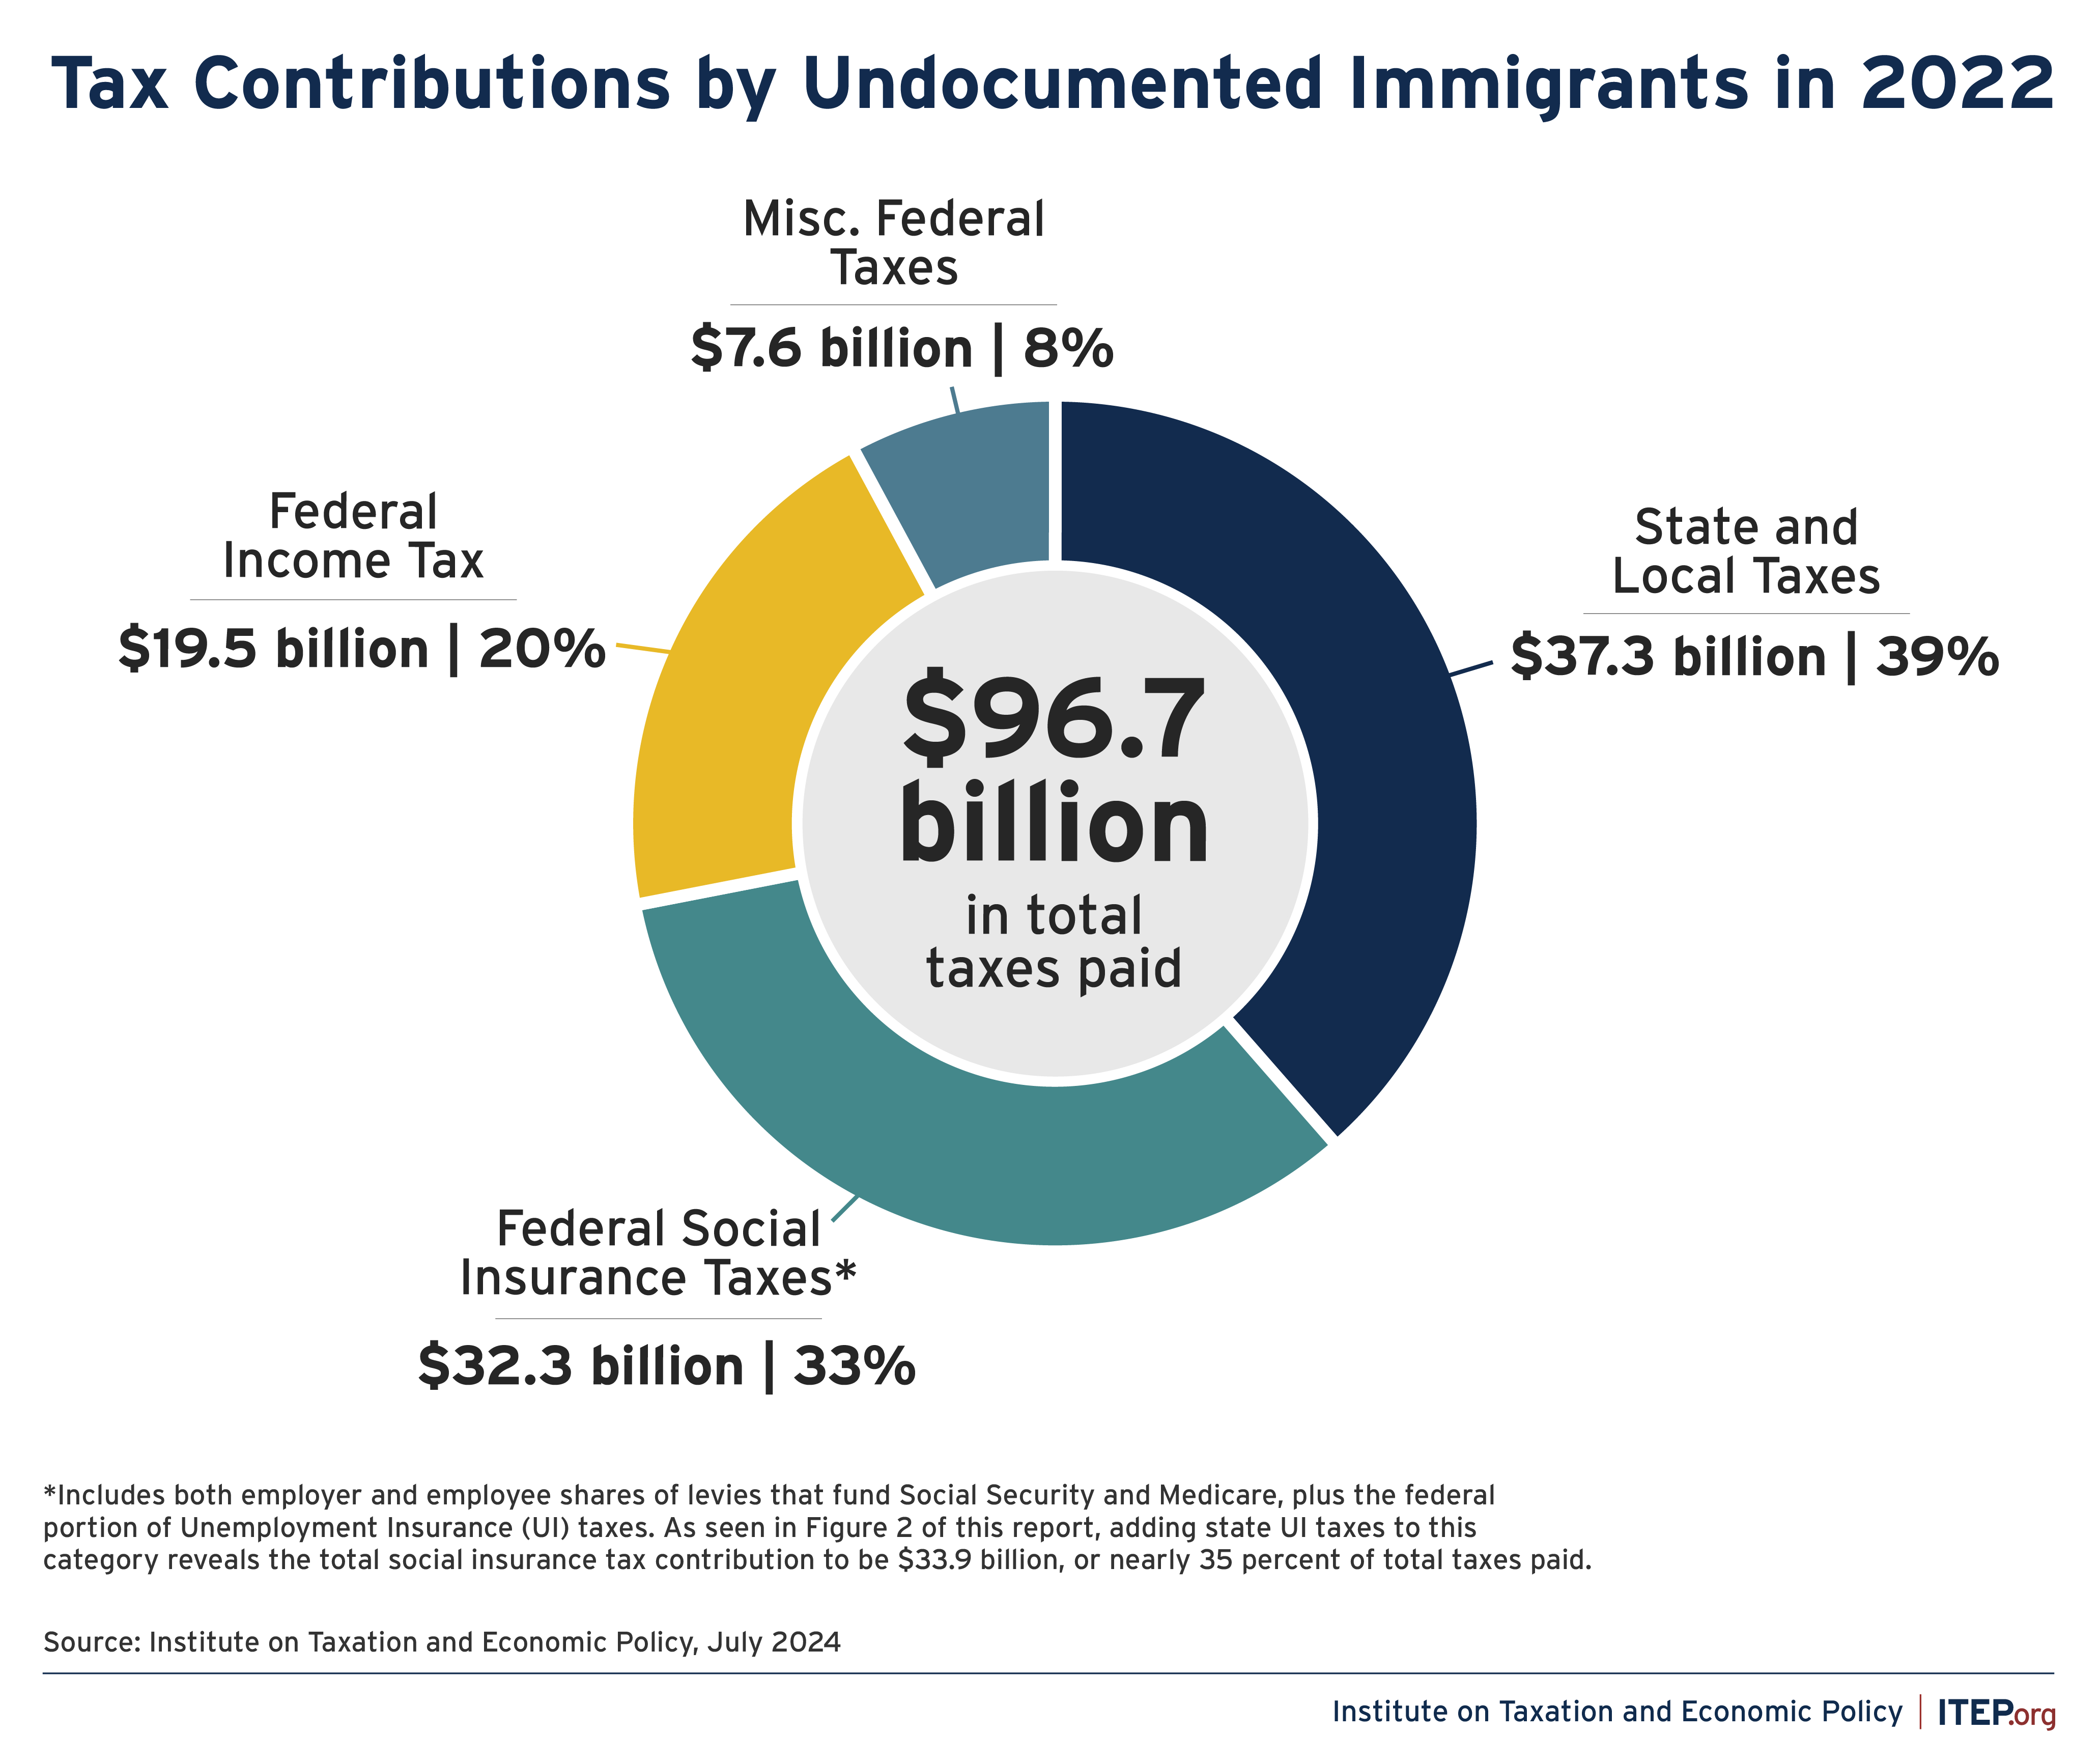
There’s a lot of misinformation when it comes to undocumented immigrants. The reality is they do pay taxes — in 2022, undocumented immigrants paid nearly $100 billion in federal, state, & local taxes. Much of that went to funding programs they are barred from accessing.
Our report on the tax payments by undocumented immigrants became the most-read ITEP product of 2024.
Trump’s Tax Plan
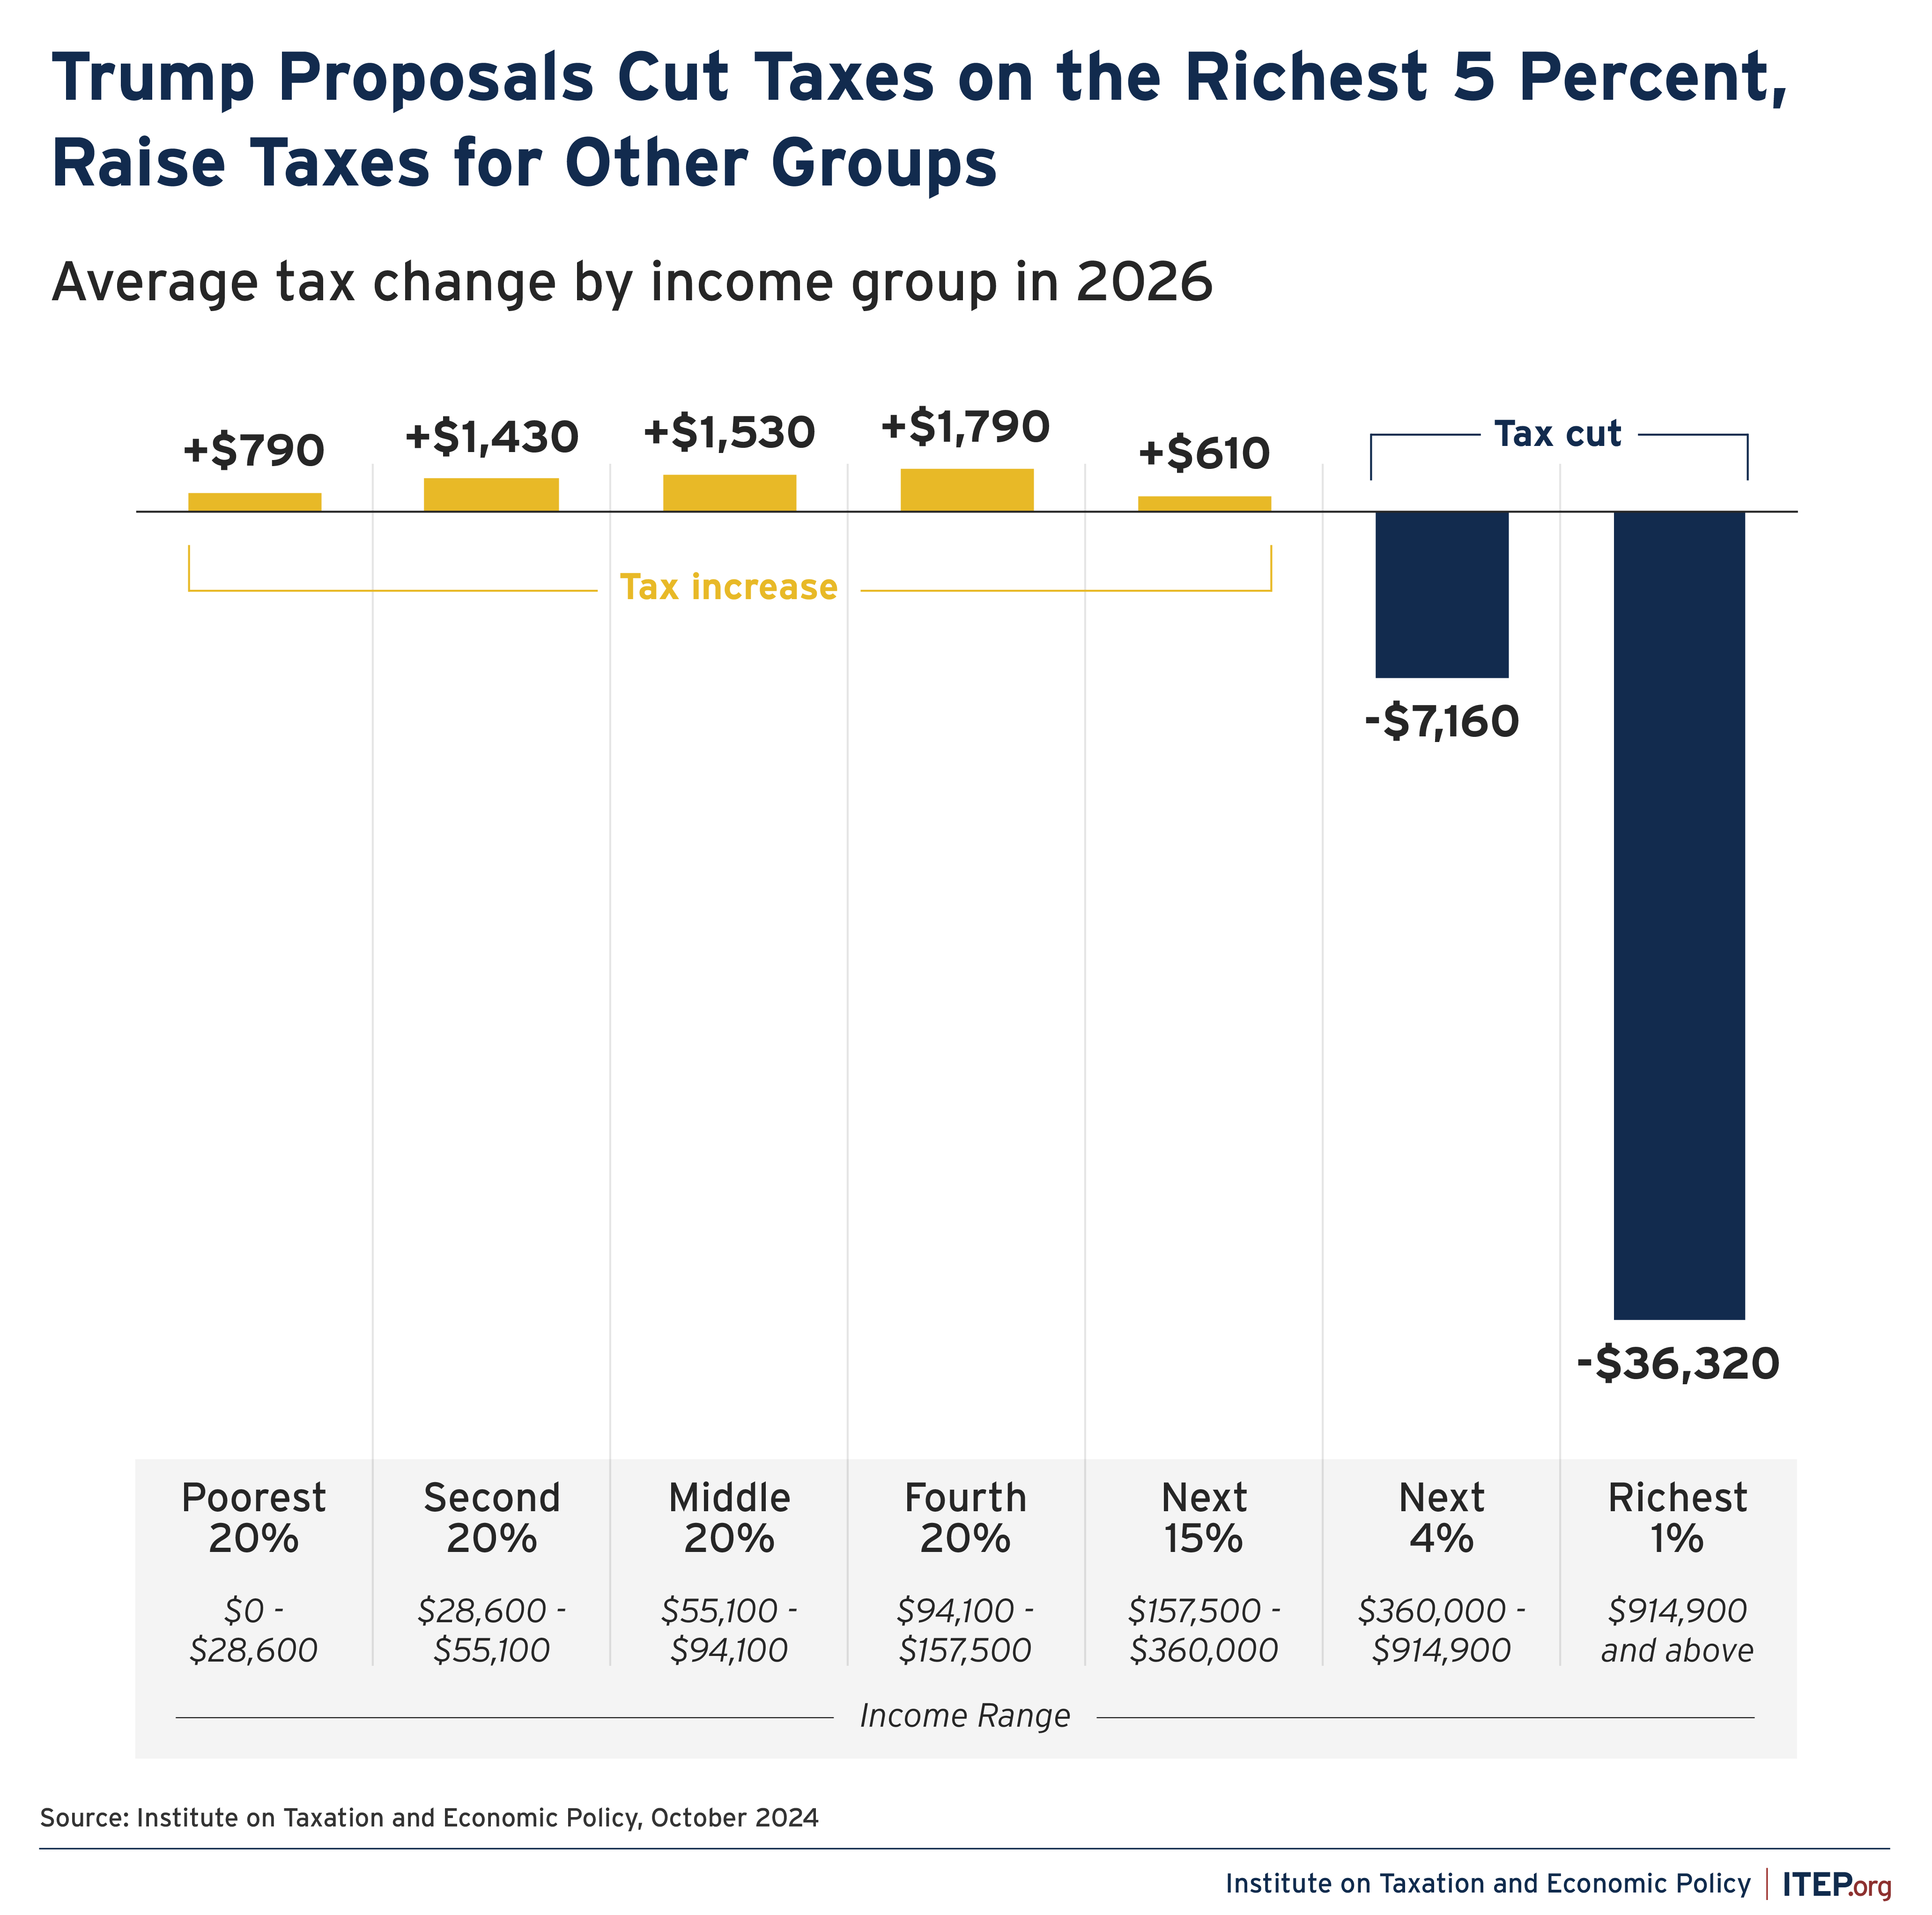
President-elect Donald Trump proposed a wide variety of tax policy changes on the campaign trail this year. We found that these proposals would collectively lead to an average tax cut for the richest 5 percent of Americans and an average tax increase for all other income groups.
Measured as a share of income, the tax increases faced by most Americans would fall hardest on working-class families. You can read more about Trump’s tax plans in our look-ahead to the 2025 federal tax debate.
Corporate Taxes Before and After the Trump Tax Law
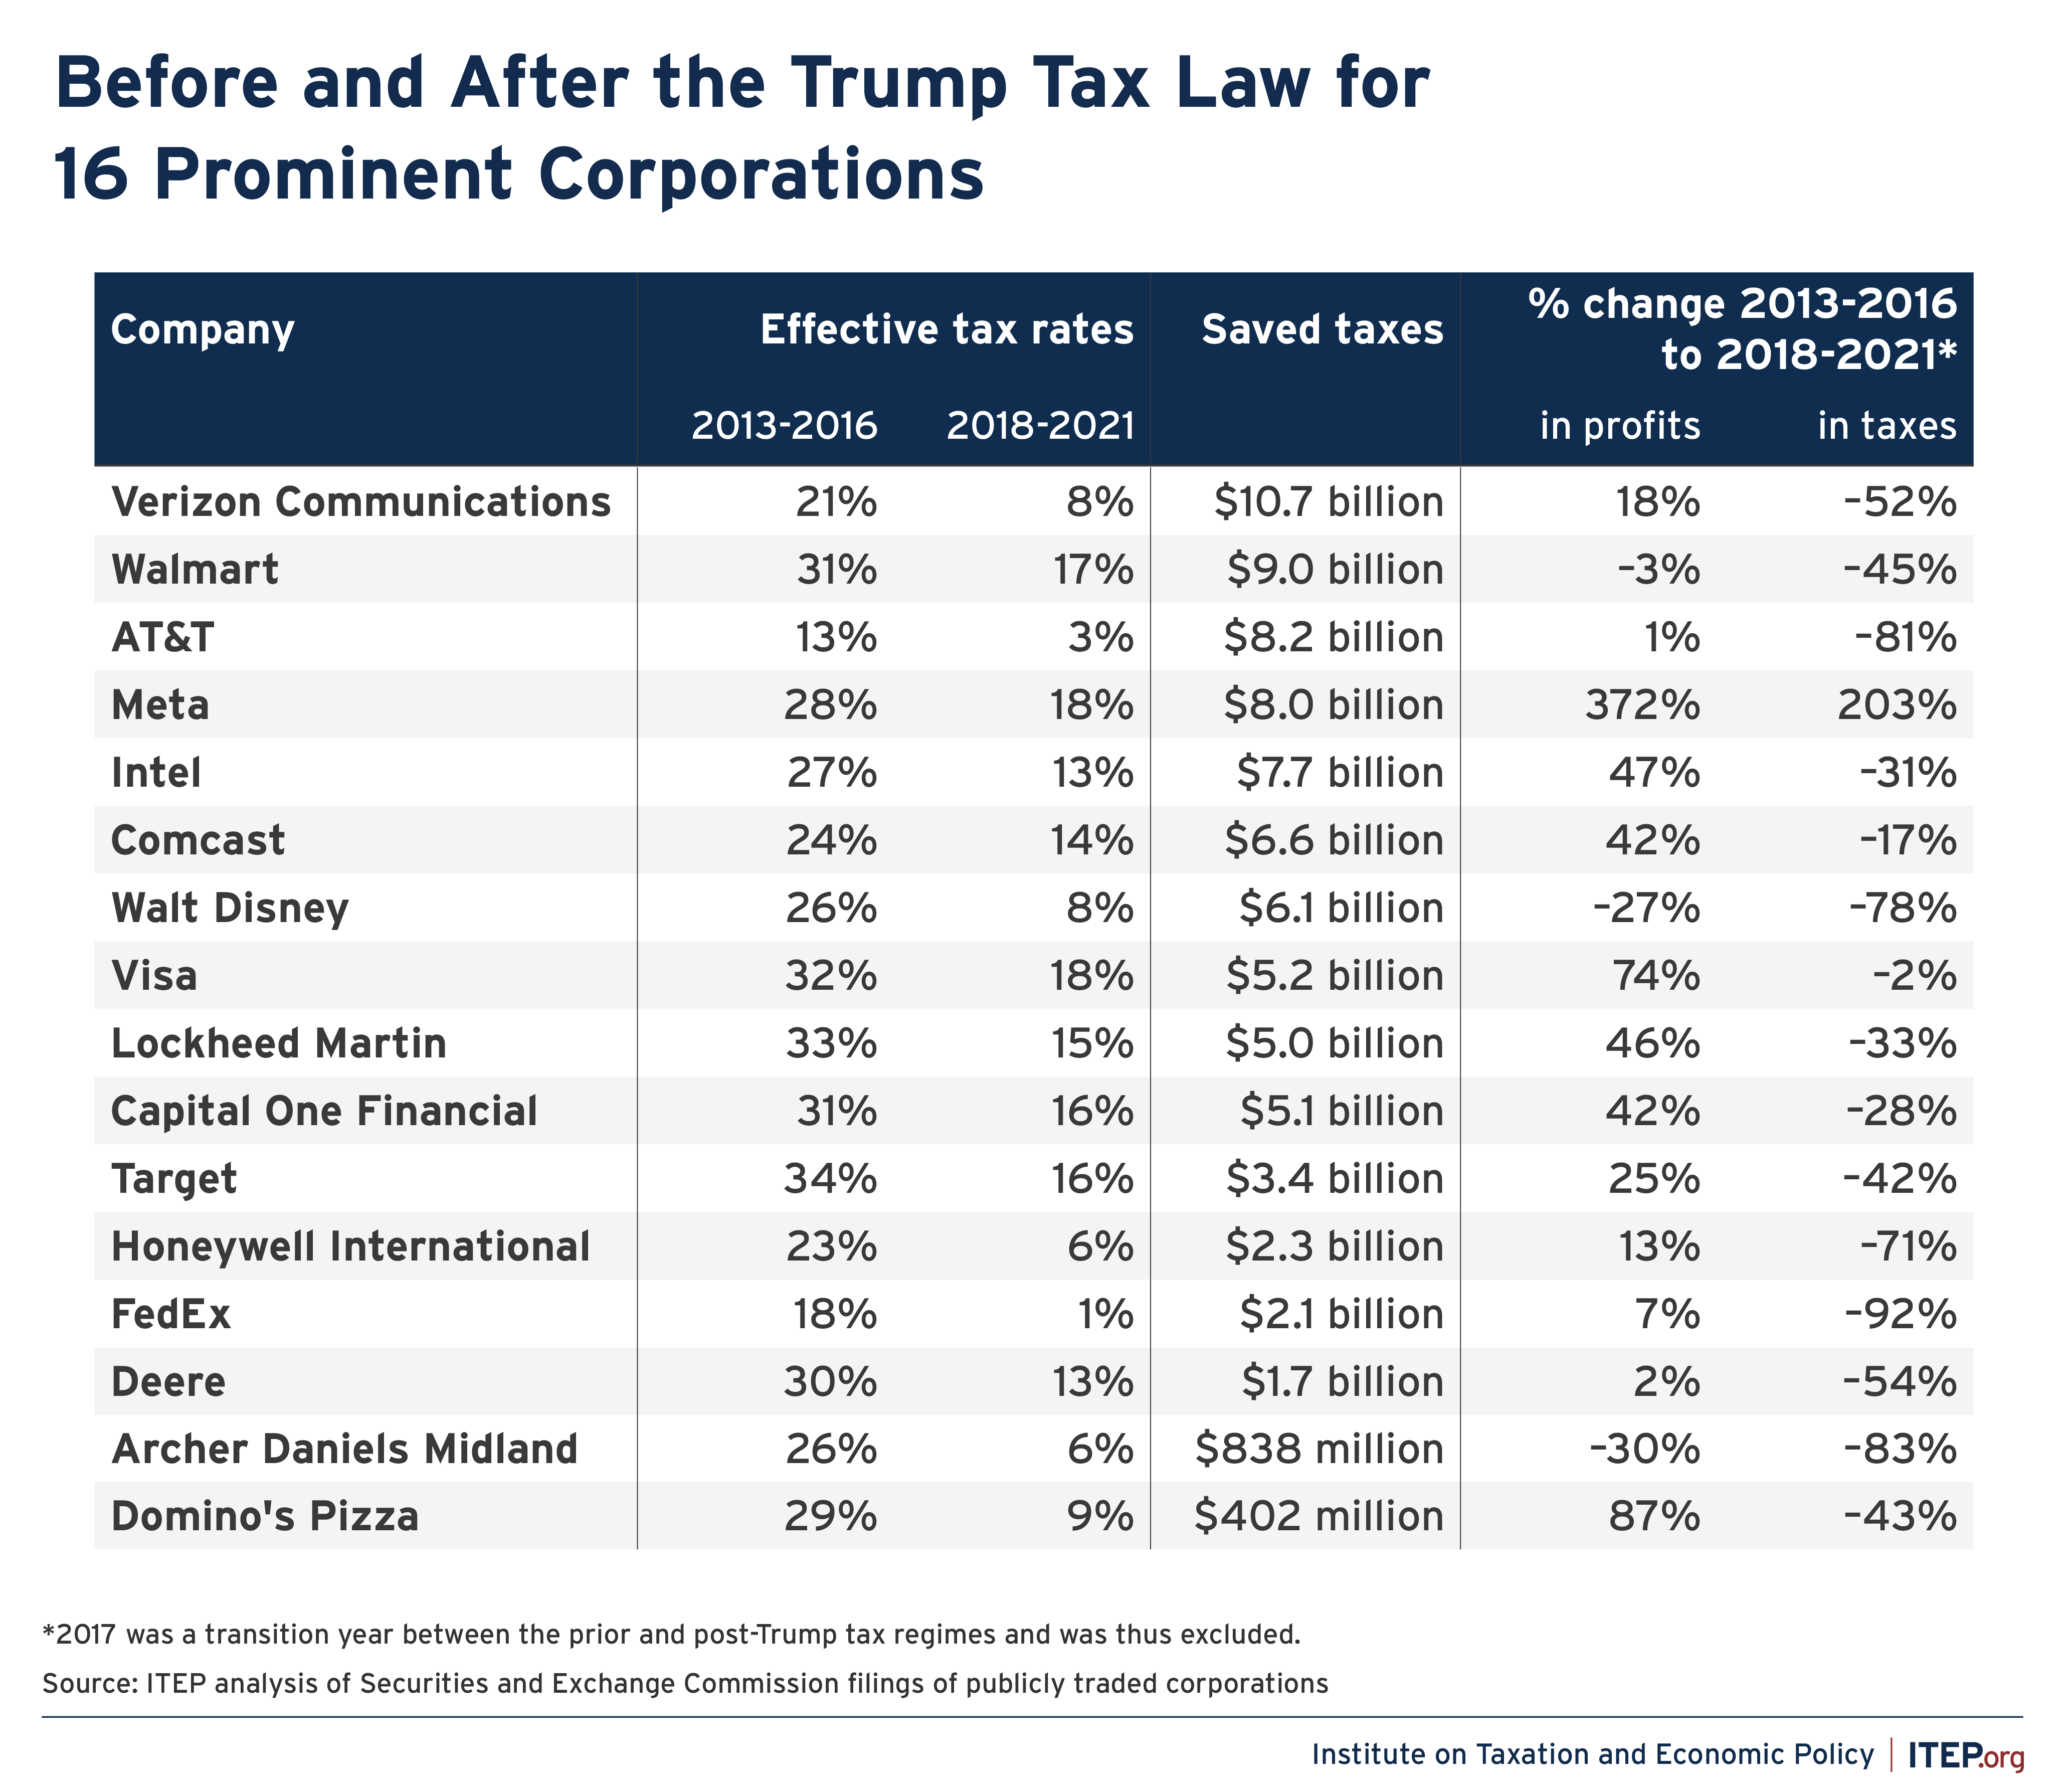
The Trump tax law that took effect in 2018 marked a major victory for corporations. The law lowered the corporate tax rate to 21 percent, and as a result, most of the nation’s largest corporations saw substantial tax reductions.
America’s largest, consistently profitable corporations saw their effective tax rates fall from an average of 22.0 percent to an average of 12.8 percent after the Trump tax law went into effect. While these corporations’ profits rose by 44 percent, their federal tax bills dropped by 16 percent.
We also found that during the first five years after the Trump tax law took effect, 55 profitable corporations paid effective rates of less than 5 percent. That included companies like T-Mobile, DISH Network, Netflix, General Motors, AT&T, Bank of America, Citigroup, FedEx, Molson Coors, Nike, and many others.
Corporate Tax Breaks Contribute to Income and Racial Inequality and Shift Resources to Foreign Investors
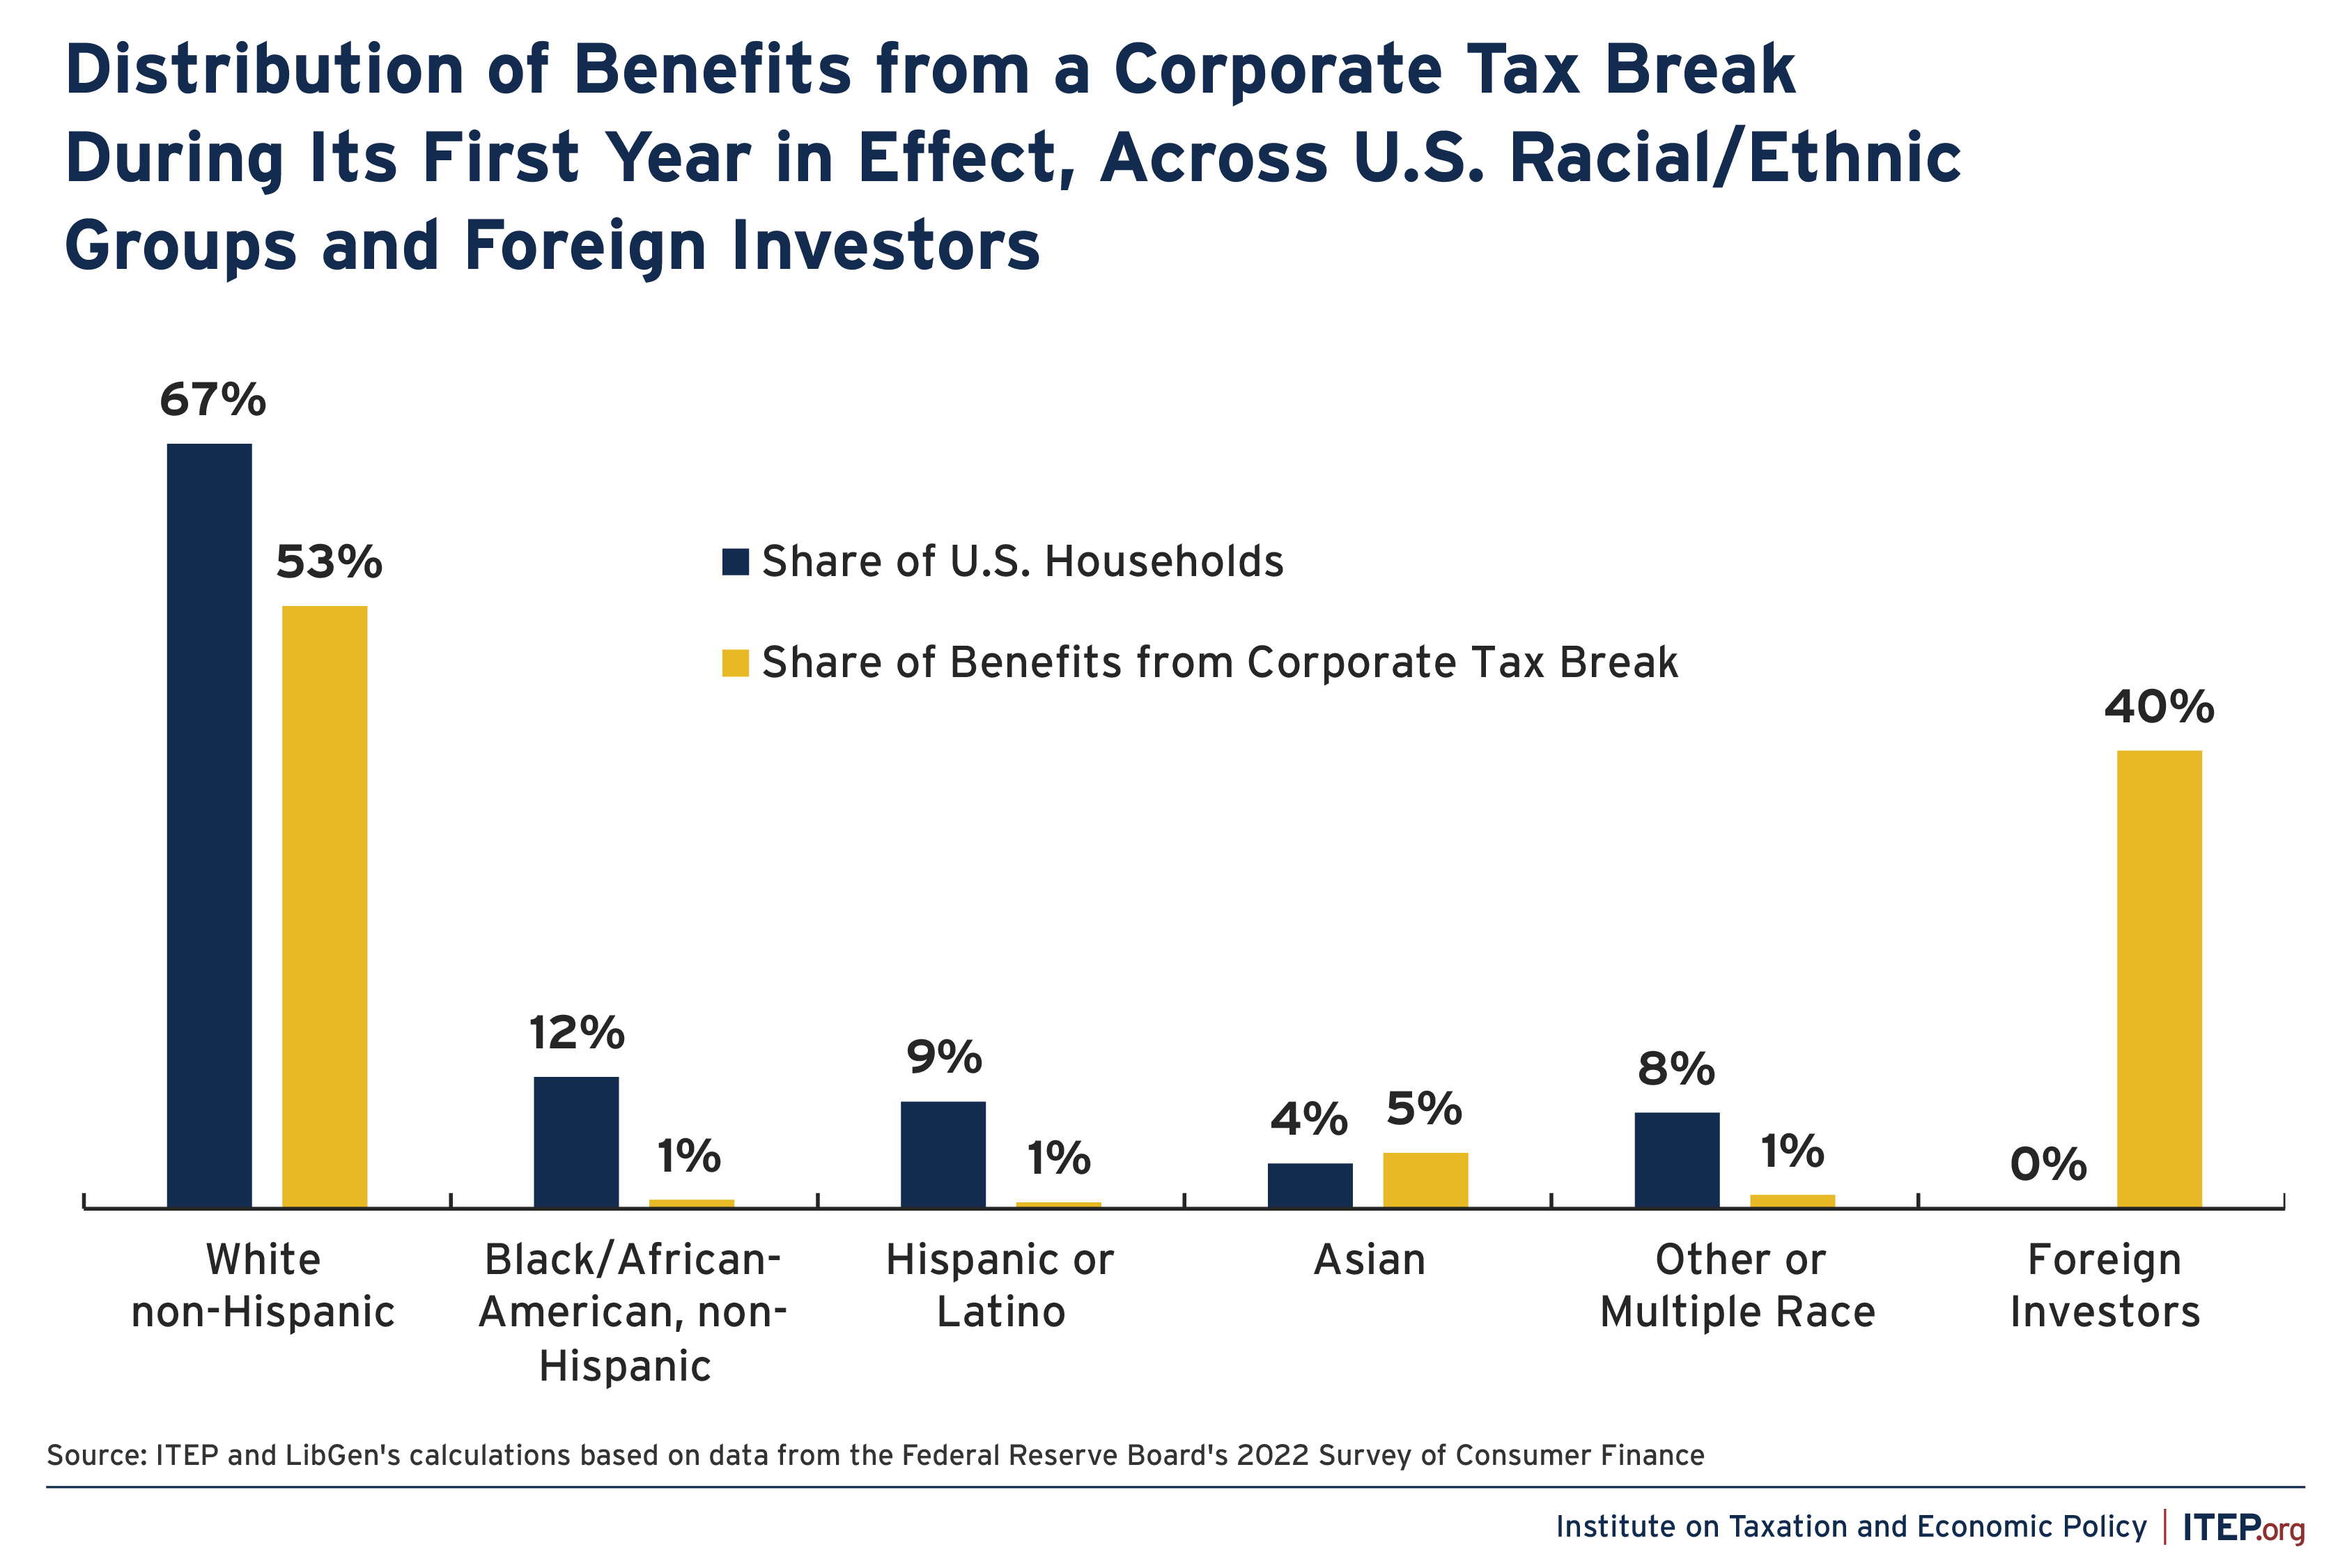
Corporate tax cuts and corporate tax avoidance worsen income inequality. When corporations are allowed to pay less in taxes, the ultimate beneficiaries are mainly white households that own a disproportionate share of corporate stocks.
A huge portion of the corporate tax break benefits also flow to foreign investors. That means Americans overall lose out as a result. When foreign investors are taken into account, the share of benefits flowing to nearly all the major racial/ethnic groups is noticeably below their share of U.S. households.
How Local Governments Raise Revenue
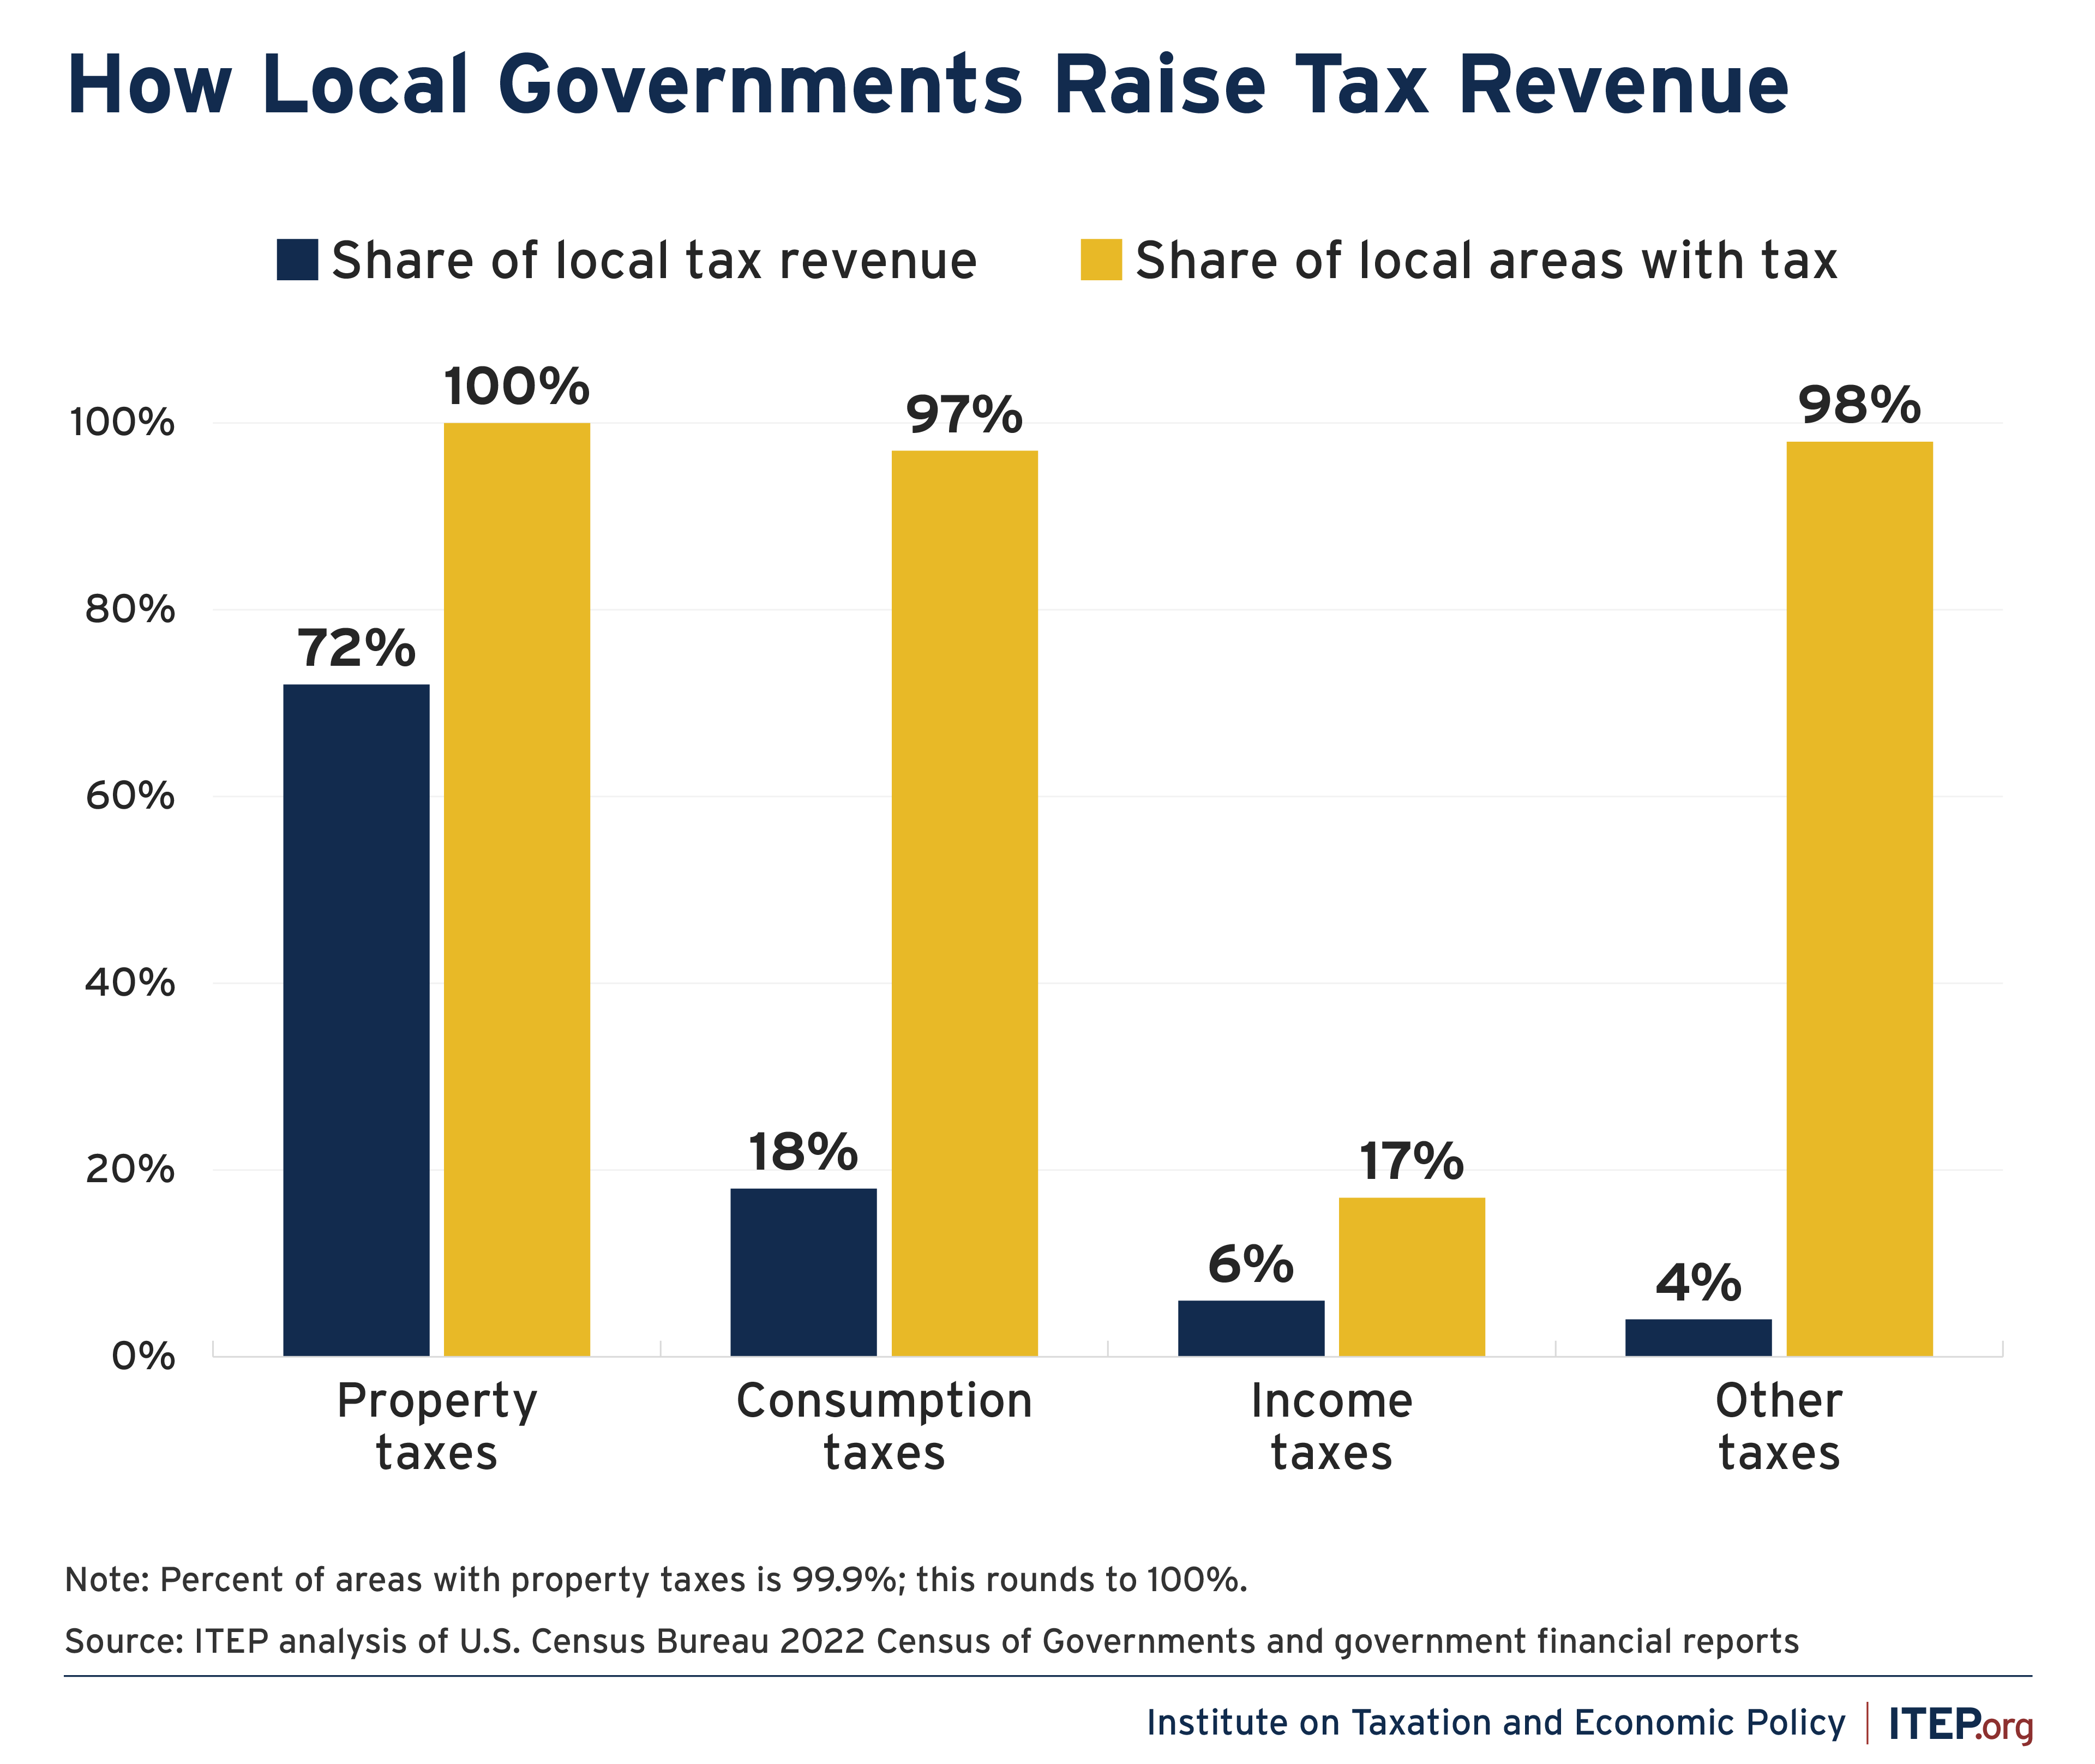
One in seven tax dollars in the U.S.—about $886 billion annually—is levied by local governments in support of education, infrastructure, public health, and other priorities. Three-fourths of this funding comes from property taxes, 18 percent comes from sales and excise taxes, and six percent comes from income taxes.
Property taxes are the dominant local government funding source in nearly all localities, representing the largest tax revenue source in 93 percent of areas. While property taxes and consumption taxes are common, they’re often problematic. Read why and learn more about local funding in your area here.
Keep up with our work in 2025 by signing up for our email lists.

