Who Pays?

California Gov. Gavin Newsom went to Texas recently and claimed: “Texas taxes poor folks more than we tax our richest." He’s right.
Michigan Ballot Proposal Would Boost Public Education While Creating a Fairer Tax System
February 17, 2026 • By Miles Trinidad, Matthew Gardner

A new proposal in Michigan would create a 5-percentage point surcharge on top earners with taxable incomes over $1 million for joint filers and $500,000 for single filers. This would raise about $1.7 billion a year, which would be used for public education priorities.

As we close out 2024, we want to lift up the tax charts we published this year that received the most engagement from readers. Covering federal, state, and local tax work, here are our top charts of 2024.
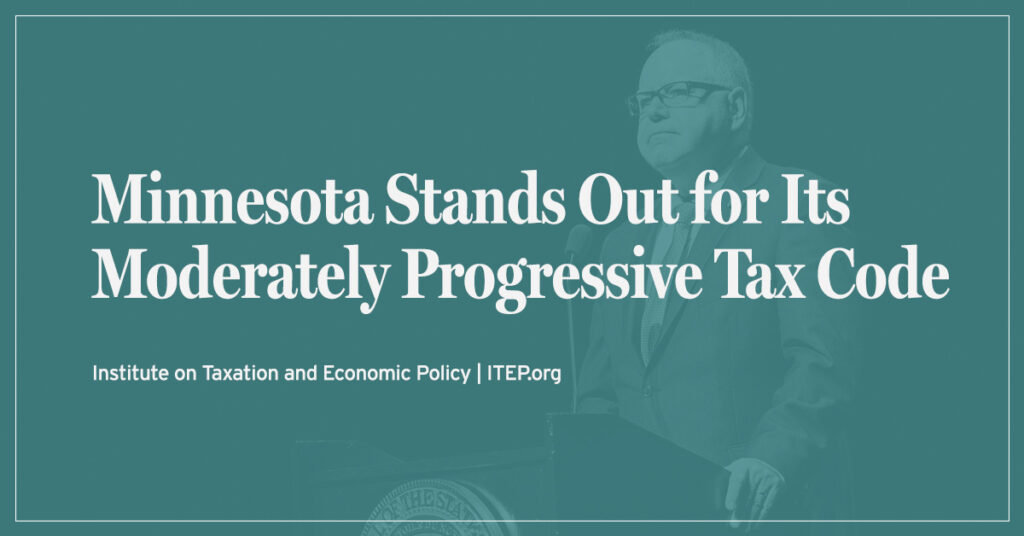
Minnesota stands apart from the rest of the country with a moderately progressive tax system that asks slightly more of the rich than of low- and middle-income families. Recent reforms signed by Gov. Tim Walz have contributed to this reality.
Reality Interrupts the Fever Dream of Income Tax Elimination in Kentucky
June 27, 2024 • By Eli Byerly-Duke

Keeping the Kentucky income tax on a march to zero would mean tax hikes for working families or widespread cuts to education, health care, and other public services. Reversing course is certainly the wiser course of action.
Property Tax Circuit Breakers Can Help States Create More Equitable Tax Codes
June 24, 2024 • By Brakeyshia Samms
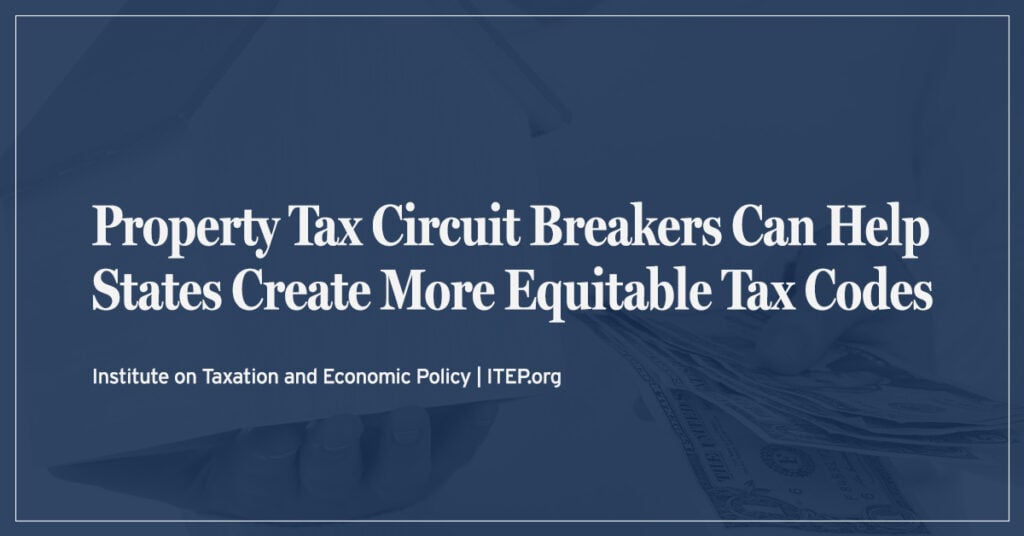
Well-designed property tax circuit breaker programs allow states to reduce the impact that property taxes have on the upside-down tilt of their tax codes.

There are a variety of factors that affect teacher pay. But one often overlooked factor is progressive tax policies that allow states to raise and provide the funding educators and their students deserve.
The Case for More Progressive State and Local Tax Systems, in Charts
April 17, 2024 • By Dylan Grundman O'Neill, Eli Byerly-Duke
In a new chart book, Fairness Matters, we further explore our Who Pays? data with new graphics that reinforce the findings in the main report and demonstrate how state-level tax decisions shape economic divides for better and worse.

Key Findings For families of modest means, California is not a high-tax state. California taxes are close to the national average for families in the bottom 80 percent of the income scale. For the bottom 40 percent of families, California taxes are lower than states like Florida and Texas. The highest earners usually pay higher […]
Fairness Matters: A Chart Book on Who Pays State and Local Taxes
April 11, 2024 • By ITEP Staff
State and local tax codes can do a lot to reduce inequality. But they add to the nation’s growing income inequality problem when they capture a greater share of income from low- or moderate-income taxpayers. These regressive tax codes also result in higher tax rates on communities of color, further worsening racial income and wealth divides.
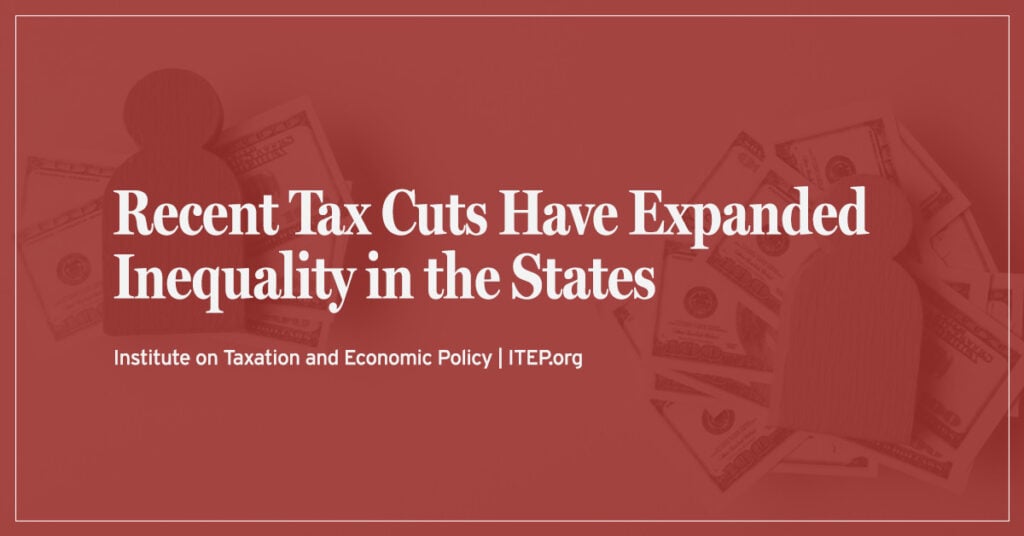
Some states have improved tax equity by raising new revenue from the well-off and creating or expanding refundable tax credits for low- and moderate-income families in recent years. Others, however, have gone the opposite direction, pushing through deep and damaging tax cuts that disproportionately help the rich. Many of these negative developments are quantified in […]
While many state lawmakers have spent the past few years debating deep and damaging tax cuts that disproportionately help the rich, more forward-thinking lawmakers have improved tax equity by raising new revenue from the well-off and creating or expanding refundable tax credits for low- and moderate-income families.
The ‘Low-Tax’ Lie: States Hyped for Low Taxes Usually Only Low-Tax for the Rich
February 20, 2024 • By Jon Whiten
It’s hard to go a week without seeing a politician or a news article hype up a state as the place that everyone is moving to – or should move to – because of low taxes. However, there’s a big problem with these proclamations: they aren’t true.

The findings of Who Pays? go a long way toward explaining why so many states are failing to raise the amount of revenue needed to provide full and robust support for our public schools.
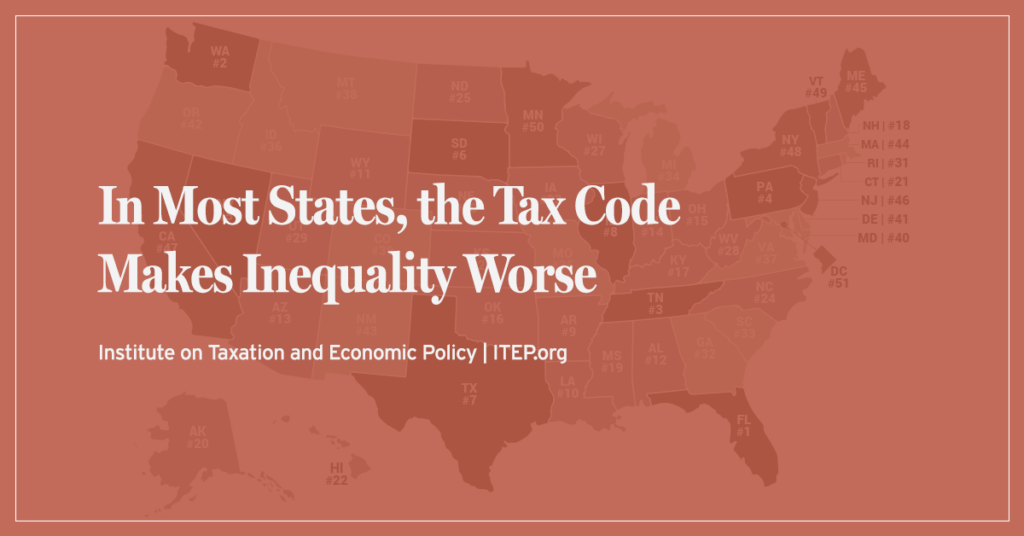
The vast majority of state and local tax systems are upside-down, with the wealthy paying a far lesser share of their income in taxes than low- and middle-income families. Yet a few states have made strides to buck that trend and have tax codes that are somewhat progressive and therefore do not worsen inequality.
U.S. Average: Who Pays? 7th Edition
January 9, 2024 • By ITEP Staff
U. S. Average Download PDF All figures and charts show 2024 state and local tax law, presented at 2023 income levels. These figures depict taxes paid by residents to their home states. Senior taxpayers are excluded for reasons detailed in the methodology. Our analysis includes nearly all (99.7 percent) state and local tax revenue collected […]
Utah: Who Pays? 7th Edition
January 9, 2024 • By ITEP Staff
Utah Download PDF All figures and charts show 2024 tax law in Utah, presented at 2023 income levels. Senior taxpayers are excluded for reasons detailed in the methodology. Our analysis includes nearly all (99.5 percent) state and local tax revenue collected in Utah. State and local tax shares of family income Top 20% Income Group […]
Wyoming: Who Pays? 7th Edition
January 9, 2024 • By ITEP Staff
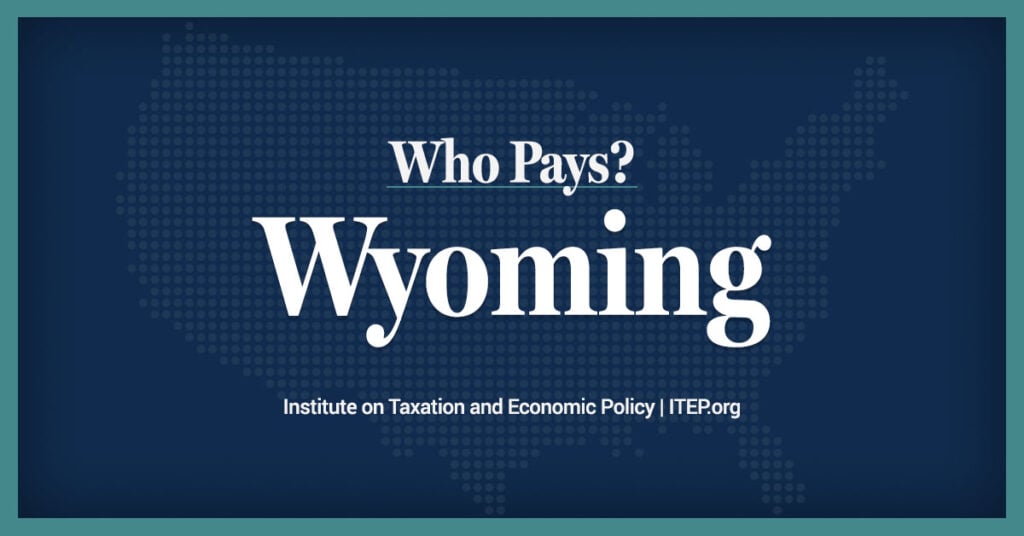
Wyoming Download PDF All figures and charts show 2024 tax law in Wyoming, presented at 2023 income levels. Senior taxpayers are excluded for reasons detailed in the methodology. Our analysis includes nearly all (99.8 percent) state and local tax revenue collected in Wyoming. State and local tax shares of family income Top 20% Income Group […]
Wisconsin: Who Pays? 7th Edition
January 9, 2024 • By ITEP Staff
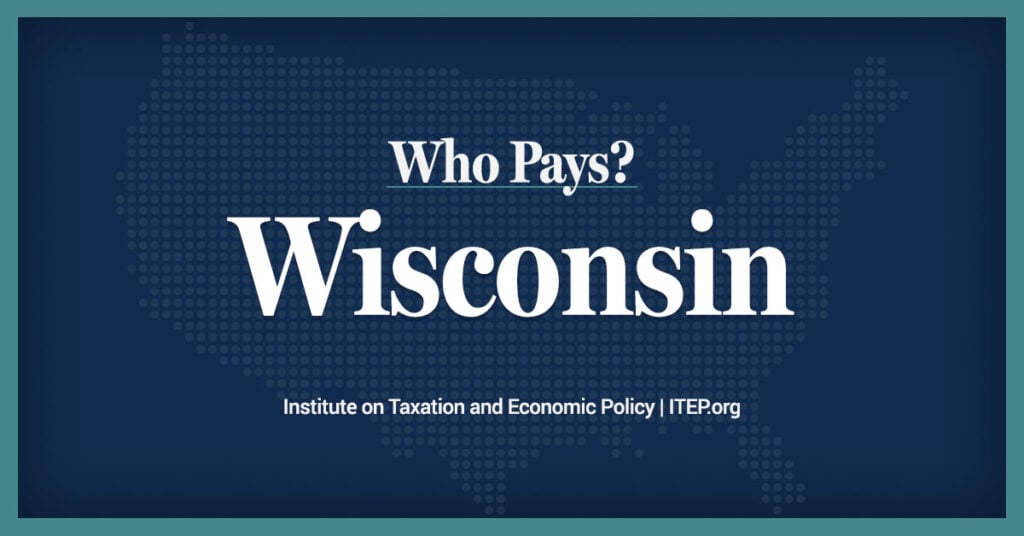
Wisconsin Download PDF All figures and charts show 2024 tax law in Wisconsin, presented at 2023 income levels. Senior taxpayers are excluded for reasons detailed in the methodology. Our analysis includes nearly all (99.4 percent) state and local tax revenue collected in Wisconsin. State and local tax shares of family income Top 20% Income Group […]
West Virginia: Who Pays? 7th Edition
January 9, 2024 • By ITEP Staff
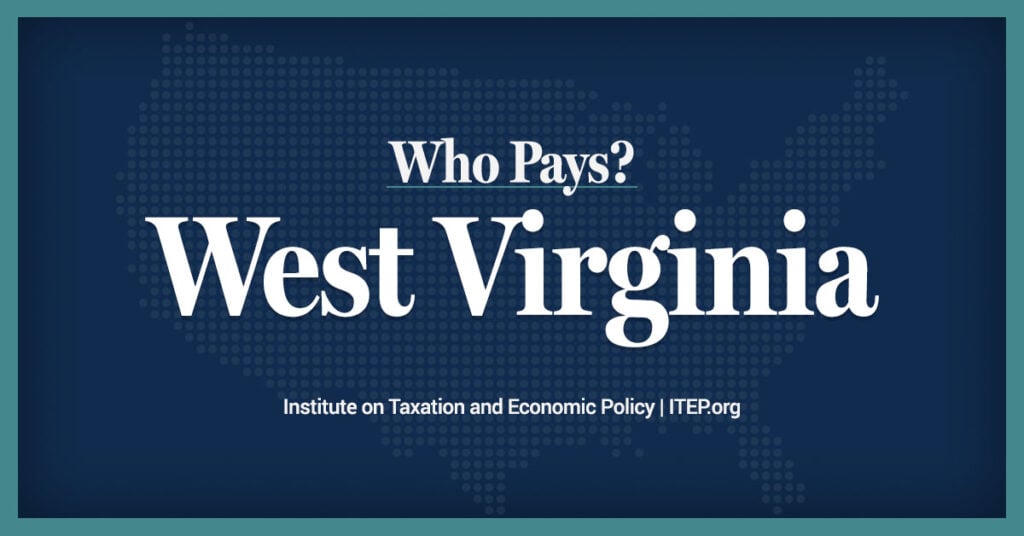
West Virginia Download PDF All figures and charts show 2024 tax law in West Virginia, presented at 2023 income levels. Senior taxpayers are excluded for reasons detailed in the methodology. Our analysis includes nearly all (99.3 percent) state and local tax revenue collected in West Virginia. These figures depict West Virginia’s personal income tax at […]
Virginia: Who Pays? 7th Edition
January 9, 2024 • By ITEP Staff
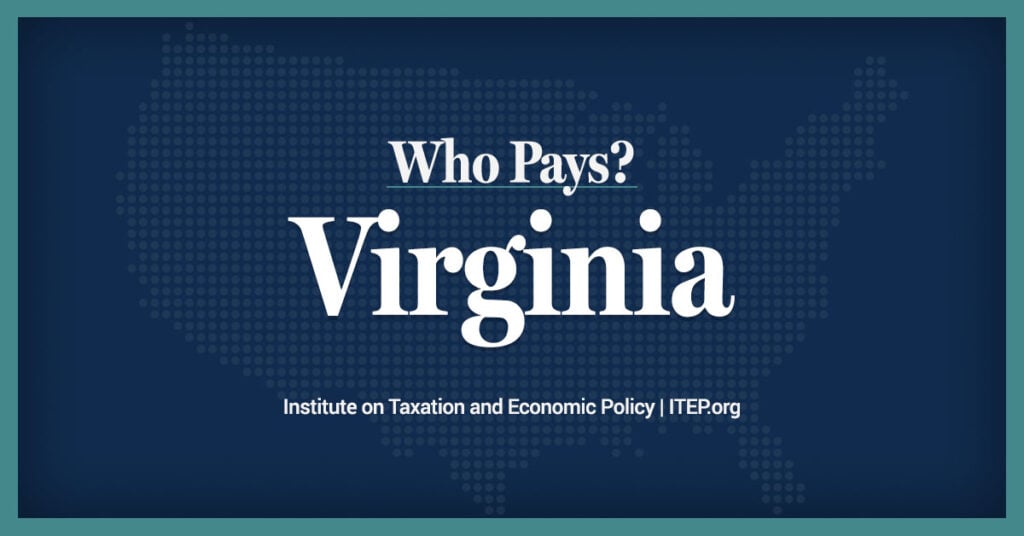
Virginia Download PDF All figures and charts show 2024 tax law in Virginia, presented at 2023 income levels. Senior taxpayers are excluded for reasons detailed in the methodology. Our analysis includes nearly all (98.8 percent) state and local tax revenue collected in Virginia. These figures depict Virginia’s standard deduction at its 2024 levels of $8,500 […]
Washington: Who Pays? 7th Edition
January 9, 2024 • By ITEP Staff
Washington Download PDF All figures and charts show 2024 tax law in Washington, presented at 2023 income levels. Senior taxpayers are excluded for reasons detailed in the methodology. Our analysis includes nearly all (99.3 percent) state and local tax revenue collected in Washington. As seen in Appendix D, the state’s new Working Families Tax Credit […]
Vermont: Who Pays? 7th Edition
January 9, 2024 • By ITEP Staff
Vermont Download PDF All figures and charts show 2024 tax law in Vermont, presented at 2023 income levels. Senior taxpayers are excluded for reasons detailed in the methodology. Our analysis includes nearly all (99.7 percent) state and local tax revenue collected in Vermont. State and local tax shares of family income Top 20% Income Group […]
Tennessee: Who Pays? 7th Edition
January 9, 2024 • By ITEP Staff
Tennessee Download PDF All figures and charts show 2024 tax law in Tennessee, presented at 2023 income levels. Senior taxpayers are excluded for reasons detailed in the methodology. Our analysis includes nearly all (99.3 percent) state and local tax revenue collected in Tennessee. State and local tax shares of family income Top 20% Income Group […]
Texas: Who Pays? 7th Edition
January 9, 2024 • By ITEP Staff
Texas Download PDF All figures and charts show 2024 tax law in Texas, presented at 2023 income levels. Senior taxpayers are excluded for reasons detailed in the methodology. Our analysis includes nearly all (99.5 percent) state and local tax revenue collected in Texas. State and local tax shares of family income Top 20% Income Group […]

Institute on Taxation
and Economic Policy
ITEP is a non-profit, non-partisan tax policy organization. We conduct rigorous analyses of tax and economic proposals and provide data-driven recommendations to shape equitable and sustainable tax systems.
Subscribe to ITEP Emails
Tax research and policy news in your inbox.
Promote Fair Tax Policy
Your gift to ITEP promotes tax justice. With your help, we do research that supports taxing millionaires and billionaires, taxing big corporations and raising revenue for the things our people, our communities and our planet need.
Together, we can create a country with more economic justice, more racial justice, more climate justice… and more tax justice.