This report was authored by Ryan Vinh, Kamolika Das, Sophie Collyer, Aidan Davis, David Harris, Galen Hendricks, Rita Jefferson, Yajun Jia, Danielle Wilson, and Christopher Wimer. The analyses were conducted by the Center on Poverty and Social Policy at Columbia University and the Institute on Taxation and Economic Policy, with support from Share Our Strength.
Key Findings
-
Child poverty rates in cities across the country sit well above the national average. In the 14 cities selected for this study, 10 have child poverty rates exceeding 15 percent and six have child poverty rates above 20 percent, even after accounting for the role of federal and state Child Tax Credits in reducing poverty.
-
Local governments can create their own Child Tax Credits to supplement the poverty-reducing effects of federal and state credits and meaningfully reduce child poverty in their cities.
-
With the exception of Los Angeles and Oakland, a base credit of $1,000 or less would be sufficient to reduce child poverty by 25 percent across the remaining localities in this study.
-
In 10 of these 14 cities, a credit that would reduce poverty by 25 percent when combined with federal and state credits costs less than 3 percent of the city’s revenues. In most of the cities examined, costs for achieving a 50 percent poverty reduction are less than 15 percent of the city’s governmental revenues, and in three of those cities, the total cost is 5 percent or less.
-
With a local Child Tax Credit of ~$4,000 per child or less, 12 of 14 localities in this study could cut child poverty by 50 percent through the combined effects of federal, state, and local credits. In seven of the cities, the same reduction could be achieved with a credit of ~$3,000 per child or less.
-
Local costs for achieving a 50 or 25 percent poverty reduction are much lower for cities in states with robust state Child Tax Credits, such as Minnesota. For example, it would cost Minneapolis less than $30 million to cut its baseline poverty levels by half when accounting for state and federal credits.
-
Similarly, the local costs of achieving a 50 percent poverty reduction would be markedly lower if the federal Child Tax Credit was expanded as it was in 2021, and if children in lower- and moderate-income families were eligible for the full increased federal credit.
Poverty reductions of the type that could be achieved with the policies suggested in this paper would transform the lives of families with children in American cities.
Introduction
After falling to a record low of 5.2 percent in 2021, child poverty has since surged back to pre-pandemic levels, reaching 13.4 percent in 2024.1 Child poverty hit its record low in 2021 due to concerted policy choices, namely the expansion of the Child Tax Credit, Economic Impact Payments, and other pandemic-related income supports. As these income supports expired, however, high levels of child poverty reemerged.
As proven in 2021, high levels of child poverty are preventable. Federal and state policies continue to reduce child poverty, but there is more that could be done. Since the expiration of the federal Child Tax Credit expansion in 2022, many states have expanded or created their own credits to help parents afford the costs of raising children. Fifteen states currently provide Child Tax Credits. These vary widely in their design and reach, but they all embody a commitment to helping families with children through the tax code.2,3
Yet the combination of existing federal and state credits only do so much to reduce child poverty and help families with their costs of living. Local governments can build on federal and state policy, driving more substantial reductions in child poverty.4 To date, no city has implemented its own Child Tax Credit. This report documents how local credits could further reduce child poverty and enhance families’ economic security.
Our results suggest that complementing federal and state programs with local Child Tax Credits could substantially reduce child poverty. The options examined in this report also provide the largest gains (as a share of income) to families at the bottom of the income scale, with the bulk of the benefit going to families in the bottom 80 percent of the income distribution in each city (for details, see Appendix Tables A5 and A8). This would lessen existing inequities in state and local tax systems, which are by and large regressive.5
Local governments have a track record of implementing ambitious policies that support economic well-being. Cities have been early adopters of stronger minimum wage ordinances, paid sick leave programs, guaranteed income pilots, and universal preschool. Local policy efforts also often become models for broader state and federal investments that build on local successes, and local governments that establish Child Tax Credits could continue this tradition.6
In this report, we use data from 14 cities to show how local Child Tax Credits could augment federal and state efforts to reduce child poverty and help families with the costs of raising children. Specifically, we provide the size of local child credit needed to cut child poverty by 25 percent and 50 percent when combined with federal and state Child Tax Credits.
Study Overview
We illustrate the promise of local Child Tax Credits by analyzing their potential effects on child poverty and revenues in 14 select cities:
| 1. Baltimore, Maryland | 8. Minneapolis, Minnesota |
| 2. Charlotte, North Carolina | 9. New York, New York |
| 3. Chicago, Illinois | 10. Oakland, California |
| 4. Denver, Colorado | 11. Philadelphia, Pennsylvania |
| 5. Houston, Texas | 12. Phoenix, Arizona |
| 6. Jacksonville, Florida | 13. Seattle, Washington |
| 7. Los Angeles, California | 14. Washington, D.C. |
Figure 1
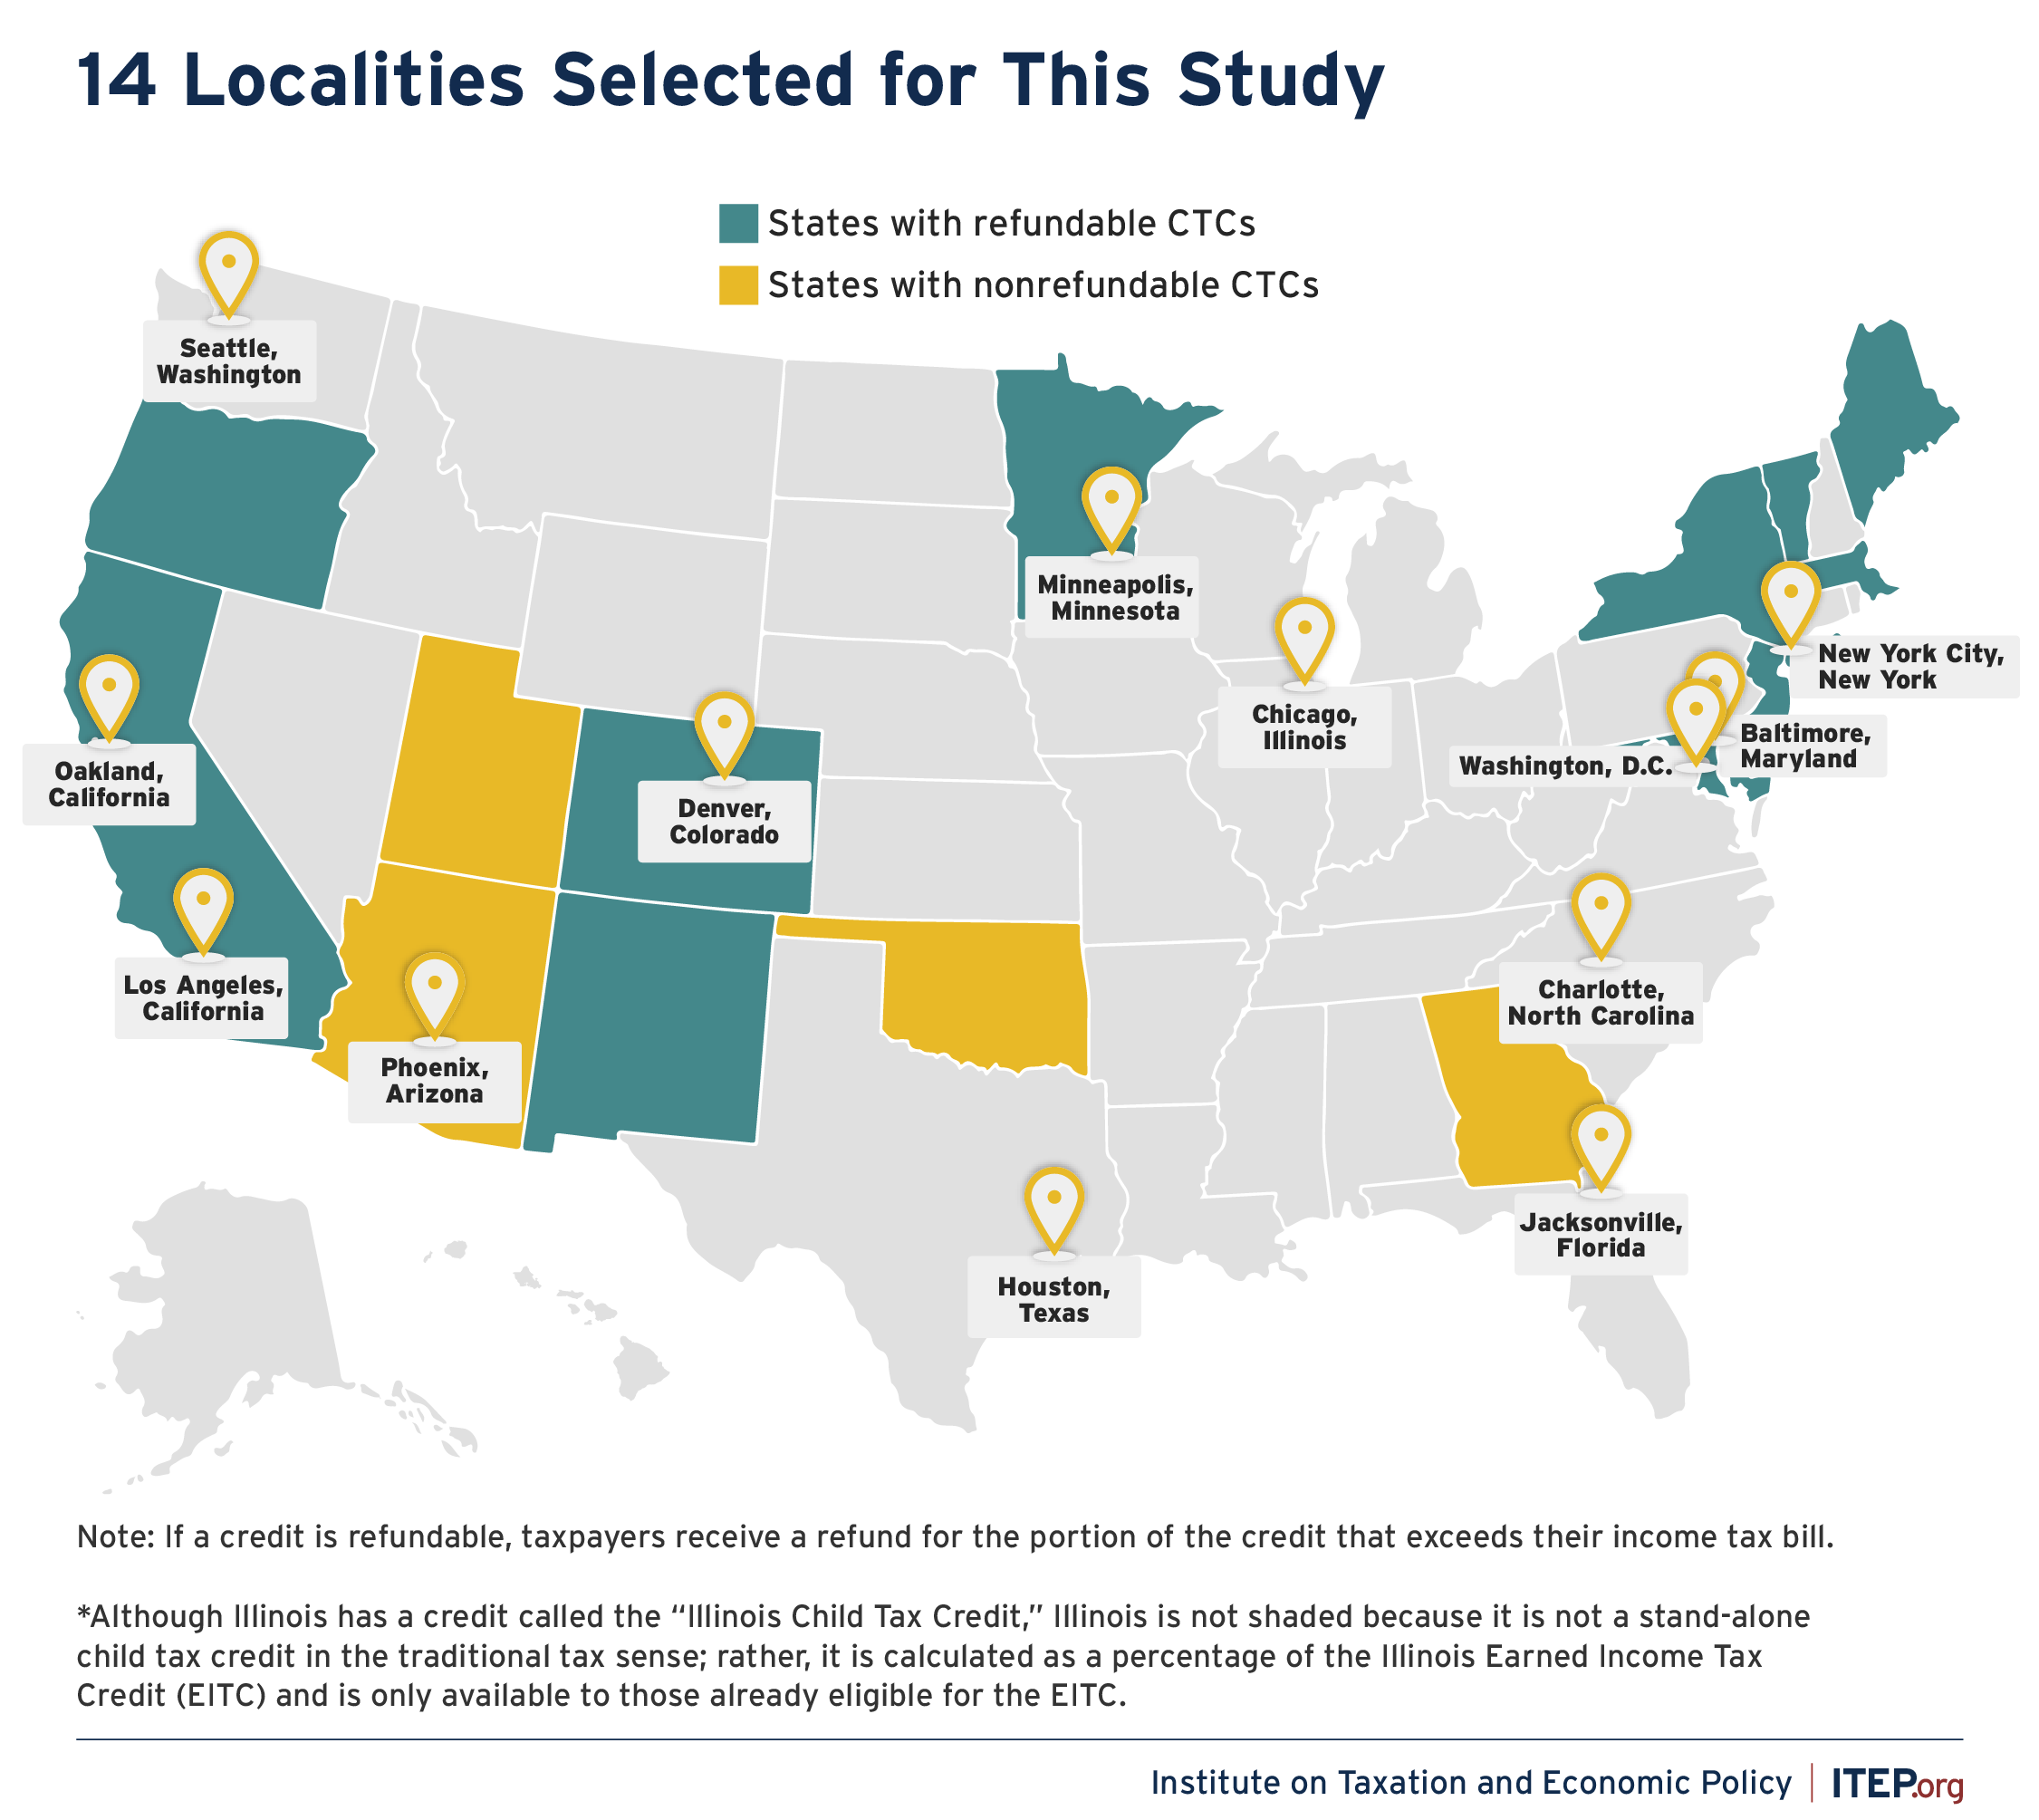
We selected cities with the largest populations and then focused on the 14 that also have sufficient data on income and poverty in the U.S. Census Bureau’s American Community Survey (ACS) research files. These files include poverty status measured using the Supplemental Poverty Measure (SPM).7 Cities were excluded for insufficient sample size because poverty rates did not benchmark well against other data sources, or because their political boundaries were difficult to reconcile with Census data.8 We also sought geographic diversity across the country.
Any city or locality could design its own child credit, not just those highlighted here. We model what it would take for a local credit to achieve a 25 or 50 percent reduction in child poverty. There are two ways to think about how a city could hit such targets.
- The first involves reducing the child poverty rate after the federal and any state credits achieve whatever poverty reduction that they do. In other words, the baseline poverty rate that we aim to cut in half is the current poverty rate after accounting for federal and state credits. Using this baseline, we find the local credit amount that cuts the poverty rate in half on its own.
- The second involves thinking of a local credit as supplementing the poverty reduction that the federal and any state credits already achieve. In other words, the baseline poverty rate that we aim to cut in half is the poverty rate before any federal or state Child Tax Credits are accounted for. Here, we identify the local credit amount that cuts the child poverty rate by half when combined with existing federal and state credits.
The main results we present here use the latter thought experiment, conceiving of a local credit as a supplement to federal and state policy. In Appendix A we provide results following the first thought experiment listed above, showing the credit values and costs that would achieve child poverty reduction targets from a local credit alone. Costs and credit amounts under the first thought experiment would be substantially higher than those under the second thought experiment because poverty reduction effects in this case are solely attributable to the local credit. Given the interplay between federal, state, and local policies, however, we present costs and credit amounts under the second thought experiment in the main sections of this report.
How Cities Could Administer a Local CTC
Localities with their own or a state-level income tax system already have the infrastructure in place to administer a local Child Tax Credit. These systems allow cities and counties to coordinate with state agencies, streamline delivery, and minimize administrative barriers. New York City, for example, provides a strong model: its Earned Income Credit is integrated into the annual tax filing process, making it accessible for residents who pay city income tax and have claimed the federal and state EITCs. The city also partners with the IRS to identify residents who appear eligible for the credit but have not claimed it, contact these residents, and send them pre-filled amended tax return forms that can be submitted to claim the local, state, and federal EITCs. Where state Child Tax Credits already exist, local governments can similarly partner with state systems to automatically deposit credits.
While not all localities have access to such infrastructure, they can draw lessons from other programs that have successfully delivered direct cash payments. For example, Cambridge, Massachusetts, and Chicago, Illinois, used American Rescue Plan Act (ARPA) funds to launch guaranteed income pilots by partnering with community organizations and public benefit corporations. These efforts show that even without tax-based systems, cities and counties can build effective programs by creating standalone application portals, leveraging IRS data-sharing agreements, and partnering with community-based organizations, third-party administrators, or regional service providers.
Regardless of the credit’s delivery mechanism (i.e., through the state’s tax infrastructure or other means), outreach is critical to ensuring that all eligible families receive a credit. Many eligible families may not file taxes or may distrust government. Proactive, multilingual, community-based strategies are essential to ensure these families receive the credit.
Policy Design
Local Child Tax Credits, like Child Tax Credits at the state level9, that are most effective at reducing child poverty and inequality are guided by the following principles:
- Full Refundability: Children in families with no or low earnings are eligible for the full credit.
- Per-Child Benefits: The full credit is made available to children regardless of family size or where they come in the birth order.
- Indexed to Inflation: The value of the credit is indexed to inflation so as not to erode the credit over time.
- Young Child Bonus: A larger credit to children under age 6 is provided to target additional resources at a critical period of child development when the costs of raising children are often higher.
- Monthly Payments: The credit is delivered in regular installments, rather than a once-per-year lump sum.
- Income Phaseouts: The same full credit is available to children in low- and middle-income families. Weigh tradeoffs when considering if and when to phase out the credit for higher earning families.
- Inclusivity: Ideally, children are included in credit eligibility regardless of immigration status. However, caution should be used given recent drastic shifts in policy that have fundamentally changed the nature of immigrants’ relationship with the tax code and tax filing.10
Each design choice has different implications for both costs and anti-poverty potential. Past research has demonstrated that Child Tax Credits that are fully refundable, inclusive of a wide range of recipients, and that provide families with large credit amounts have the highest potential to reduce child poverty.11 A universal Child Tax Credit would help the most children and be administratively efficient, but of course it would be more costly. If revenues don’t allow for that broad of a credit, lawmakers can raise more revenue or target the credit more carefully.
In the context of these competing budgetary priorities, lawmakers can consider a number of options to reduce costs while still making a dent in poverty. For example, localities can adjust the income level at which the credit begins to phase out. Setting a lower income threshold would leave out middle- or higher-income families, but would allow lawmakers to target resources towards families with the lowest incomes. Local credits can also be limited to children under 6 given the importance of early childhood development and the higher costs of raising younger children (e.g., child care).12 And, of course, localities can begin with smaller credits. Future expansions can follow naturally from these design choices, as lawmakers can increase the size of the credits, or raise phaseout thresholds or the age of eligibility to expand access.
Given these tensions between cost and efficacy, we present results under two different design scenarios:
- More universal approach: The credit begins to phase out when incomes rise above $110,000 for joint filers and $75,000 for heads of household at a rate of 5 percent per dollar of income above these thresholds.13
- More targeted approach: The credit phases out at a relatively low level of income and at a higher rate – specifically, one that mirrors the structure of the federal EITC for families with three or more dependents. Under this structure, the credit would begin to phase out at a rate of 21.06 percent at the point where families with three or more dependents are no longer eligible for the federal EITC ($61,555 for heads of household and $68,675 for joint filers in tax year 2025). This results in a more targeted credit that would still provide a full local Child Tax Credit to children in the lowest-income households.
Under both credit designs, we also provide a 20 percent bonus in the credit amount for children under the age of 6. In this report, we provide estimates of the local Child Tax Credit values necessary for achieving 25 percent and 50 percent reductions in local child poverty under both design options.
Overview of Federal Child Tax Credits
Since its establishment in 1997, the federal Child Tax Credit has played an increasingly important role in reducing child poverty and helping families with the costs of raising children.14 Several recent changes to the federal Child Tax Credit have highlighted important design features and their role in either increasing or reducing its antipoverty potential. Before the 2017 tax law was enacted, the maximum credit was $1,000. The refundable portion, which is the part that benefits working low-income people who pay federal payroll taxes but do not earn enough to owe federal income tax, was restricted to a percentage of earnings above a set threshold. This generally meant that low-wage workers with children, the people who needed it the most, usually could not receive the full credit.
The 2017 tax law increased the maximum credit from $1,000 to $2,000. This made it much more effective at boosting income for the families who were eligible for the full credit. However, many children in the most financially vulnerable families were excluded from the full credit. Policymakers capped the refundable part of the credit below the full $2,000 that other families could get and retained an earnings requirement, limiting the credit for those who needed it most. As a result of these two limits, one-third of children were ineligible for the full credit when the law was passed because their family’s income was too low.15 The 2017 law also barred children without Social Security numbers from receiving the credit.
The temporary expansion to the federal Child Tax Credit under the 2021 American Rescue Plan Act (ARPA) boosted credit amounts substantially and made the full credit available to families with the lowest incomes. This played a significant role in the child poverty rate falling to a record low of 5.2 percent in 2021.16,17
With the expiration of the expanded Child Tax Credit in 2022, the federal credit reverted to its current structure based on parameters set in the 2017 tax law. Recent research has found that one in four children under the age of 17 were ineligible for the full credit in 2023 because their family income was too low.18
With the 2017 tax law set to expire at the end of 2025, a flurry of proposals that would modify the federal Child Tax Credit were put forth in the months leading up to the passage of the tax and spending bill – also known as OBBBA19 – that was signed into law on July 4. OBBBA increases the maximum credit amount from $2,000 to $2,200, but keeps the refundable portion of the credit capped (at $1,700 in 2025), though both maximum credit values are permanently indexed to inflation. OBBBA also makes permanent the credit’s earnings requirement. As a result, the one in four children previously ineligible for the full credit because their family income was not high enough to qualify fully – totaling 17 million children nationally – see no gain in their Child Tax Credit under the new law. Further, 2 million children in moderate-income families only partially benefit from the credit increase because their family income is too low to qualify for the full benefit.20 In addition, OBBBA makes permanent the ban on children receiving the credit if they do not have a Social Security number and expands that restriction by requiring children to have at least one parent or guardian with a Social Security number as well.21
These changes to the federal Child Tax Credit will take effect immediately, meaning these rules will govern families’ credits when filing their 2025 federal income taxes in the spring of 2026 (based on their 2025 income). In Figure 1, we show the Child Tax Credit that a married, joint-filing family with two children will qualify for in 2025 based on the new law versus previous law.
Figure 2
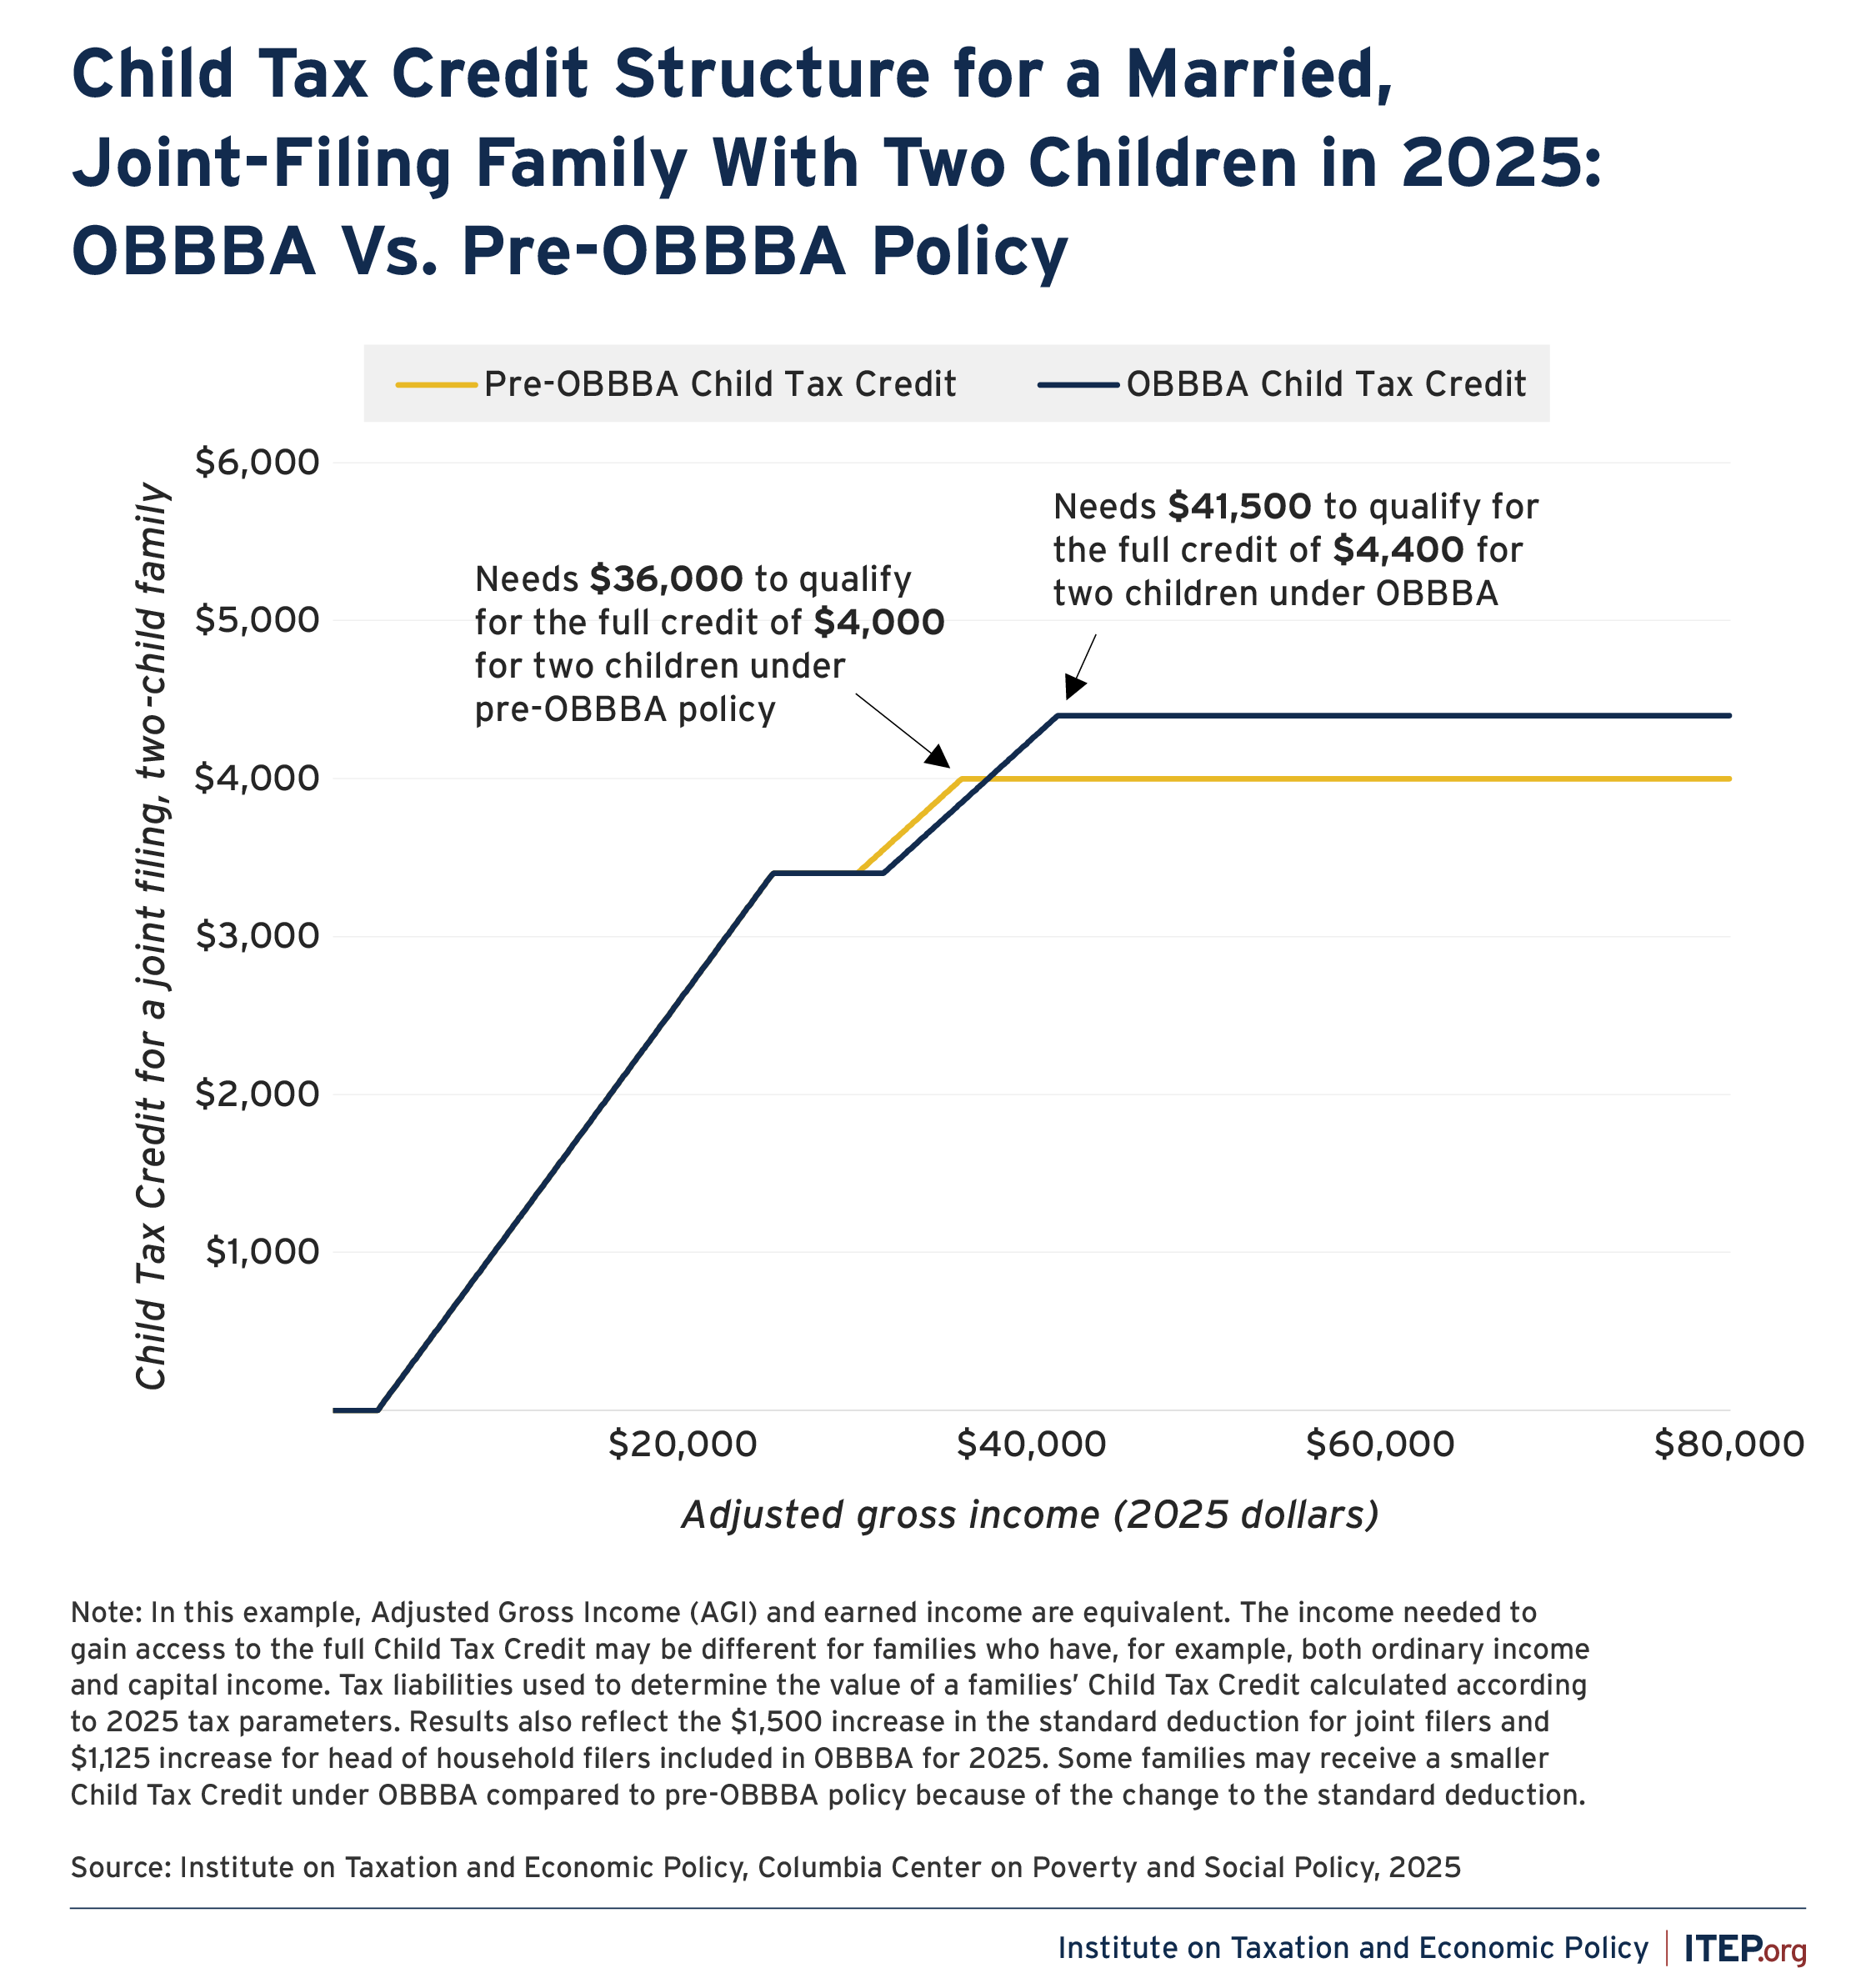
Under OBBBA, this new Child Tax Credit structure will be implemented at the same time that cuts to other programs including SNAP and Medicaid take effect. For many families, these cuts will undermine and vastly exceed any gains from the modest Child Tax Credit expansion described above.22 Because the federal credit will retain the same earnings requirements and refundability structure, the families with the lowest incomes will continue to be ineligible for the full credit under the new law. Overall, more than one in four children will be ineligible for the full credit because their family income is not high enough for them to qualify fully.23
Overview of State Child Tax Credits
States are increasingly investing in Child Tax Credits. The goals of state credits vary, but they generally build on the federal credit and can augment the federal credit’s antipoverty potential while also redressing regressivity in state and local tax codes. Momentum around these credits has grown steadily since ARPA temporarily expanded the federal Child Tax Credit in 2021.24 In just the past five years, many states have created or expanded their own credits. In 2020, only six states had CTCs and most were small and nonrefundable.25 In 2025, 14 states have CTCs, with many credits exceeding $1,000 per qualifying child, and Georgia is set to enact one next year.26 Not all 15 state CTCs are the same, and some are far more generous and wide-reaching than others. Four states – Georgia, Utah, Arizona, and Idaho – have enacted nonrefundable credits that do not reach the lowest-income families, while some states have fully refundable credits of $1,000 or more per child.27
Results
Our main results show what size a local Child Tax Credit would need to be to reduce child poverty by 25 percent and 50 percent when we consider the potential credit as a supplement to existing federal and state policies. For example, if the federal Child Tax Credit and a state’s credit reduce child poverty by 20 percent, we ask what size a local credit would need to be to increase that poverty reduction from 20 to 25 or 50 percent. The baseline poverty rates against which we measure poverty reduction are therefore the poverty rates in each locality before accounting for the effect of any Child Tax Credit policy (federal and state) on the poverty rate. We begin by discussing baseline poverty rates in the cities we are studying, the effects of federal and state Child Tax Credits on child poverty in these cities, and the target rates corresponding to a 25 percent and 50 percent reduction in child poverty for each city. We then present the size of local Child Tax Credits needed to reach this target.28
Figure 3 presents, for each city in our study29:
(1) the baseline child poverty rate before accounting for the effects of federal and state Child Tax Credit policies (gray bar),
(2) the child poverty rate after accounting for federal and state Child Tax Credits (blue bar), which also represents the actual poverty rate for each city in our data,
(3) the target child poverty rate (green bar) that corresponds with a 25 percent reduction relative to the child poverty rate before accounting for federal and state Child Tax Credits (as shown in the gray bar),
(4) the target child poverty rate (yellow bar) that corresponds with a 50 percent reduction relative to the child poverty rate before accounting for federal and state Child Tax Credits.
Note that Figure 3 also identifies those cities where there is no state Child Tax Credit. In these cities, children are eligible only for the federal credit, and the blue bar in each panel shows the relative impact of this policy alone. Poverty rates in Figure 3 are measured using the Supplemental Poverty Measure in the American Community Survey, as described in Appendix B.
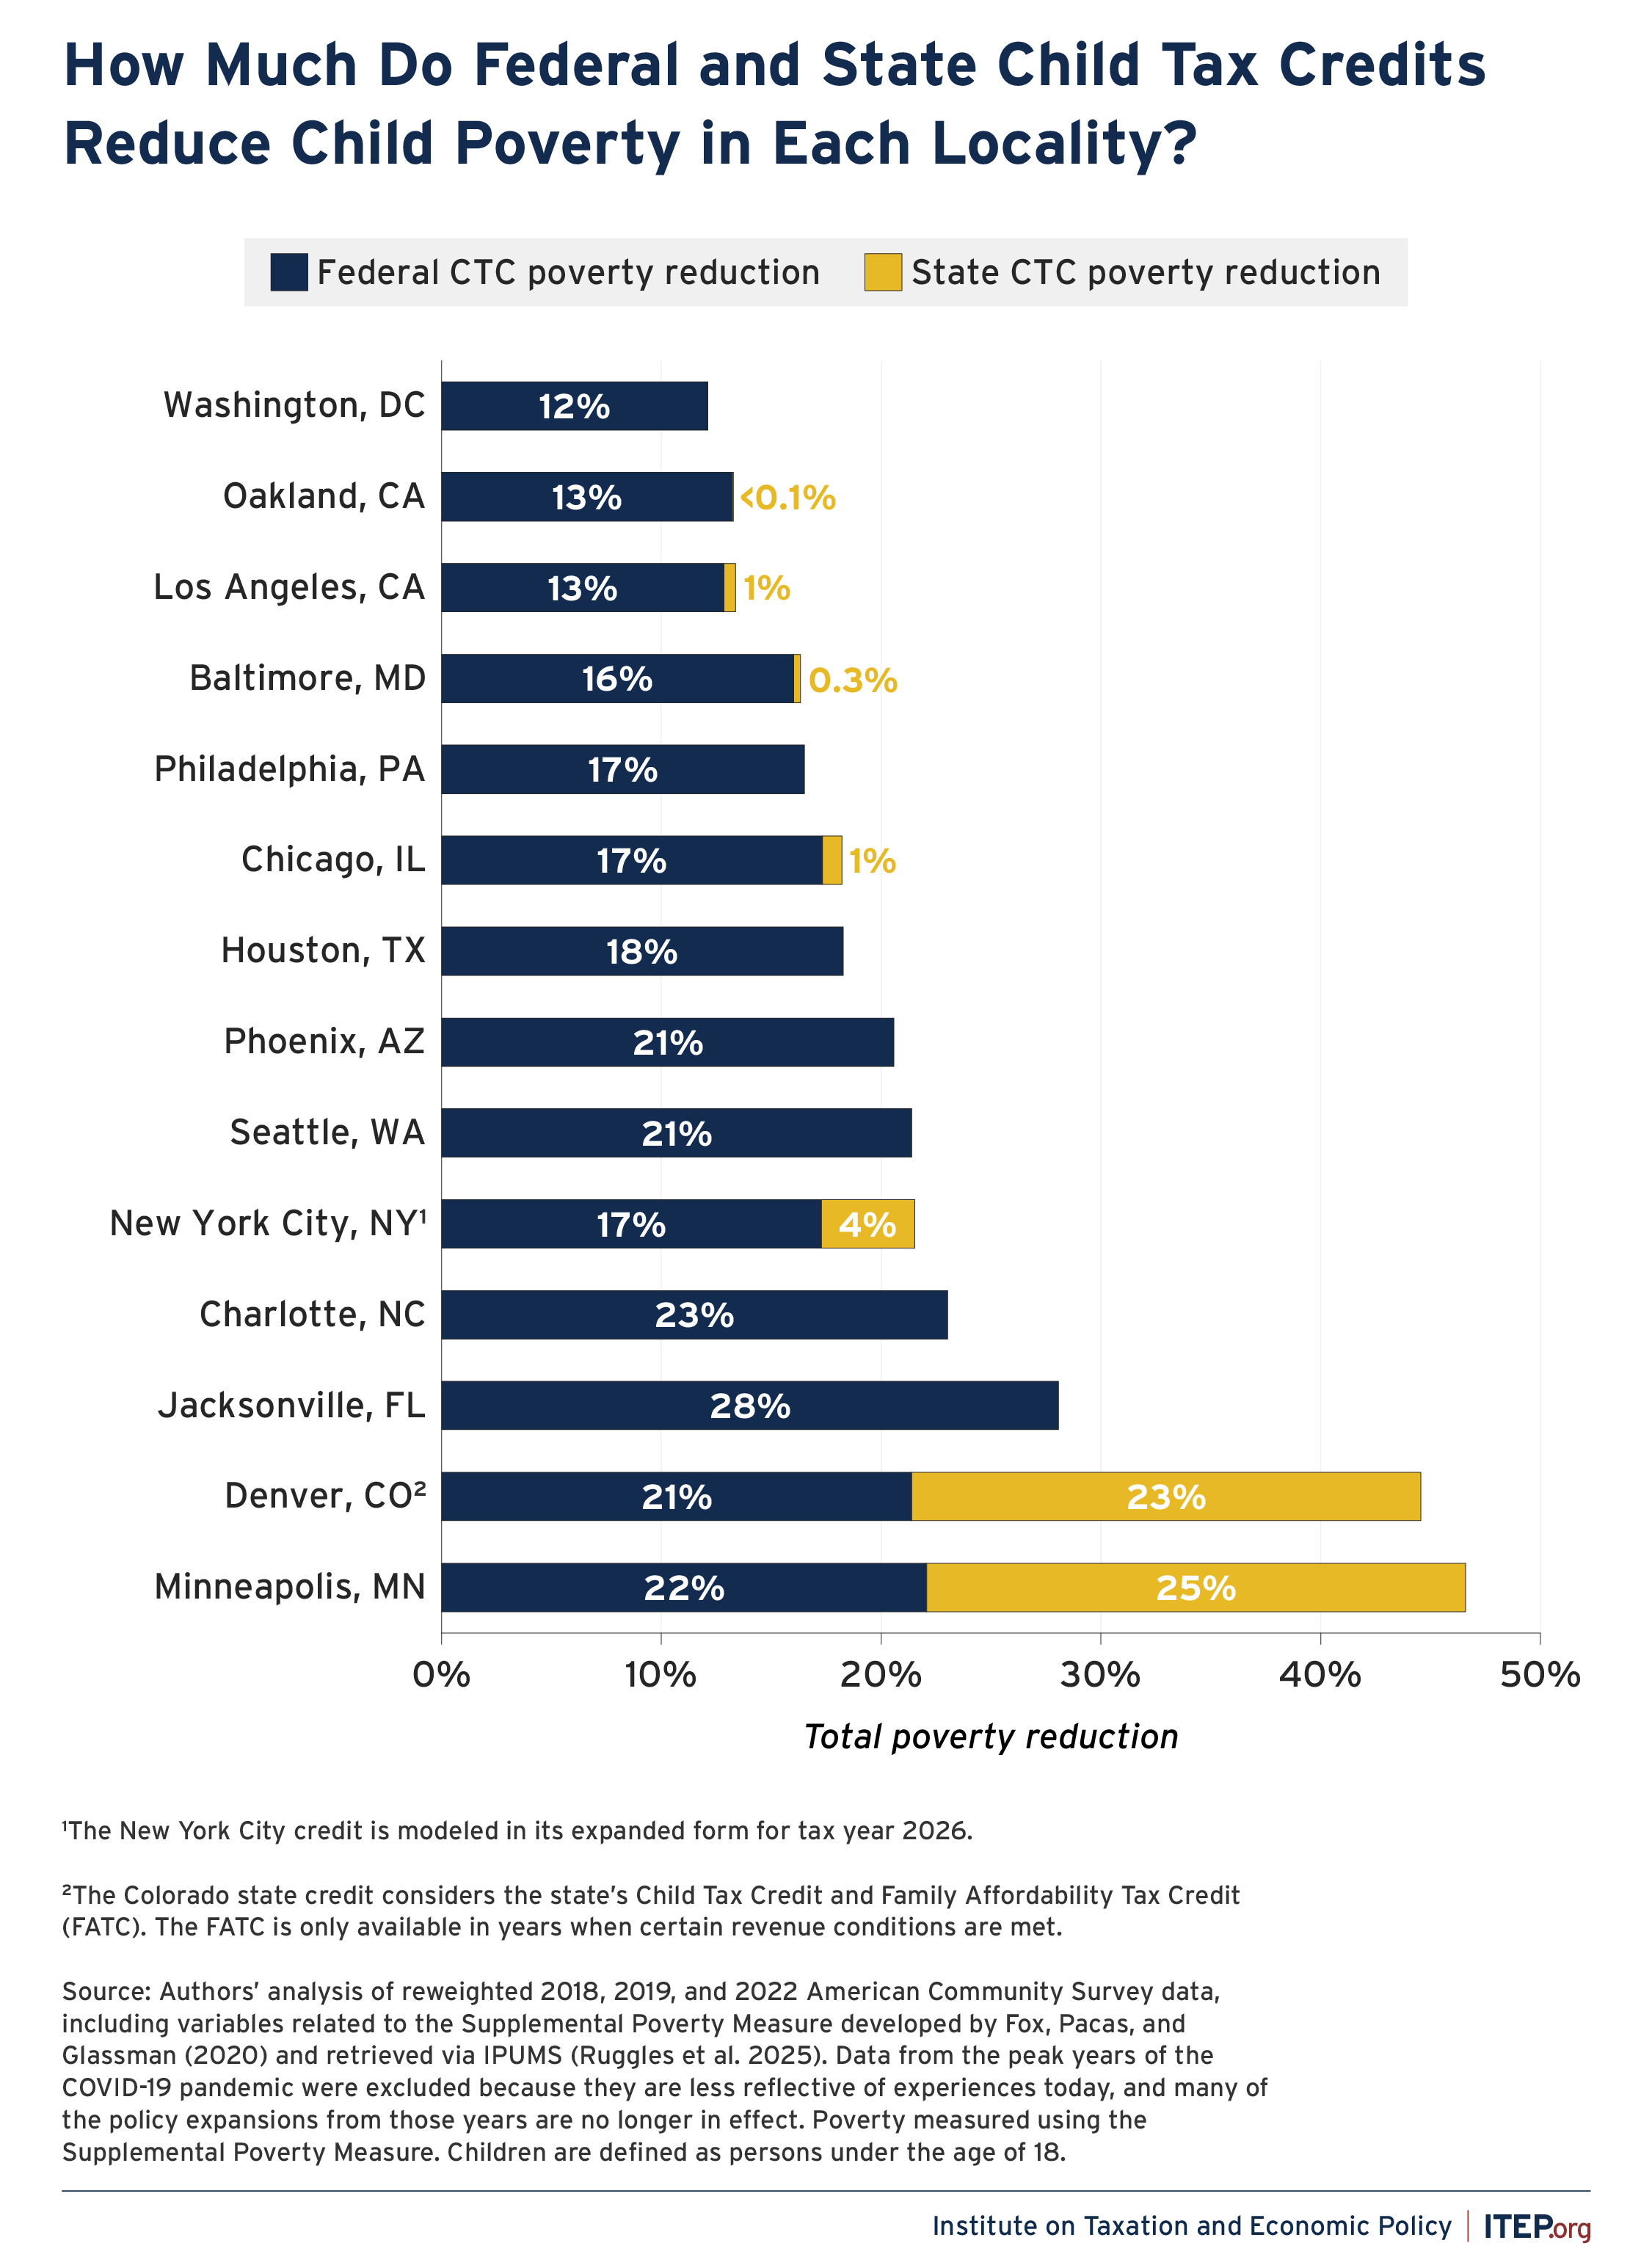
Figure 3 underscores the important role federal 30 and state Child Tax Credits play in reducing child poverty, while also showing that poverty remains widespread despite these policies. In 10 of the 14 cities examined, more than 20 percent (or 1 in 5) children are living in poverty before counting federal and state credits. After factoring in federal and state credits, six of these 14 cities still have child poverty rates of 20 percent or higher, and 12 have child poverty rates above 10 percent.
Figure 3
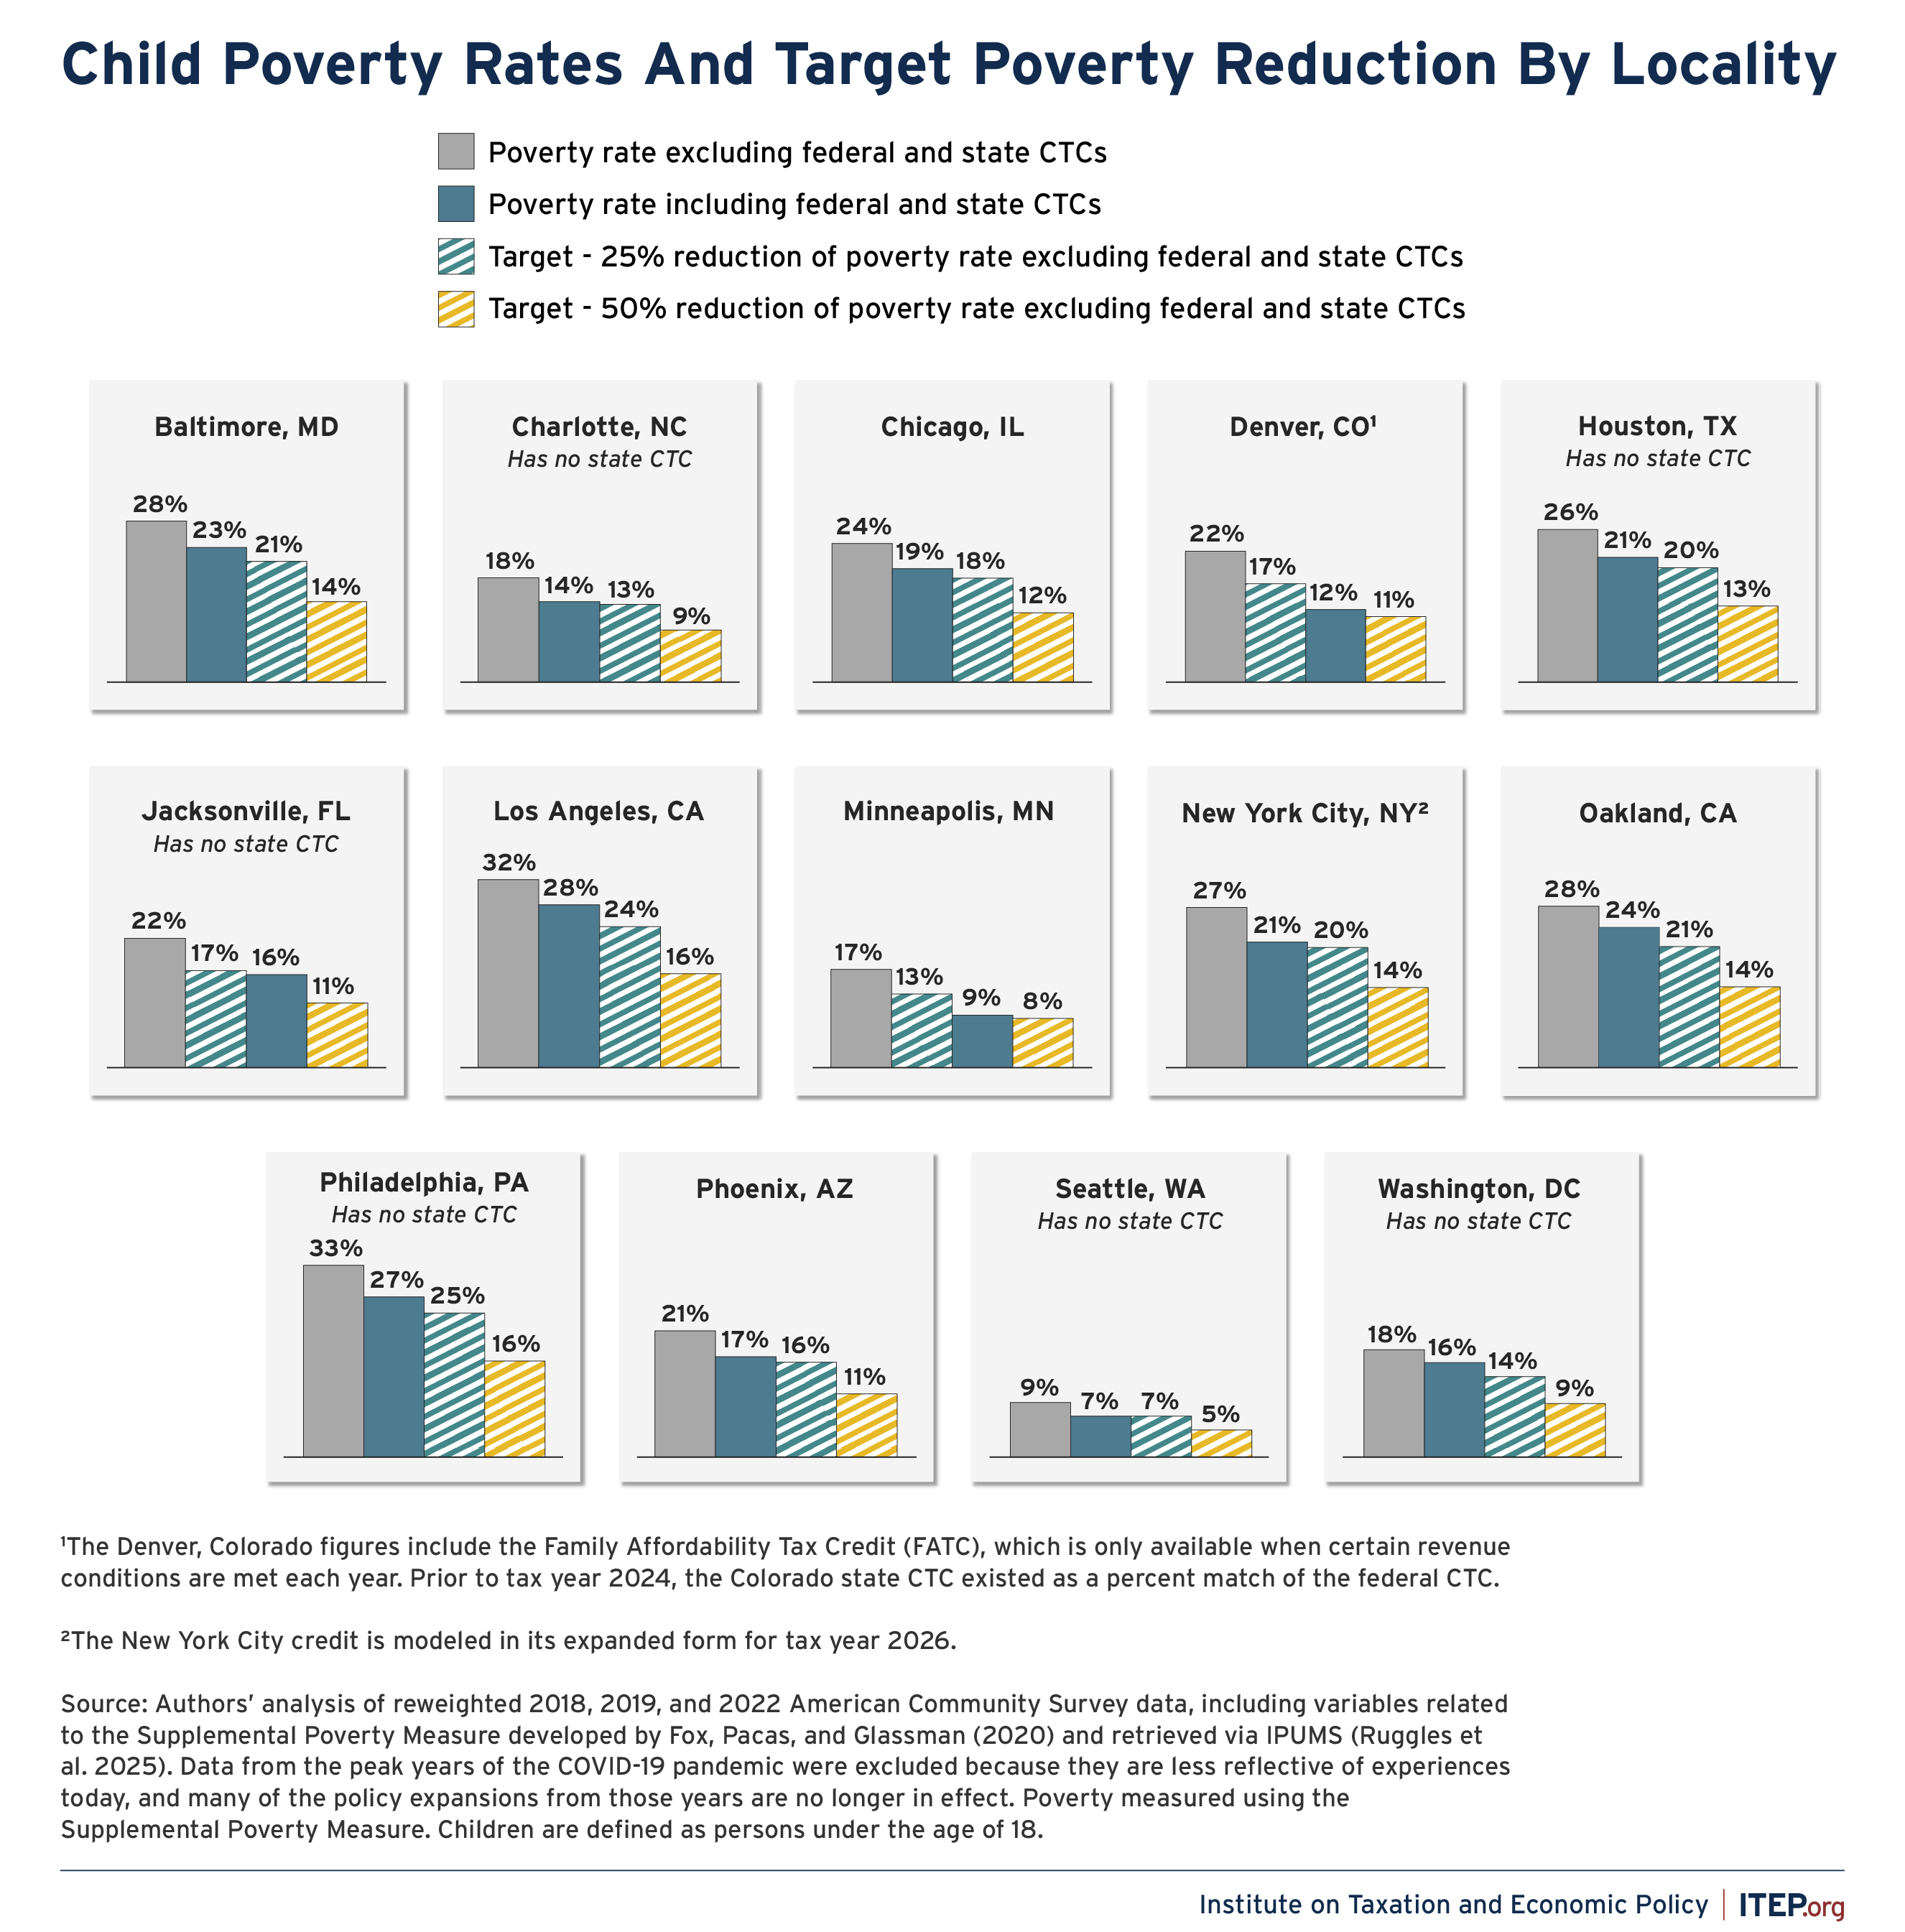
Figure 3 also shows that the effects of federal and state credits on poverty are not uniform across cities. These policies, for example, reduce the poverty rate by 4 percentage points in Phoenix (from 21 percent to 17 percent) but by 10 percentage points in Denver (from 22 percent to 12 percent). This variation stems not only from differences in state policies, but also from cross-city differences in cost of living, average incomes, and local demographics such as the average family size. Additionally, in three of the 14 cities (Denver, Jacksonville, and Minneapolis), the combination of federal and state credits (where available) already achieves the 25 percent poverty reduction target.
Why are the antipoverty effects of state Child Tax Credits so different?
A number of state CTC design choices directly affect how much credits reduce child poverty.33 In particular, the policies that have the most potential to lift children out of poverty tend to be those that:
- Provide substantial credit amounts to eligible families;
- Are available to both younger and older children;
- Ensure that families with the lowest incomes received the full credit (i.e., are fully refundable); and
- Do not phase out completely until higher in the income distribution (i.e., families with incomes below $50,000 – or roughly 60 percent of median income – are eligible for at least a partial credit)
The policies in both Minnesota and Colorado reflect these design choices. Minnesota’s Child Tax Credit provides $1,750 per dependent child under the age of 18 and is combined with a Working Family Tax Credit that provides an additional bonus for older children. Similarly, Colorado’s Child Tax Credit provides $1,200 per dependent child under the age of 6 and, when available, the Family Affordability Tax credit provides an additional $3,730 per child under age 6 and $2,454 per child ages 6-17.34 The policies in both Minnesota and Colorado are also fully refundable and phase out higher in the income distribution, meaning that nearly all children in poverty are able to benefit from these policies in their respective states.
As a result, these stand out among state Child Tax Credits in their ability to reduce poverty as they provide substantial credit amounts to the majority of children in poverty, regardless of age. Other states, in comparison, provide smaller credit amounts, may only be available to younger children, may not be fully refundable, or may not reach the majority of children in poverty, culminating in smaller antipoverty effects.
Figure 4 presents the relative poverty reduction resulting from both the federal and state Child Tax Credits by locality, further highlighting the federal credit’s varying impacts and the substantial differences driven by the presence and size of additional state credits. State credits are projected to reduce child poverty by nearly 25 percent in Denver and Minneapolis, but by less than 5 percent in New York City, and less than 1 percent in Chicago, Baltimore, and Los Angeles.31 The larger relative effect of the Colorado and Minnesota credits compared to those in other states reflects the fact that these credits are both larger and available to a wider range of children.32 Of course, state credits have no effect in localities where there is no state credit.
Figure 4
What is needed from local Child Tax Credits to meaningfully reduce child poverty beyond what is accomplished by federal and state policies? Figure 5 presents (1) the local credit amounts needed to cut child poverty in each locality by 25 percent – to the first target rates in Figure 3 – when combined with the federal and state credits, and (2) the additional reduction in poverty that would be associated with the local credit. Note that, following the principles outlined earlier, we assume that young children would receive a larger credit than older children (with the credit for younger children amounting to 1.2x the older child credit). A base credit of $1,500 or less would be enough to cut child poverty by 25 percent across all localities in combination with state and federal credits. In fact, with the exception of Los Angeles and Oakland, a base credit of $1,000 or less would be sufficient for a 25 percent reduction across the remaining localities in this study. Notably, when combined, state and federal credits reduce child poverty by close to or even more than 25 percent in a number of localities (Jacksonville, Denver, and Minneapolis).
Figure 5
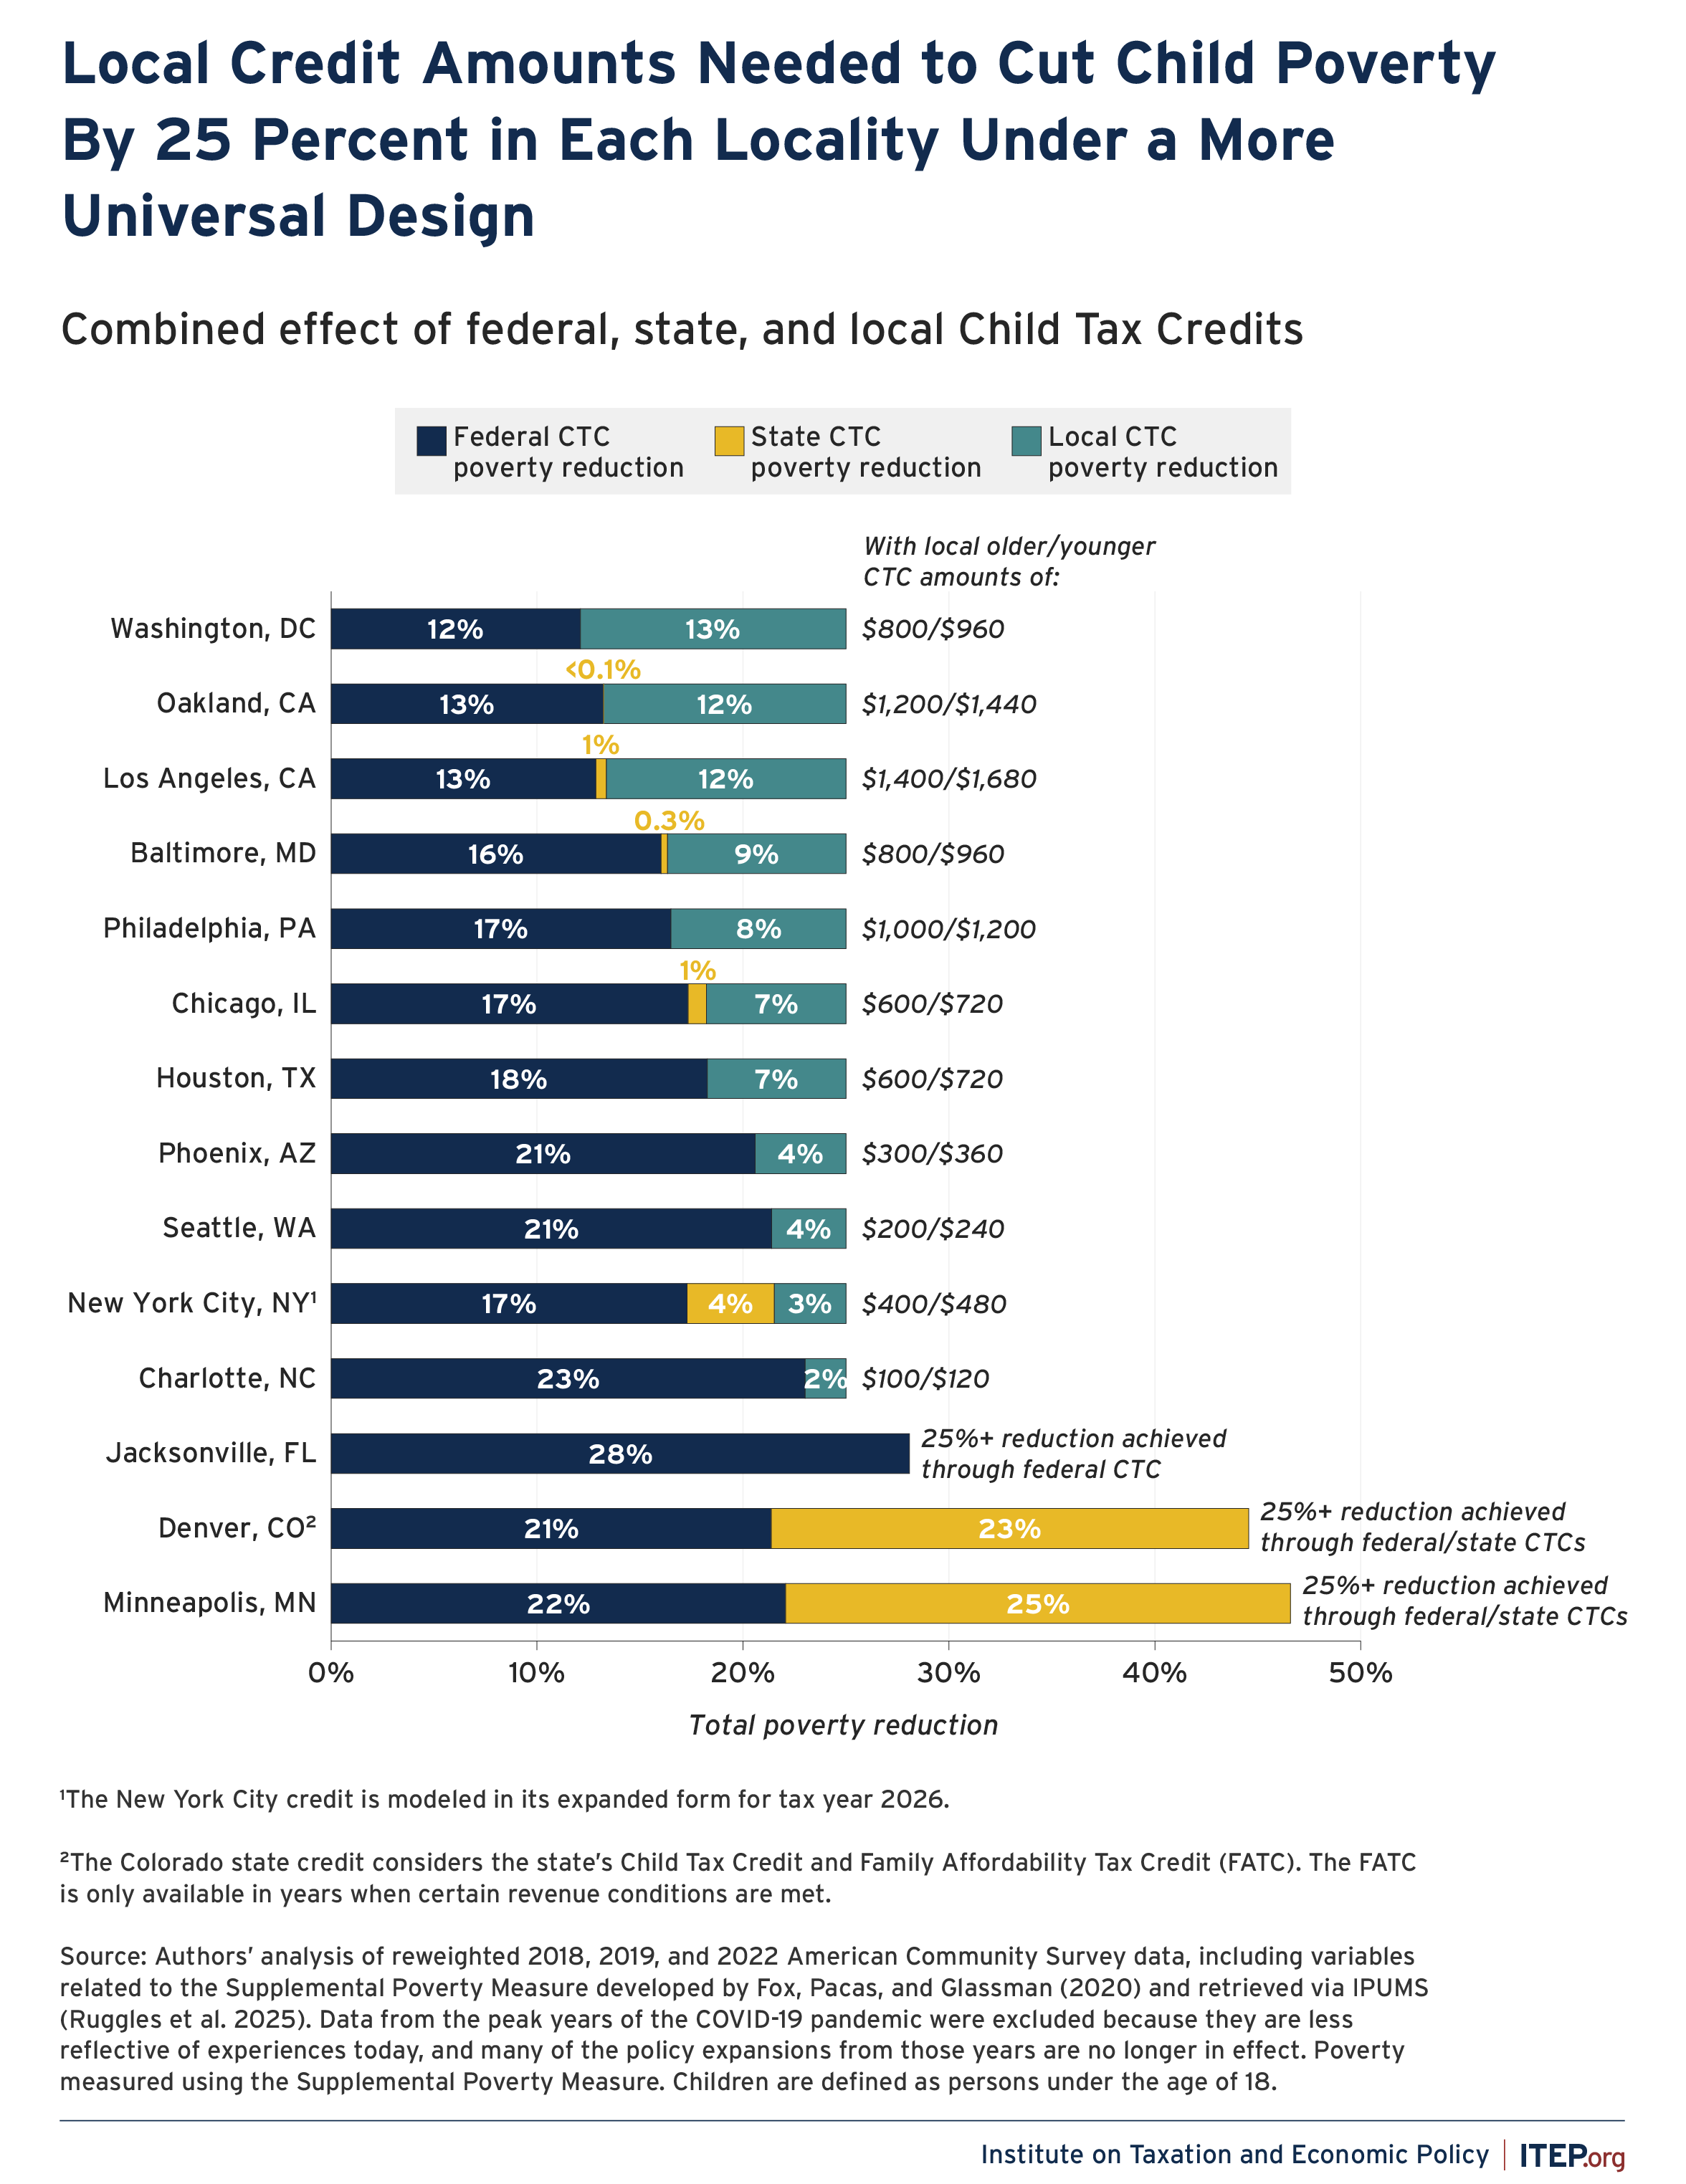
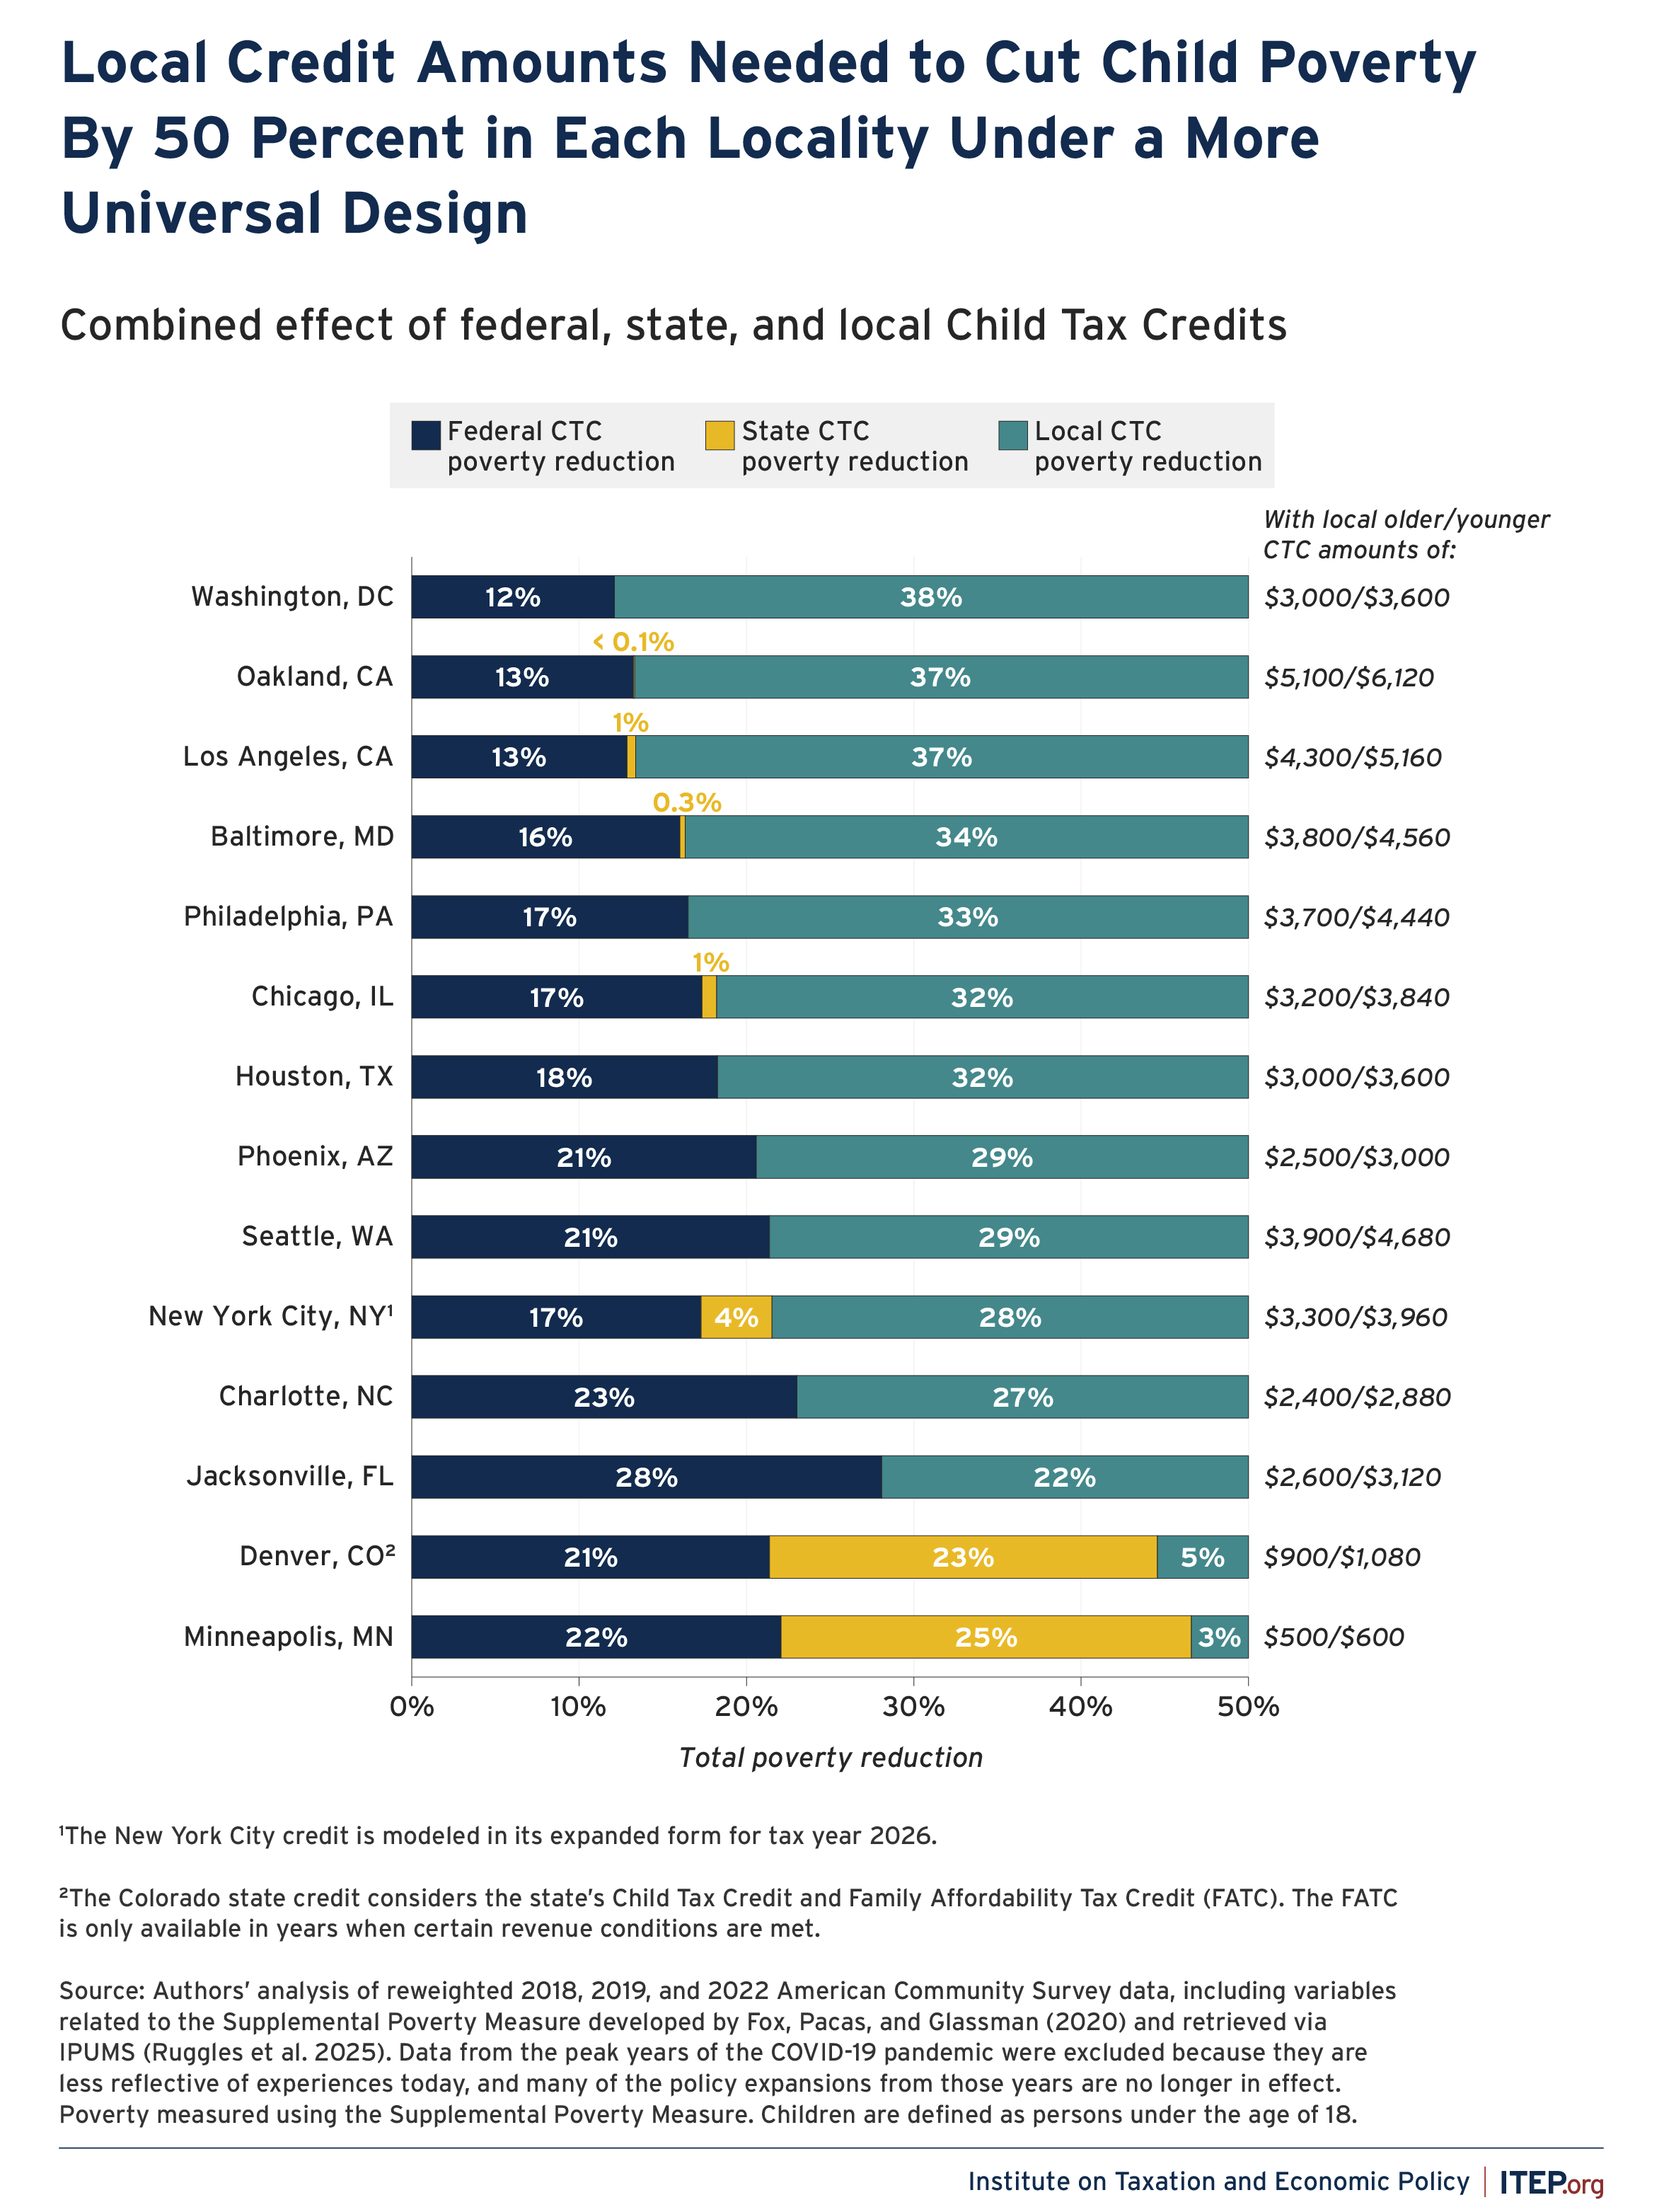
Figure 6 provides the credits needed to achieve the 50 percent reduction in child poverty. We find that, with the exception of Oakland and Los Angeles, a base credit of $4,000 per child or less would enable all localities to achieve the target 50 percent reduction in child poverty. In seven of the cities, such a reduction could be achieved with a base per child credit of $3,000 or less.
The results in Figure 6 also show how the combined effects of federal and state Child Tax Credits have a direct bearing on how much localities would need to supplement them to achieve a 50 percent reduction in poverty. For example, because federal and state credits have relatively small effects in Oakland, a local credit in this locality would need to be more than $5,000 to cut poverty by an additional 37 percent and achieve a 50 percent reduction in child poverty. In contrast, in localities like Minneapolis that benefit from both the federal policy and an expansive state policy, a local credit would only need to be around $500 to cut poverty by an additional 3 percent to reach the 50 percent target. This highlights the importance of robust state child credits for helping local governments meaningfully reduce their city’s often high child poverty rates. Expansions to the federal Child Tax Credit akin to those in place in 2021 would also significantly reduce poverty in cities across the country. With such an expansion, the local credits needed to achieve these poverty reduction targets would be markedly lower.
Figure 6
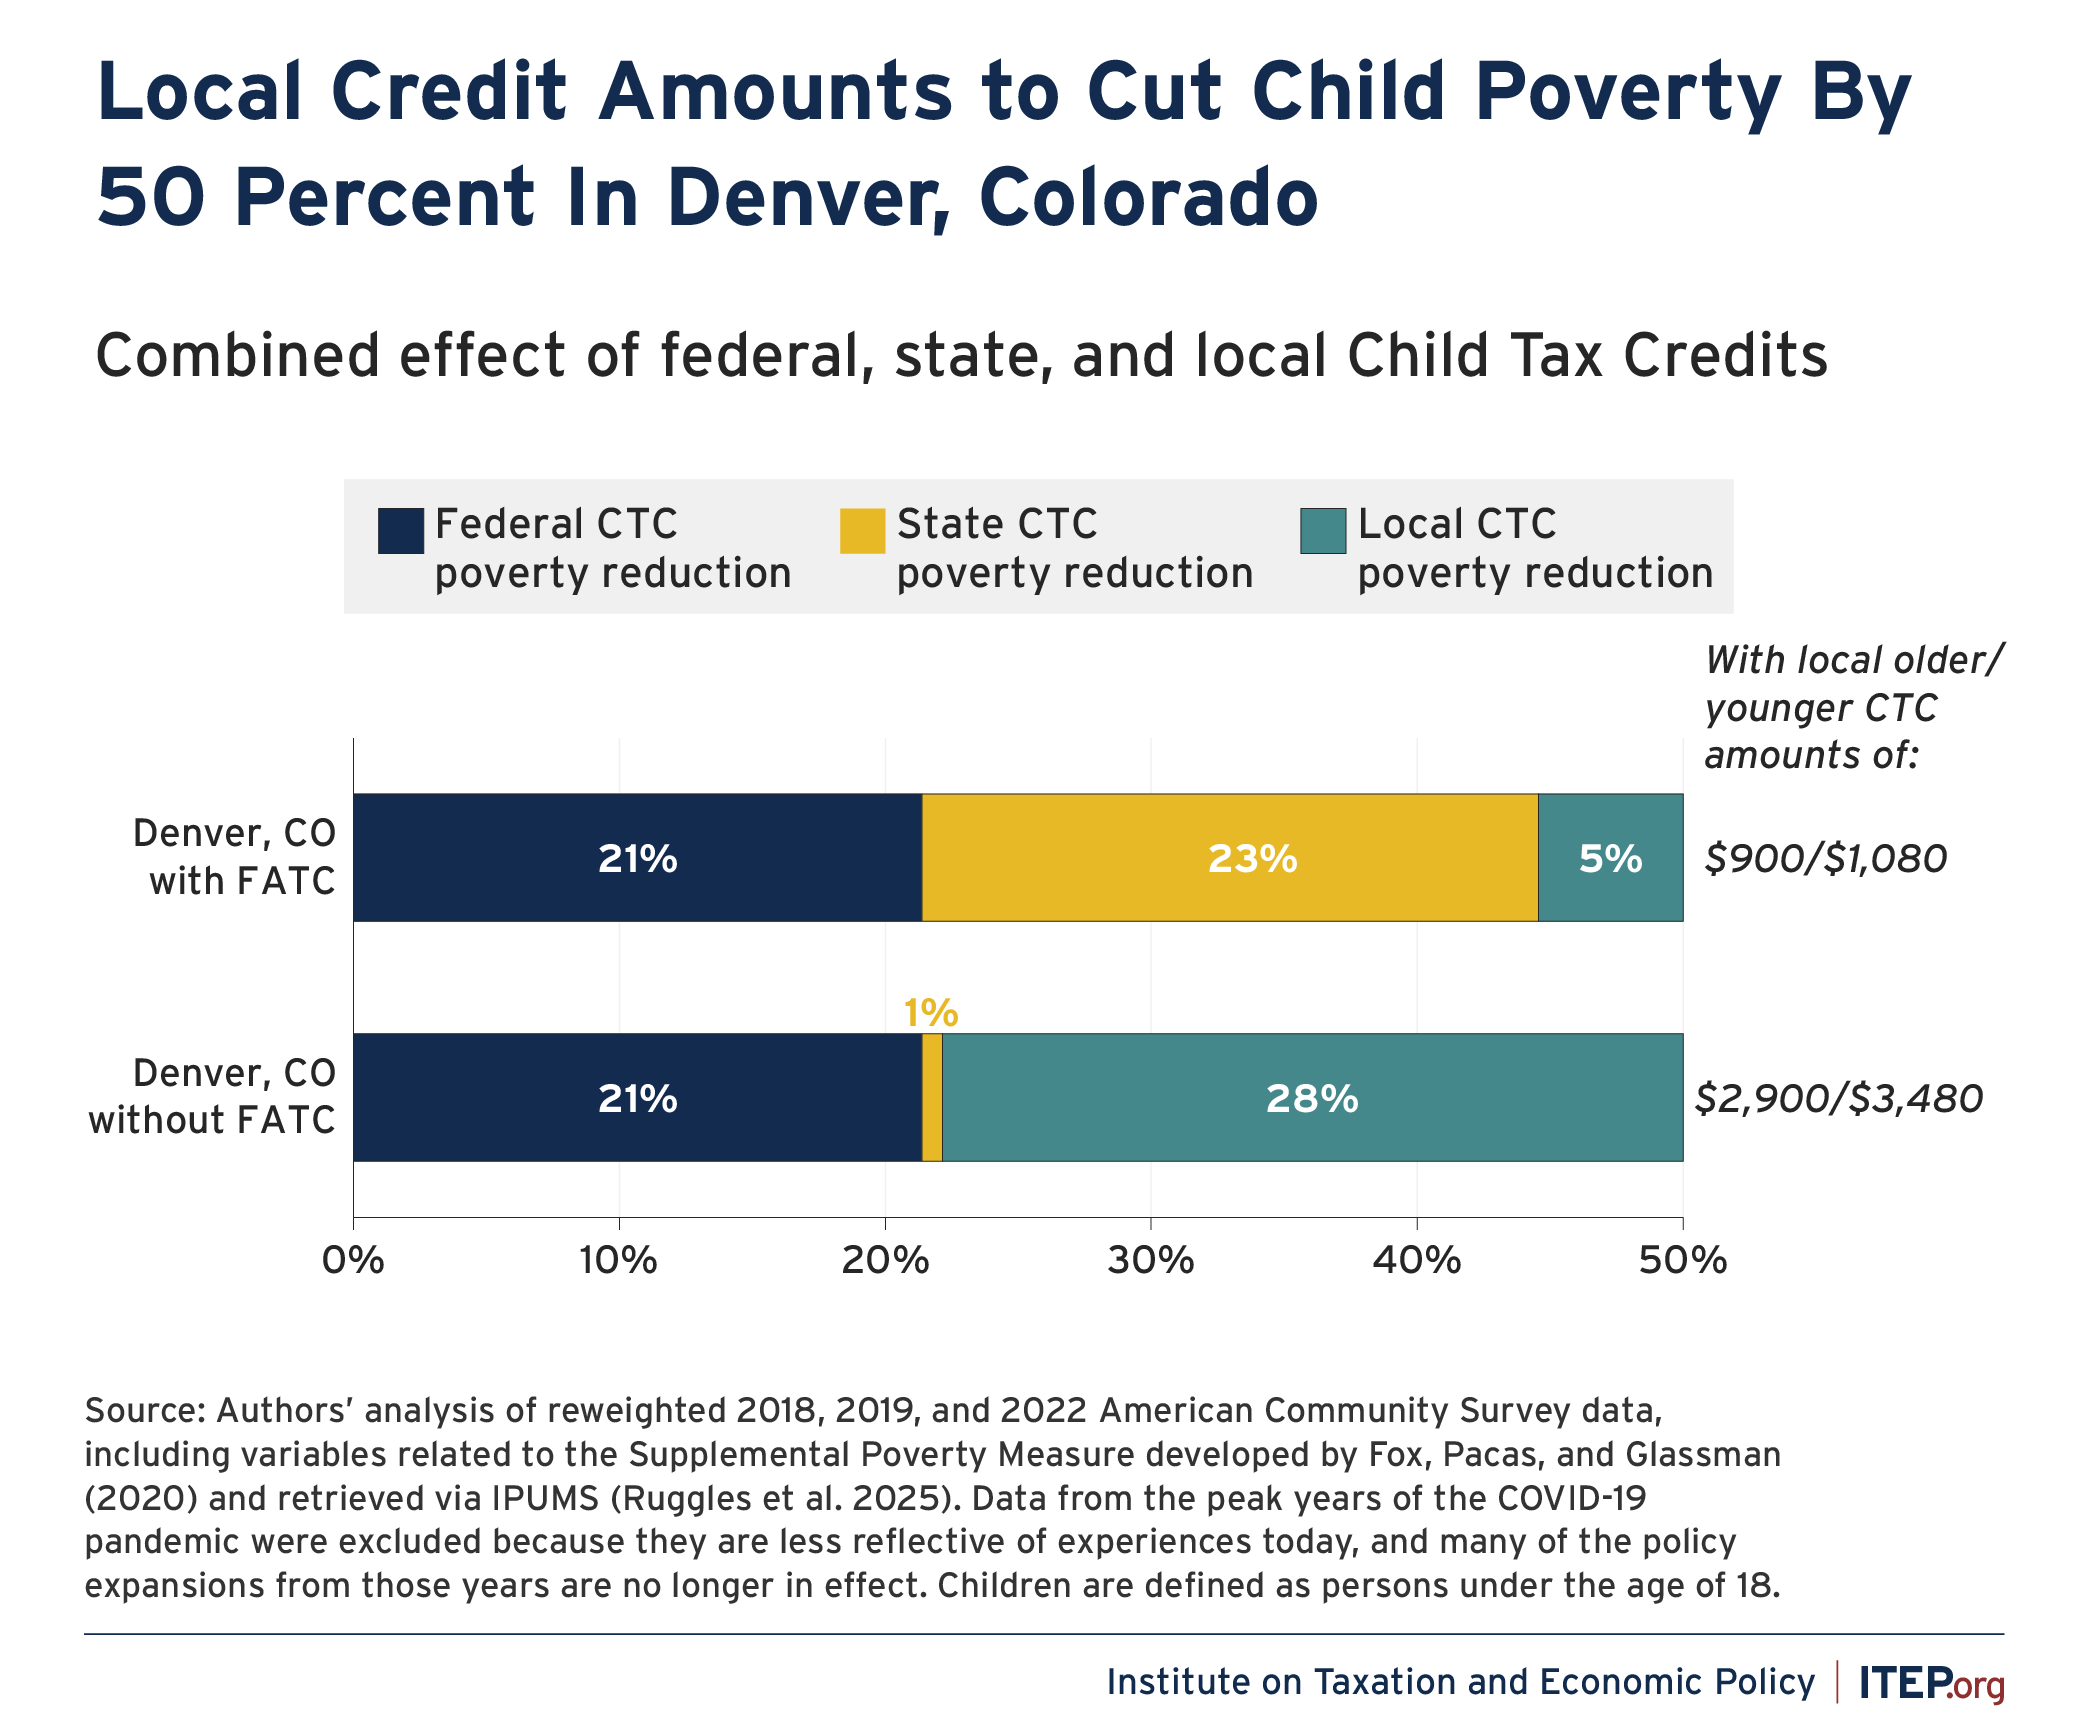
Denver, Colorado Highlight:
The Role of the Family Affordability Tax Credit
In 2024, Colorado established two new tax credits for children: the Colorado Child Tax Credit and the Colorado Family Affordability Tax Credit (FATC). The Colorado Child Tax Credit provides families with up to $1,200 per child for their young children (under age 6), while the FATC is available to children of all ages and is higher in value ($3,730 per child under age 6 and $2,454 per child ages 6-17). However, the FATC is only distributed when state surplus revenue exceeds predetermined targets.35 Results in the main body of this report (Figures 3 – 5) assume that Colorado is meeting its revenue targets and that families are eligible for both the states’ Child Tax Credit and FATC. If, however, the state does not meet these revenue targets, the cumulative effect of federal and state Child tax Credits would be smaller in Colorado, and Denver would need to provide a larger local credit to achieve a 50 percent reduction in child poverty.
Figure A shows that in this alternative scenario, the poverty rate after including the federal and Colorado Child Tax Credit, but without that FATC, would be 17 percent – about 5 percentage points higher than the poverty rate with the FATC. Figure B shows that Denver would need a $2,900 per child credit to reach the target 50 percent reduction when FATC is not fully funded versus a $900 per child credit when it is.
Figure A
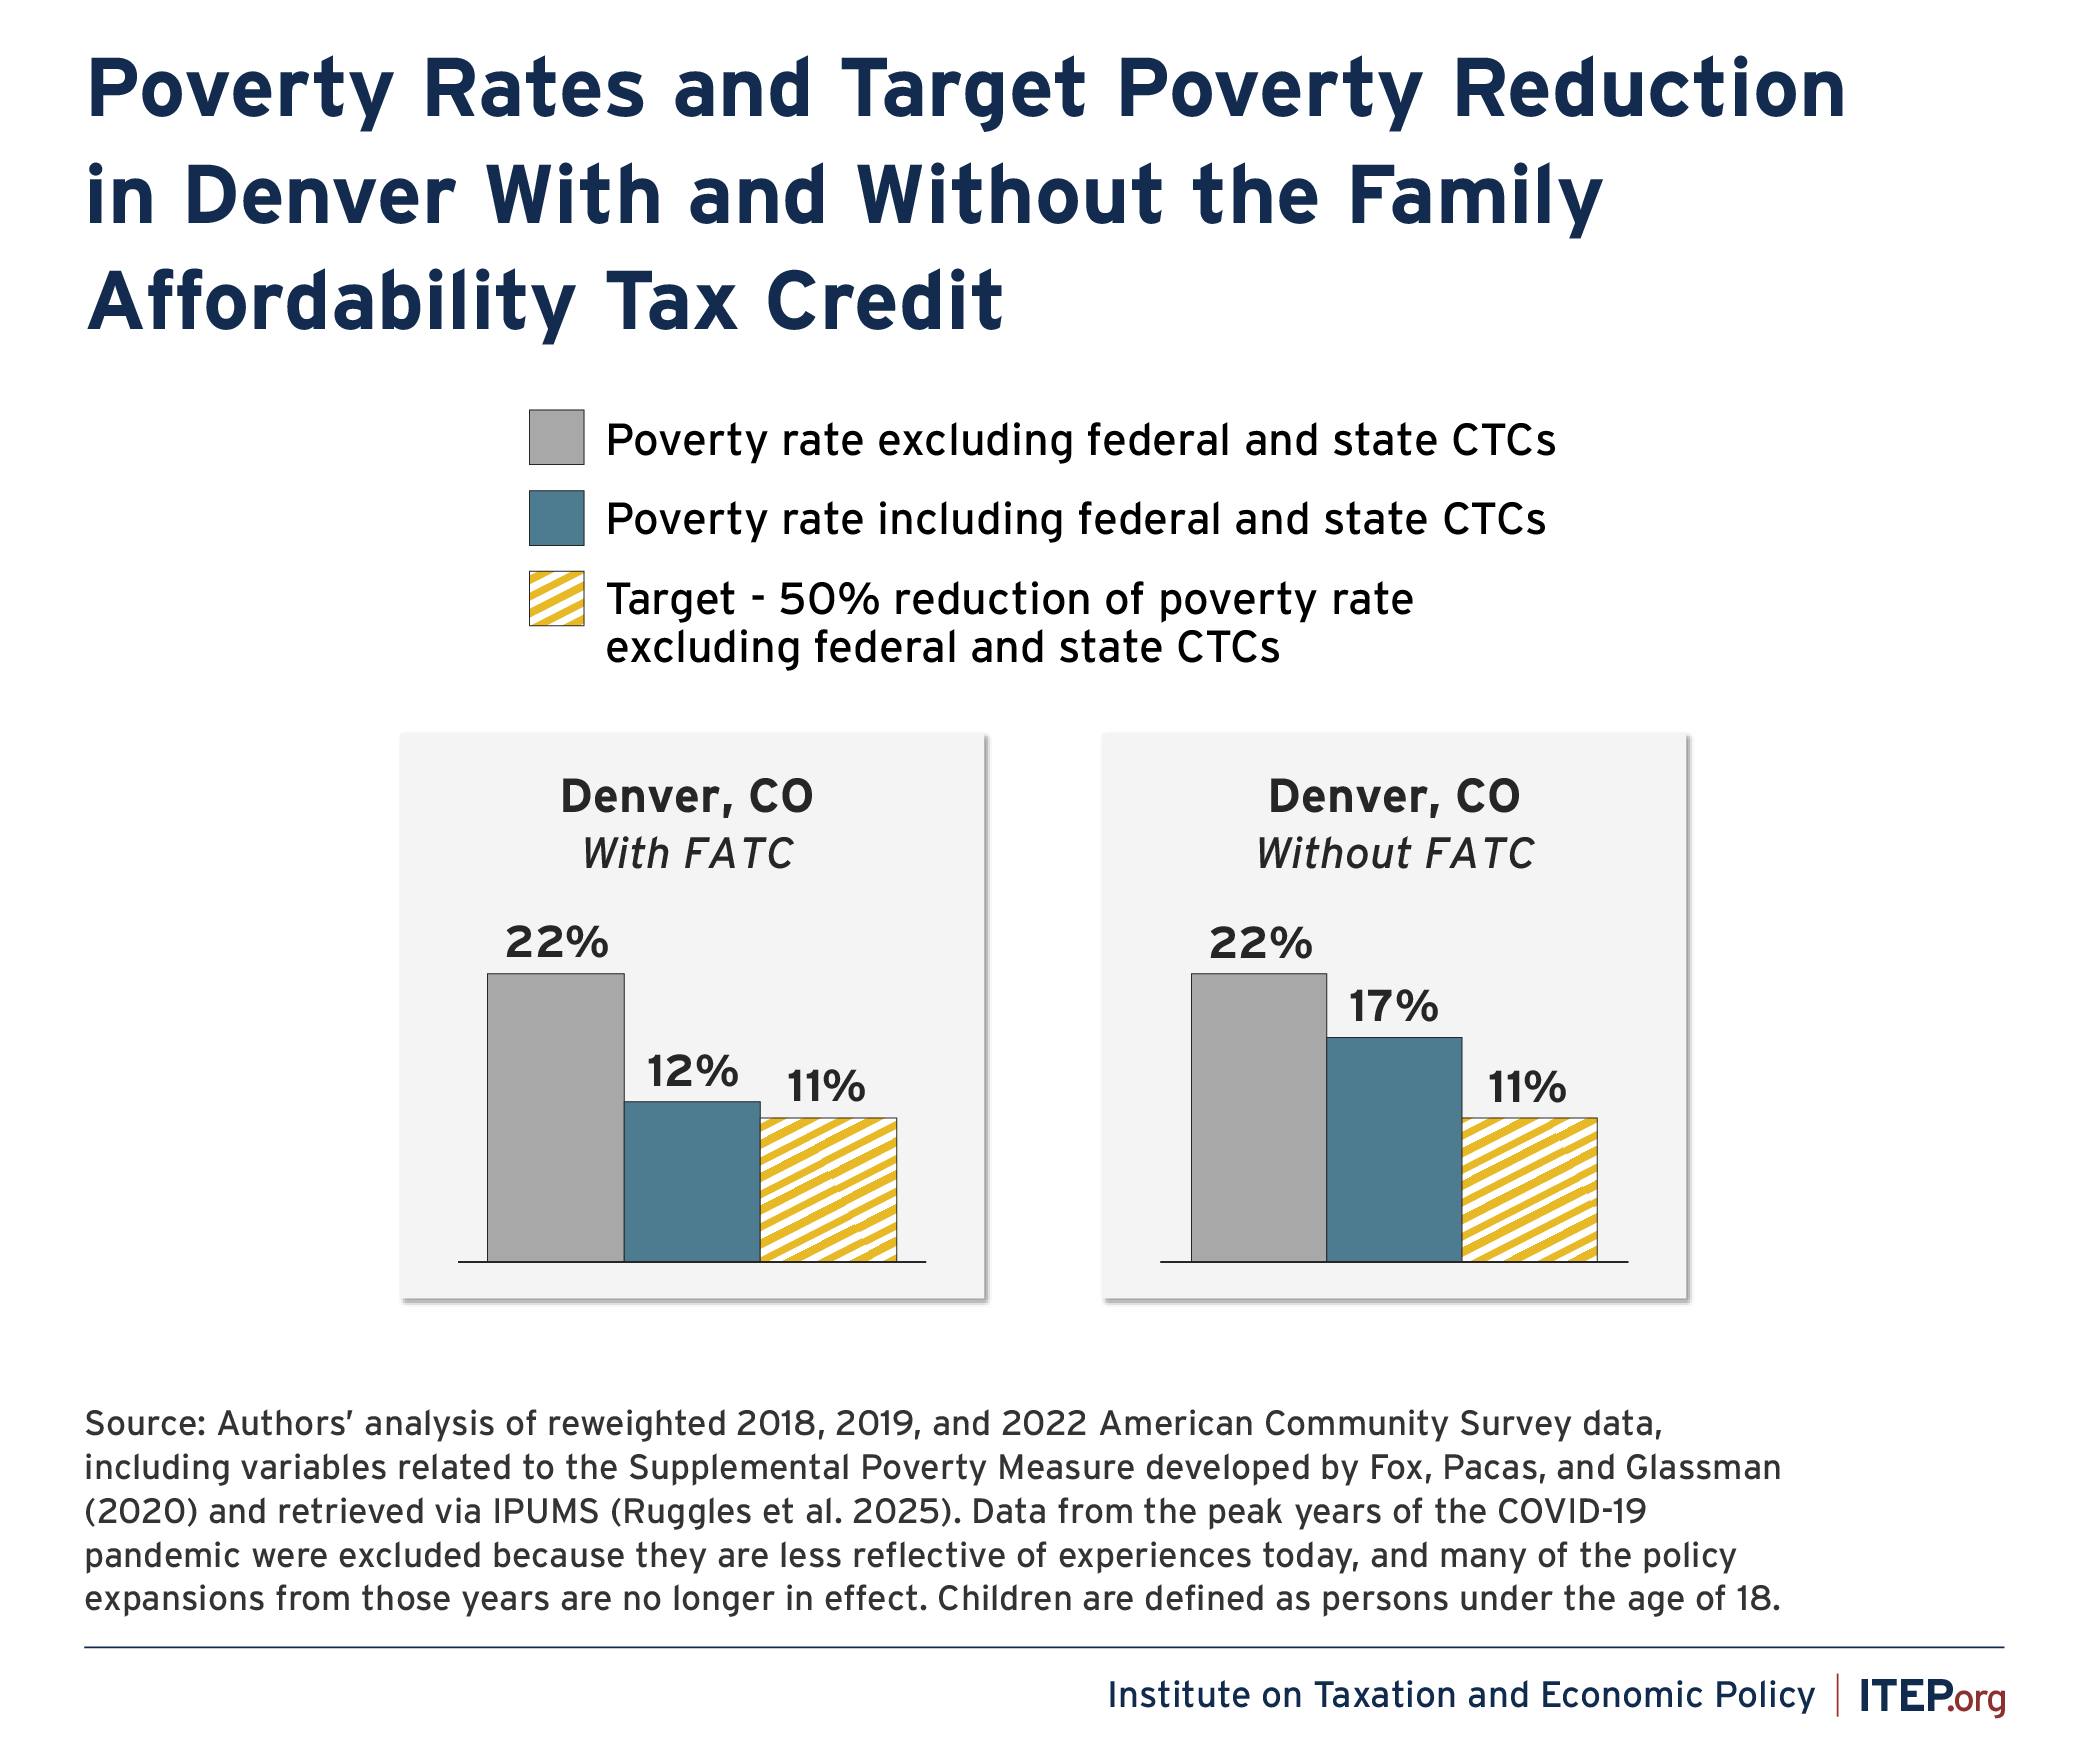
Figure B
In eight of the 14 cities examined, the cost for achieving a 50 percent poverty reduction is less than 15 percent of city revenues, and in three of those cities, the total cost is 5 percent or less. When pursuing a 25 percent poverty reduction, the costs are far less; costs are less than 3 percent of the city revenues in ten out of 14 cities and less than 1 percent in a handful of cities. In cities with smaller operating budgets and/or higher child poverty rates, Child Tax Credits can be designed to better meet budget windows. However, smaller credits will result in lower child poverty reduction.36
Table 1 presents the cost estimates for the local Child Tax Credits that would achieve the child poverty reductions presented in Figure 3, assuming that the local credit would be more widely available to children in the cities examined.37 Variation in costs across cities is attributable to differences in population size and composition as well as income distribution, among other factors. Table 3 in Appendix A presents the cost estimates for both baseline poverty rates for each city (i.e., the first and second thought experiments discussed previously). Table 4 in Appendix A presents corresponding cost estimates for credits that have the same maximum values, but are more targeted to children in lower- and moderate-income families.
Conclusion
This report assesses how local Child Tax Credits could supplement federal and state credits to reduce child poverty. We examined how large a local credit would need to be to reach specified poverty-reduction targets and the costs of such credits.
While federal and state Child Tax Credits play an important role in reducing child poverty, much can still be done to reduce child poverty in cities across the country. This is especially true given the inequities resulting from the design of the federal credit. Many children across demographic groups are helped by the child tax credit but others are left behind because of design flaws that could easily be corrected. Black and Hispanic children are disproportionately ineligible for the full federal credit, as are younger children, children with single parents, children in poorer families, and children in larger families.38 Local governments have a critical role to play in reducing child poverty and filling the gaps left by existing state and federal policies with local credits. Local Child Tax Credits could provide large tax cuts (as a percentage of income) to families at the bottom of the income scale, lessening the overall regressivity of state and local tax systems.
The size and cost of credits needed to cut child poverty by half vary by city but are substantially lower when a city is located in a state with a robust Child Tax Credit, such as Minnesota and Colorado. Even where state policies fall short, local governments can still act on their own to create local credits and meaningfully reduce poverty. Cities have long been early adopters of policies that advance equity and broad-based economic security, including stronger minimum wage ordinances, paid sick leave programs, guaranteed income pilots, and universal preschool. Cities should also consider local Child Tax Credits as a powerful policy tool that not only benefits individual households and local economies, but can also inspire broader state and federal action.
Download the full Appendix A as a PDF: Appendix A (PDF)
Methodology for Estimating the Anti-Poverty Effects of Local Child Tax Credits
Data
To estimate the anti-poverty effects of local Child Tax Credits, we use data from the American Community Survey (ACS), supplemented with variables related to the Supplemental Poverty Measure (SPM) developed by Fox, Glassman, and Pacas (2020). The ACS data used in this analysis were retrieved from IPUMS USA (Ruggles et al. 2025), including the variables related to the Supplemental Poverty Measure. Estimates of poverty measured using the SPM typically rely on data from the Current Population Survey Annual Social and Economic Supplement (CPS ASEC) as the CPS ASEC includes detailed income and program participation data required to construct the SPM, such as noncash transfers, tax credits, and necessary expenditures. However, the CPS ASEC does not have sufficient sample size for producing local-level estimates. The American Community Survey (ACS) offers a substantially larger sample size and more granular geographic coverage than the Current Population Survey Annual Social and Economic Supplement (CPS ASEC), making it well-suited for generating reliable estimates at the state and sub-state levels. Not all of the requisite data for measuring poverty under the SPM is available in the ACS, but the U.S. Census Bureau has developed an experimental ACS-SPM series where these missing components are imputed. (For additional information on this series, see Fox, Glassman, and Pacas (2020)). For our analysis, we use the ACS-SPM data series as well as the core variables available in the ACS.
In comparing national and state-level estimates from the ACS-SPM to estimates from the CPS-ASEC, we found that poverty rates in this experimental series were typically higher than those estimated using the CPS-ASEC. As the CPS-ASEC is the official dataset used to measure poverty under the SPM, we designed a method to improve the alignment of ACS-based estimates with those from the CPS ASEC. We apply a raking adjustment (iterative proportional fitting) to recalibrate the ACS person-level weights. This procedure adjusts the weights so that the marginal distributions of key variables – age group, race/ethnicity, sex, highest educational attainment in the household, and SPM poverty brackets – conform to corresponding distributions in the CPS ASEC. By addressing differences in survey design, measurement, and coverage, this reweighting enhances the validity of ACS-based SPM estimates for use in state and small-area estimates or subgroup analyses.
Modeling Approach
We measure poverty rates and poverty reduction using the SPM. We identify families in our study localities using city identifier variables produced by IPUMS-USA (Ruggles et al 2025). For localities that were not immediately identifiable, we used a population-weighted approach based on the composition of localities in relation to Public Use Microdata Areas. Population shares were retrieved via the Missouri Census Data Center’s Geographic Correspondence Engine.39
Modeling the federal, state, and local Child Tax Credits followed a similar approach. Tax units and tax-related variables (e.g., adjusted gross income and tax filing type) were constructed in the ACS data using a methodology mirroring the approach used by the U.S. Census Bureau when developing tax units in the CPS-ASEC.40 For each credit, the relevant credit amounts were assigned to each tax unit in the data based on their federal adjusted gross income, earned income, number of eligible dependents, and filing type. Credit amounts were adjusted based on the relevant phaseout rates of each credit and then aggregated at the SPM unit level and added to each unit’s resources used to evaluate poverty status. In each case, credit amounts and phaseout thresholds were adjusted for inflation from 2025 dollars to the relevant data year. For example, when modeling a credit in the 2022 ACS, credit parameters were deflated from 2025 dollars to 2022 dollars using the Consumer Price Index for All Urban Consumers. This updated resource measure was then compared to each unit’s SPM threshold to determine each unit’s poverty status after accounting for federal, state, and local Child Tax Credits. For a full list of the parameters used to model state-level Child Tax Credits, see Appendix Table B1. The most recent version of each state’s Child Tax Credit policy was used when modeling credit amounts. The local Earned Income Credit policy was also modeled for New York City. Similarly, the federal Child Tax Credit was modeled based on the parameters incorporated into law with the passage of the OBBBA, also known as the federal budget reconciliation bill, H.R.1, in July 2025.
To determine the local Child Tax Credit amounts that would result in child poverty reductions of 25 percent and 50 percent in combination with federal and state Child Tax Credits, we first subtracted all Child Tax Credit amounts from each unit’s resources and recalculated their poverty status. This was used as the baseline poverty rate. The federal and state Child Tax Credits were then added to resources and poverty was recalculated to determine the relative reductions in poverty attributable to federal and state credits. We then modeled local Child Tax Credit amounts in $100 increments based on two designs: (1) a more universal design with 5 percent benefit phaseout for joint filers after $110,000 of income and $75,000 for heads of household, mirroring the federal Child Tax Credit income phase out in place prior to the 2017 Tax Cuts and Jobs Act, and (2) a more targeted approach with a structure that mirrored the structure of the federal EITC for families with three or more dependents. We also applied a 20 percent bonus to credits for children under the age of 6. At each $100 credit increment, we recalculated each unit’s poverty to determine the relative reduction in poverty attributable to the local Child Tax Credit in combination with the effects of the federal and state credits. We repeated this process until we found the credit amounts that would result in 25 percent and 50 percent reductions in child poverty in each locality relative to the pre-credit baseline.
Methodology for Estimating the Costs of Proposed Local Child Tax Credits
We use the ITEP Microsimulation Tax Model to analyze costs and impacts across the income distribution of local Child Tax Credit policies. ITEP assigns each observation in our Microsimulation model a probability weight of living within a specific locality. These probability weights are calculated through a match with the American Community Survey.
American Community Survey individual and household level data are broken down into tax units, and then a crosswalk between the 5-year sample and our microsimulation model is produced, using several characteristics present in both data sets. These include income, marital status, homeownership, age, and number and age of children. For the purposes of ITEP’s model, income for each tax unit includes wage and salary earnings, retirement income, child support, unemployment compensation, worker’s compensation, and other income from public supports and financial assistance.
The geographic boundaries of each locality are determined by aggregating Public Use Microdata Areas – the smallest geography available within the American Community Survey microdata – to best match each local tax jurisdiction. The resulting estimates are then checked against published data from the U.S. Census Bureau, Internal Revenue Service, and state revenue departments to ensure that they accurately reflect the income and demographic profile of the locality.
For additional information about the ITEP Microsimulation Tax Model, visit itep.org/itep-tax-model.
Endnotes
- 1. U.S. Census Bureau, Poverty in the United States: 2024, Report No. P60-287, September 9, 2025. https://www.census.gov/library/publications/2025/demo/p60-287.html
- 2. Neva Butkus, “State Child Tax Credits Boosted Financial Security for Families and Children in 2025,” Institute on Taxation and Economic Policy, September 11, 2025. https://itep.org/state-child-tax-credits-2025/
- 3. Ryan Vinh, Danielle Wilson, Sophie Collyer, Megan Curran, and Christopher Wimer, “Assessing the Potential Impacts of Refundable State Child Tax Credit Designs on Child Poverty,” Center on Poverty and Social Policy, Columbia University, April 21, 2025. https://povertycenter.columbia.edu/publication/2025/refundable-state-child-tax-credit-designs
- 4. The average child poverty rate among children in U.S. cities is roughly 20 percent versus 12.5 percent nationally, when estimated in the American Community Survey data (the source of poverty statistics in this report). See Appendix B for additional information on this data.
- 5. Institute on Taxation and Economic Policy, Who Pays? 7th Edition, January 2025. https://itep.org/whopays-7th-edition/
- 6. W. Steven Barnett and GG Weisenfeld, “Cities Emerge as Preschool Champions,” National Institute for Early Education Research, May 22, 2018. https://nieer.org/research-library/cities-emerge-preschool-champions; Stateline, “As More Cities Push for Paid Sick Leave, States Push Back,” September 24, 2018. https://stateline.org/2018/09/24/as-more-cities-push-for-paid-sick-leave-states-push-back/; Yannet Lathrop, “Minimum Wage Basics: Local Minimum Wage Laws,” National Employment Law Project, July 2, 2025. https://www.nelp.org/insights-research/city-minimum-wage-laws-recent-trends-and-economic-evidence-on-local-minimum-wages/; “Guaranteed Income Pilots Dashboard,” Stanford Basic Income Lab and Center for Guaranteed Income Research, 2025. https://guaranteedincome.us/
- 7. See Fox, Glassman, and Pacas (2020) for additional information on the construction of the SPM in the ACS.
- 8. Cities that either did not benchmark well against other data sources, or posed challenges with regards to geographic boundaries included Atlanta, Detroit, New Orleans, Miami, Pittsburgh, and Nashville.
- 9. Institute on Taxation and Economic Policy, State Child Tax Credits and Child Poverty: A 50-State Analysis, November 16, 2022. https://itep.org/state-child-tax-credits-and-child-poverty-50-state-analysis/
- 10. Media reports indicate that, starting in August 2025, the Internal Revenue Service has begun sharing confidential taxpayer data with immigration enforcement authorities under an unprecedented and legally dubious agreement aimed at facilitating the deportation of immigrant tax filers. Furthermore, the Trump administration has also stated its intention to compel states to disclose a wide range of data relating to programs they administer, also with the goal of facilitating mass deportations. Against this backdrop, encouraging immigrants to file tax returns and to claim federal, state, and/or local tax credits could also put them at risk. Mechanisms for protecting confidential tax filer data from immigration authorities must be devised to prevent this possibility. Vinh, Ryan, Danielle Wilson, Sophie Collyer, Megan Curran, and Christopher Wimer. Assessing the Potential Impacts of Refundable State Child Tax Credit Designs on Child Poverty. Center on Poverty and Social Policy, Columbia University, April 21, 2025. https://povertycenter.columbia.edu/publication/2025/refundable-state-child-tax-credit-designs
- 11. Vinh, Ryan, Danielle Wilson, Sophie Collyer, Megan Curran, and Christopher Wimer. Assessing the Potential Impacts of Refundable State Child Tax Credit Designs on Child Poverty. Center on Poverty and Social Policy, Columbia University, April 21, 2025. https://povertycenter.columbia.edu/publication/2025/refundable-state-child-tax-credit-designs
- 12. For more information on the importance of early childhood development, see: https://developingchild.harvard.edu/.
- 13. These thresholds mirror the original federal Child Tax Credit income phase-out from 1997. This threshold remained in place until the temporary increase under the Tax Cuts and Jobs Act of 2017 (TCJA) that expanded eligibility for the full credit to families with up to $400,000 in income, which was since made permanent.
- 14. For a detailed review of the history of the CTC, see Waldfogel (2025, chap 2).
- 15. Sophie Collyer, David Harris, and Christopher Wimer, “Left Behind: The One-Third of Children in Families Who Earn Too Little to Get the Full Child Tax Credit,” Poverty and Social Policy Brief, vol. 3, no. 6, Center on Poverty and Social Policy, Columbia University, May 13, 2019. https://povertycenter.columbia.edu/publication/2019/children-left-behind-in-child-tax-credit
- 16. Kalee Burns, Liana Fox, and Danielle Wilson. “Child Poverty Fell to Record Low 5.2% in 2021.” U.S. Census Bureau, September 13, 2022. https://www.census.gov/library/stories/2022/09/record-drop-in-child-poverty.html
- 17. Kalee Burns and Liana E. Fox, “The Impact of the 2021 Expanded Child Tax Credit on Child Poverty,” U.S. Census Bureau, SEHSD Working Paper #2022-24, November 2022. https://www.census.gov/content/dam/Census/library/working-papers/2022/demo/sehsd-wp2022-24.pdf
- 18. Sophie Collyer, Megan Curran, and David Harris. Children Left Behind by the Child Tax Credit in 2023. Poverty and Social Policy Brief, vol. 8, no. 5, Center on Poverty and Social Policy, Columbia University, October 10, 2024. https://povertycenter.columbia.edu/publication/2024/children-left-behind-by-the-child-tax-credit-in-2023
- 19. The final bill has been referred to as the “One Big Beautiful Bill Act” (OBBBA), but is formally known as the budget reconciliation bill, H.R.1. In this report, we refer to the final bill as OBBBA.
- 20. Sophie Collyer, Christopher Yera, Megan Curran, David Harris, and Christopher Wimer. Children Left Behind by the H.R.1 “One Big Beautiful Bill Act” Child Tax Credit. Poverty and Social Policy Brief, vol. 9, no. 5. Center on Poverty and Social Policy, Columbia University, August 6, 2025. https://povertycenter.columbia.edu/publication/2025/children-left-behind-by-child-tax-credit-reconciliation
- 21. Independent estimates indicate that close to 2.7 million U.S. citizen and legal permanent resident children are in families where no parent has an SSN. see: Lisiecki et al. 2025. What will deportations mean for the child welfare system? Washington DC: Brookings Institution.
- 22. Steve Wamhoff, Michael Ettlinger, Carl Davis, Jon Whiten. How Will the Trump Megabill Change Americans’ Taxes in 2026? Institute on Taxation and Economic Policy, July 22, 2025. https://itep.org/how-will-trump-megabill-change-americans-taxes-in-2026/
- 23. Sophie Collyer, Christopher Yera, Megan Curran, David Harris, and Christopher Wimer. Children Left Behind by the H.R.1 “One Big Beautiful Bill Act” Child Tax Credit. Poverty and Social Policy Brief, vol. 9, no. 5. Center on Poverty and Social Policy, Columbia University, August 6, 2025. https://povertycenter.columbia.edu/publication/2025/children-left-behind-by-child-tax-credit-reconciliation
- 24. Neva Butkus. Which States Expanded Refundable Credits in 2025? Institute on Taxation and Economic Policy, July 24, 2025. https://itep.org/state-child-tax-credits-earned-income-tax-credits-2025/
- 25. In 2020, the states with CTCs were Arizona, California, Idaho, New York, Oklahoma, and Maine. See Butkus (2025) for additional details.
- 26. Neva Butkus. When Did Your State Enact a Child Tax Credit? Institute on Taxation and Economic Policy, July 30, 2025. https://itep.org/when-did-your-state-enact-a-child-tax-credit-2025/
- 27. Idaho’s Child Income Tax Credit is set to sunset unless action is taken by lawmakers before January 1, 2026. See Sophie Collyer, Megan Curran, Aidan Davis, David Harris, and Christopher Wimer, State Child Tax Credits and Child Poverty: A 50-State Analysis, Institute on Taxation and Economic Policy and Center on Poverty and Social Policy, Columbia University, April 2022. https://itep.org/state-child-tax-credits-and-child-poverty-50-state-analysis/ and Neva Butkus, State Child Tax Credits Boosted Financial Security for Families and Children in 2025, Institute on Taxation and Economic Policy, September 11, 2025. https://itep.org/state-child-tax-credits-2025/
- 28. As noted earlier, Appendix A shows the local credit amounts that would reduce child poverty by 25 percent or 50 percent after the federal and state credits are already accounted for. The latter is a more ambitious antipoverty target for children.
- 29. Figure 3 presents our best estimates of the current poverty rates in each city based on the most recent available data from the American Community Survey (ACS) Supplemental Poverty Measure research files. The effects of federal and state Child Tax Credits in 2025 were modeled for each city. See Appendix B for additional information on the data and state Child Tax Credit parameters used to produce these estimates.
- 30. Note that the federal Child Tax Credit was recently changed under OBBBA, which was passed in July 2025. The federal credit examined here reflects the changes instituted under this new law. This version of the federal Child Tax Credit requires dependent children and at least one parent to have a Social Security Number in order to claim the credit. Our model does not account for immigration status, which may result in overestimates of the federal credit’s poverty reduction effects.
- 31. Note that in many analyses by ITEP, CPSP, and other researchers, the effects of state CTCs are estimated by comparing the poverty rate without the state CTC (but with the federal CTC) to the poverty rate after accounting for the state CTC. This analysis is different as we are comparing the poverty rate without the federal and state CTCs to the poverty rate after accounting for both of these policies. These estimates are therefore less comparable to other results examining the anti-poverty effects of state CTCs.
- 32. For a more in-depth analysis of the differences between state-level Child Tax Credit policies, see Vinh et al. (2025) and Butkus (2025).
- 33. For a fuller treatment of how state CTC design choices affect poverty reduction, see Vinh et al. (2025).
- 34. 2025 dollar values are estimated based on legislated dollar amounts and prescribed indexation of dollar amounts for inflation. See Vinh et al 2025 Appendix Table B1 for legislated dollar amounts in the year of latest legislation and indexation methodology details. Actual 2025 dollar amounts may differ slightly from reported here based on state indexation formulae.
- 35. Additional details are available at Colorado General Assembly. House Bill 24-1311: Family Affordability Tax Credit. 2024 Regular Session. https://leg.colorado.gov/bills/hb24-1311
- 36. ITEP analyzed Governmental Activities Revenues using each city’s FY 2023 Annual Comprehensive Financial Report (ACFR). We did not use General Fund expenditures due to inconsistencies in how cities spend their funds. In our model, the more widely available credit begins phasing out at a rate of 5 percent for families with annual adjusted gross incomes above $110,000 for joint filers and $75,000 for heads of household.
- 37. In our model, the more widely available credit begins phasing out at a rate of 5 percent for families with annual adjusted gross incomes above $110,000 for joint filers and $75,000 for heads of household.
- 38. https://povertycenter.columbia.edu/publication/2025/children-left-behind-by-child-tax-credit-reconciliation
- 39. More details available on the Geocorr website: https://mcdc.missouri.edu/applications/geocorr.html.
- 40. See Lin (2020) for additional details on this U.S. Census Bureau’s approach to developing tax units and Collyer et al. (2025) for information on how this methodology was applied in the ACS.