Executive Summary
This report contains ITEP’s analysis of the distributional impact and revenue potential of a variety of flat-rate income tax options for Alaska, based on draft legislation provided by the Legislative Budget and Audit Committee. Each option examined in this report is levied at a rate of 2.5 percent. That rate is applied to a variety of different tax bases, including two based on the federal government’s definition of Adjusted Gross Income (AGI) and four based on federal definitions of Taxable Income (TI).
The analysis was produced using ITEP’s Microsimulation Tax Model.[1] Its core findings include:
- The income tax options analyzed in this report would have raised between $526 million and $696 million if they had been in effect during Tax Year 2019. These amounts include tax payments by nonresidents ranging from $38 million to $51 million per year. A tax based on federal AGI with no standard deduction would raise the most revenue while a tax based on the federal definition of TI slated to take effect in 2026 would result in the lowest yield.
- Depending on the option, Alaska’s personal income tax under these proposals would rank somewhere between the second and fifth lowest in the country when measured relative to personal income. The tax would be roughly on par with those levied in Arizona, Ohio, Louisiana, and Kansas – all states with substantial statewide general sales taxes.
- All these taxes would apply to a broad swath of Alaska residents, including families at most income levels. A minimum wage worker without children could expect to pay between $4.54 and $10.58 per week depending on the option chosen. A married couple with two children earning the state’s median income ($75,000) could expect to pay between $19.04 and $34.13 per week. And a married couple with two kids earning $200,000 per year could expect to pay between $75.19 and $94.23 per week.
- While the statutory tax rate of each option examined in this analysis would be 2.5 percent, the exemptions and deductions available under most versions of the tax would allow all families to pay an effective tax rate below this level. We estimate that the middle 20 percent of Alaska households, for instance, would pay an average effective rate of between 1.2 and 1.9 percent of their income, depending on the option chosen. Effective tax rates would be somewhat lower for lower-income families and somewhat higher for upper-income families.
- A significant portion of the revenue raised would come from higher-income families, though their contributions would closely track their share of statewide income. For instance, the top 5 percent of Alaska households – those earning over $237,000 in 2019 – received about 29 percent of all income in the state that year. Under these options, they would contribute between 29 and 34 percent of the personal income tax dollars raised from Alaska residents.
- The various tax bases examined in this report offer a variety of advantages and disadvantages. Federal AGI affords a somewhat broader tax base, and somewhat higher revenue yield, than federal TI because the latter includes deductions for business income, charitable giving, mortgage interest, and property taxes, among other items. An AGI-based tax also offers more predictability because federal TI is scheduled to undergo major changes on Jan. 1, 2026 when most of the federal Tax Cuts and Jobs Act (TCJA) enacted in late 2017 expires. And an AGI base arguably offers Alaska lawmakers more control over their own tax structure because there would be fewer linkages to federal laws governing exemptions and deductions that are subject to change based on new legislation that may be enacted by Congress. On the other hand, the TI bases examined in this report include more sophisticated refinements for family size than the AGI bases.
- If Alaska lawmakers prefer a TI tax base, they may wish to decouple from certain features of federal TI that make little sense as state tax policy. Under the draft legislation provided by the Legislative Budget and Audit Committee, for instance, Alaska would not offer a circular state income tax deduction for state income taxes paid. This report also explores a reform under which the state would decouple from the federal government’s new 20 percent deduction for qualified business income (QBI) earned by certain pass-through businesses. This deduction was implemented at the federal level to bring corporate tax rates and pass-through business tax rates more closely in line but, as explained in this report, would have the opposite effect if it were included in Alaska’s state income tax law.
- For the options examined in this report, the size of the standard deduction is the most important driver of differences in effective tax rates for lower- and middle-income families. That is, options with larger standard deductions result in lower tax rates for these families compared to options with smaller standard deductions. At the top of the income scale, the presence or absence of itemized deductions and the QBI deduction tends to be more significant.
- Standard deductions significantly reduce taxes for families across the board, but they also significantly reduce the revenue yield of the taxes examined. For lawmakers interested in boosting the revenue yield of any given option, a higher tax rate or a lower standard deduction are therefore the two most impactful policy levers for accomplishing this goal. Supplementary analyses provided in this report illustrate that most families – especially lower- and middle-income families – would fare better under a higher tax rate as opposed to a lower standard deduction. High-income families, by contrast, tend to pay less under a lower tax rate even if the lower rate comes at the expense of a smaller standard deduction.
- Enactment of an income tax would likely be accompanied by other policy changes such as spending reductions, excise tax increases, or changes to the Permanent Fund Dividend (PFD) formula. Many of these options would have a regressive effect, meaning that lower- and middle-income families would be impacted more severely, relative to their incomes, than more affluent families. Against this backdrop, the distributional function of an income tax would be to partly offset the regressive nature of other policy changes. This report includes an analysis showing that if a flat-rate income tax were paired with a $500 cut to the PFD, for instance, the end result would be somewhat less regressive than if an income tax were omitted from such a package.
Introduction
Alaska lawmakers are facing an unprecedented fiscal crisis. The state is more dependent than any other on oil tax and royalty revenues but declines in oil prices and production levels have sapped much of the vitality of these revenue sources. One way of diversifying the state’s revenue stream and narrowing the yawning gap between state revenues and expenses would be to reinstitute a statewide personal income tax. Alaska previously levied such a tax until 1980.
This report contains revenue and distributional analyses of six flat-rate personal income tax designs, discusses differences between the tax bases employed under each option, and describes how each would compare to the personal income taxes already levied in 41 other states. The broad contours of the policy options contained in this report were not selected by ITEP, but rather were presented to us as draft legislation by the Legislative Budget and Audit Committee.
Overview of Flat Tax Options
Each of the state income tax options examined in this report has a few major features in common. They are levied at a flat rate of 2.5 percent. They are each linked to one of the federal government’s definitions of “income”: either Adjusted Gross Income (AGI) or Taxable Income (TI). And they include an exemption for PFD income, meaning that Alaska residents would not pay state tax on the PFD they receive each year.
The first two income taxes examined in this report are tied to federal AGI, with the only difference being that Option 1 taxes all AGI whereas Option 2 offers a standard deduction exempting the first $10,000 in earnings for single taxpayers and the first $20,000 for married couples.
The other four options examined in this report are based on federal TI. Option 3a is linked closely to TI as the federal government defines it for Tax Year 2021. Option 3b is very similar to Option 3a, with the only difference being that the state would not offer the federal government’s 20 percent deduction for certain business income. Option 3c is also similar to Option 3a, except that it would not allow for itemized deductions for expenses such as mortgage interest, property taxes, charitable giving, medical expenses, etc. And Option 4 examines what an Alaska income tax would look like under the permanent, modified version of federal TI scheduled to take effect in Tax Year 2026.
A summary of the major features of each of these six options is provided in Figure 1.
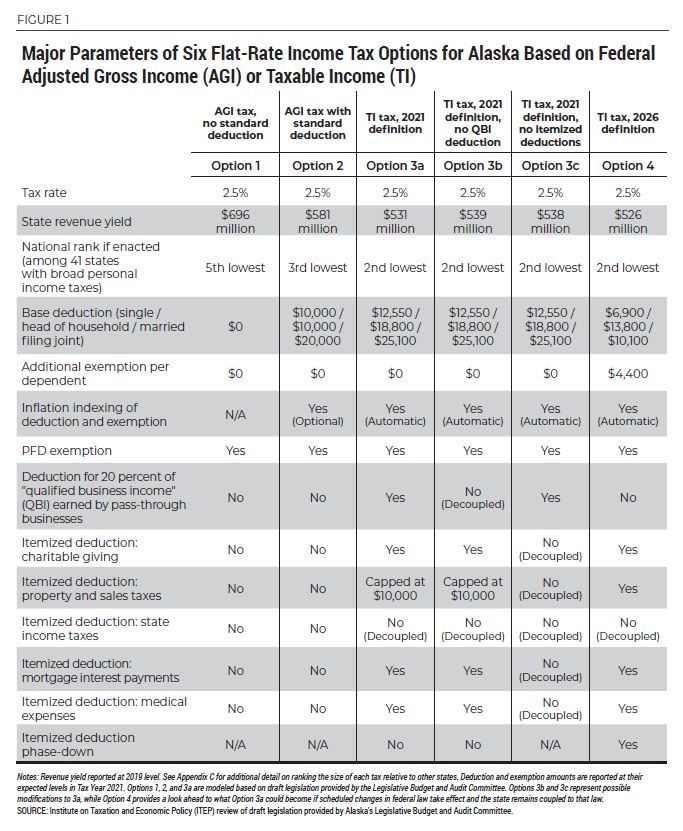
For the vast majority of families, and for state coffers, the most significant difference between these options is the size of the basic standard deduction they afford to Alaska taxpayers. The AGI tax with no standard deduction (Option 1) would tax the first dollar earned by each taxpayer. A tax based on the federal government’s definition of TI as it stands in 2021, by contrast, would exempt the first $12,550 in earnings from tax, or double that amount for married couples. The other options examined in this report fall between those two extremes.
Taxes with little or no standard deduction produce more revenue than taxes that include large standard deductions. But the absence of such deductions also makes income taxes less sensitive to ability to pay because even households with extremely low incomes would be required to pay tax. Low-income workers, for instance, would begin paying tax on their first dollar of earnings.
At the top of the income distribution, the standard deduction is comparatively less important and the most significant differences between the options examined are whether they allow for itemized deductions or a deduction for certain income earned by pass-through business owners (sole proprietorships, partnerships, S-corporations, etc.).
These issues are explored in detail in this report. Each option is examined in turn, starting with the option with the highest potential revenue yield (an AGI tax with no standard deduction) and ending with the option offering the lowest revenue potential (a TI tax based on the 2026 definition of TI).
It is important to note that the revenue estimates contained in this report are based on Tax Year 2019 information. The ongoing economic upheaval makes it impossible to estimate these taxes’ precise revenue yield in 2021, the soonest year they could take effect. Nonetheless, modeling against a Tax Year 2019 economy offers a reasonable basis for assessing the medium-run revenue potential of a flat-rate personal income tax.
Option 1: AGI Tax with No Standard Deduction
When designing an income tax, the first question that must be answered is how “income” will be defined. Every state has its own unique definition but most (31 states) start with a prepackaged definition available in federal law known as Adjusted Gross Income (AGI).[2]
Federal AGI is a broad definition of income that includes salaries, wages, business income, capital gains, dividends, interest, pensions, annuities, and Social Security income, among other sources. But AGI is not comprehensive. For instance, taxpayers can subtract amounts that they contribute to certain retirement or health savings accounts as well as some payments of student loan interest and certain payments of tuition and other education expenses.
A portion of Social Security income is also excluded from AGI (and from taxable income well). All people receiving Social Security income can exclude at least 15 percent of that income from their federal AGI. Families with more modest incomes can exclude more than 15 percent and some low-income families can exclude the entirety of their Social Security income from tax. Appendix B helps to illustrate the significance of this exclusion as it includes calculations of hypothetical tax bills for both working adults and elderly taxpayers receiving Social Security.
The first flat tax option examined in this report would apply a 2.5 percent rate to a slightly modified version of federal AGI. As with all the options examined in this report, it would exempt federal bond interest, as required by federal law, and would also exempt residents’ PFD income even though this income is taxable at the federal level. These state level exemptions, along with the other exclusions and adjustments mentioned above, contribute to pushing effective tax rates (tax as a share of income) below the statutory 2.5 percent level. Despite its headline tax rate of 2.5 percent, this option does not actually collect 2.5 percent of any group’s total income.
We estimate that a tax of this type would have generated $696 million if it were in effect in 2019, including $51 million from nonresidents.[3] The tax would be moderately progressive through most of the income distribution because it would include exemptions for PFD income and some Social Security income, among other exclusions and adjustments that are more significant to lower- and middle-income families.
Average tax bills would amount to $179 per year (or 1.5 percent of income) for the bottom 20 percent of Alaska households, $1,002 per year (or 1.9 percent of income) for the middle 20 percent, and $24,961 (or 2.0 percent of income) for the top 1 percent of earners.
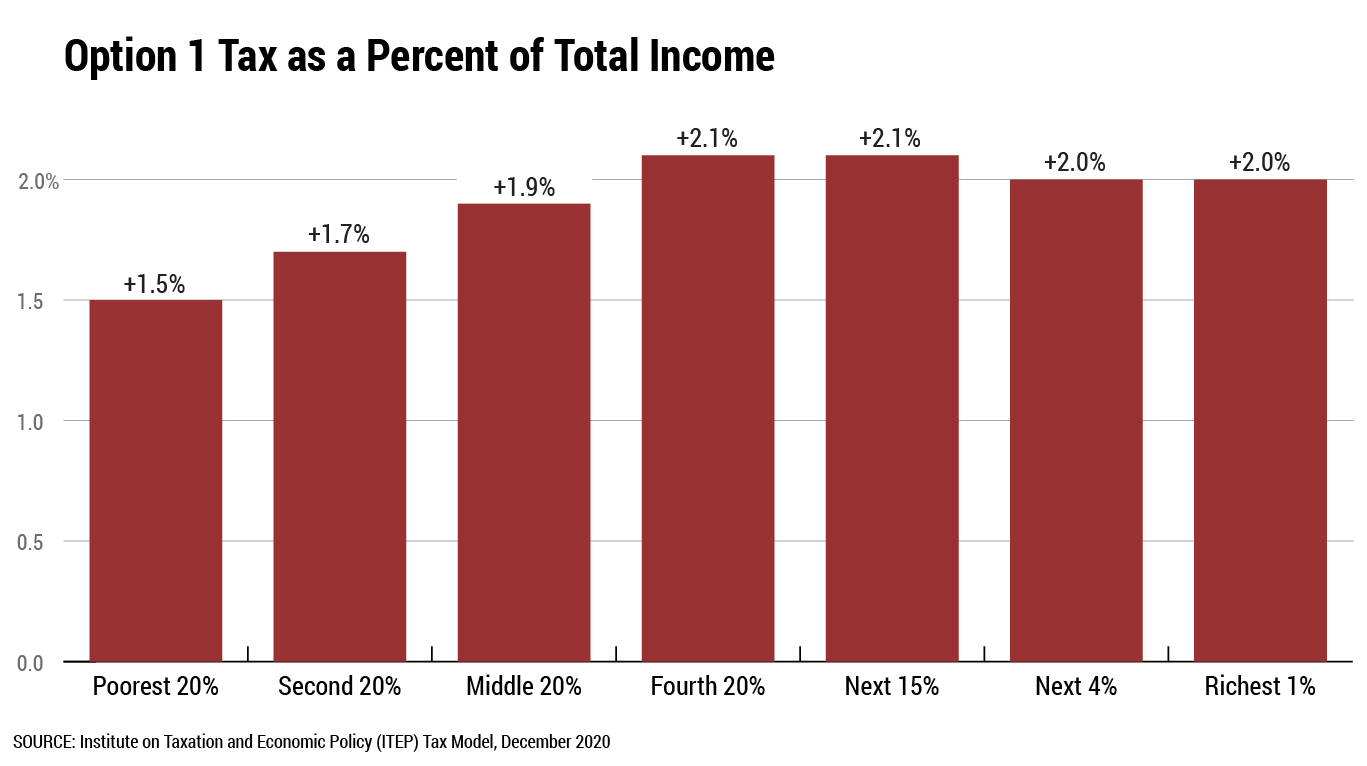
One unusual feature of this tax is that effective tax rates are higher, albeit only very slightly, on upper middle-income taxpayers (2.1 percent) than on the state’s top earners (2.0 percent). This is partly due to exclusions (such as tax-exempt bond interest) and adjustments (such as alimony subtractions) that are more useful to taxpayers at the very top of the income distribution. It is also partly driven by the fact that a larger share of business income and capital gains (which disproportionately flow to high-income taxpayers) are underreported to tax authorities as compared to the salaries and wages that make up the primary income source of most Alaskans.[4]
Throughout this report and in all of ITEP’s analyses, the definition of “income” used to calculate effective tax rates (such as those presented in Figure 2) is a comprehensive measure of cash income that goes beyond AGI in including items such as Social Security benefits, Worker’s Compensation benefits, VA benefits, and child support, as well as underreported and nonreported income. Including these items, among others, in our income calculations allows for a more complete assessment of taxpayers’ true ability to pay tax.[5]
Compared to the other options examined in this report, this option results in the highest tax bill on every income group we examined. It also produces the most revenue of any option included in the report.
This tax would require payments from nearly 9 in 10 (or 89 percent) of Alaska households.[6] While a significant portion (29 percent) of the revenue would come from the state’s top earners (defined as the top 5 percent of taxpayers, earning over $237,000 in 2019), it is important to note that these payments would be roughly in line with this group’s share of statewide income (29 percent of all income earned in Alaska flows to this group).
Option 2: AGI Tax with Standard Deduction
One potentially worrisome aspect of a flat tax lacking a standard deduction, or a similar tax reduction mechanism such as a personal exemption or credit, is the size of the tax payments such a tax requires even from families with very low incomes. Such a design can result in taxing the poor deeper into poverty.
Adding a standard deduction is one way to mitigate this effect by exempting a basic amount of income from tax for every household. Forty of the 41 states with broad-based personal income taxes allow a standard deduction or personal exemption to be claimed against that tax, with some states offering both. Pennsylvania is the only exception, and it offers a means-tested tax credit to lower-income families in lieu of either of these policies.
As seen below, standard deductions tend to bring down effective tax rates most steeply at the bottom of the income distribution, thereby also ensuring that taxpayers with a greater ability to pay face slightly higher effective tax rates than families of more modest means.
But a standard deduction would also significantly reduce the revenue yield of an Alaska income tax. We estimate that modifying the tax described in the previous section to include a basic standard deduction of $10,000 for single filers and heads of household, and $20,000 for married couples, would reduce the tax’s revenue yield by $114 million per year.[7] That is, Option 2 would yield $581 million annually (including $43 million from nonresidents) rather than the $696 million produced by Option 1.
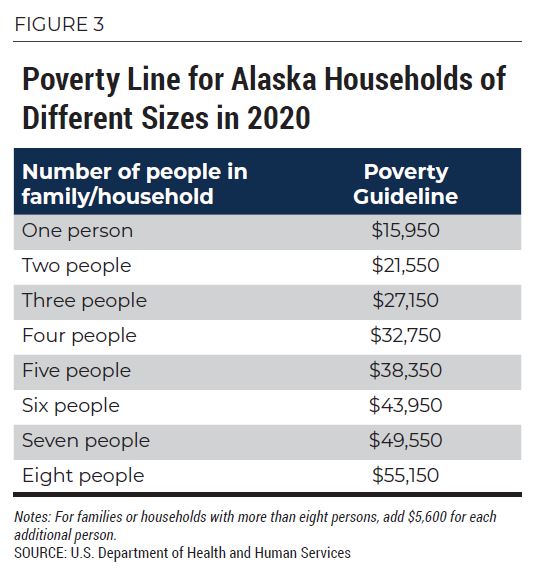 A standard deduction of this size would not be enough to fully exempt the poor from paying income tax. In Alaska, the official poverty line for a single taxpayer stands at $15,950 in 2020, for example.[8] For a single parent with two children, it stands at $27,150. Both these taxpayers would see their first $10,000 in earnings exempt from tax and would pay income tax on the rest. An unmarried person below the poverty line with annual wages of $14,000, for example, would pay $100 per year, or $1.92 per week, under this tax. A single parent with annual wages of $20,000 per year would pay $250 in tax per year, or $4.81 per week.
For married couples, the $20,000 standard deduction would do a somewhat better job of exempting families below the poverty line from paying tax, though some poor couples with children would still find that they would owe income tax. For example, a married couple with two kids earning $28,000 in wages per year, and receiving $4,000 in PFD payouts, would find themselves just below the official poverty line of $32,750. This family would owe $200 per year in tax, or $3.85 per week.
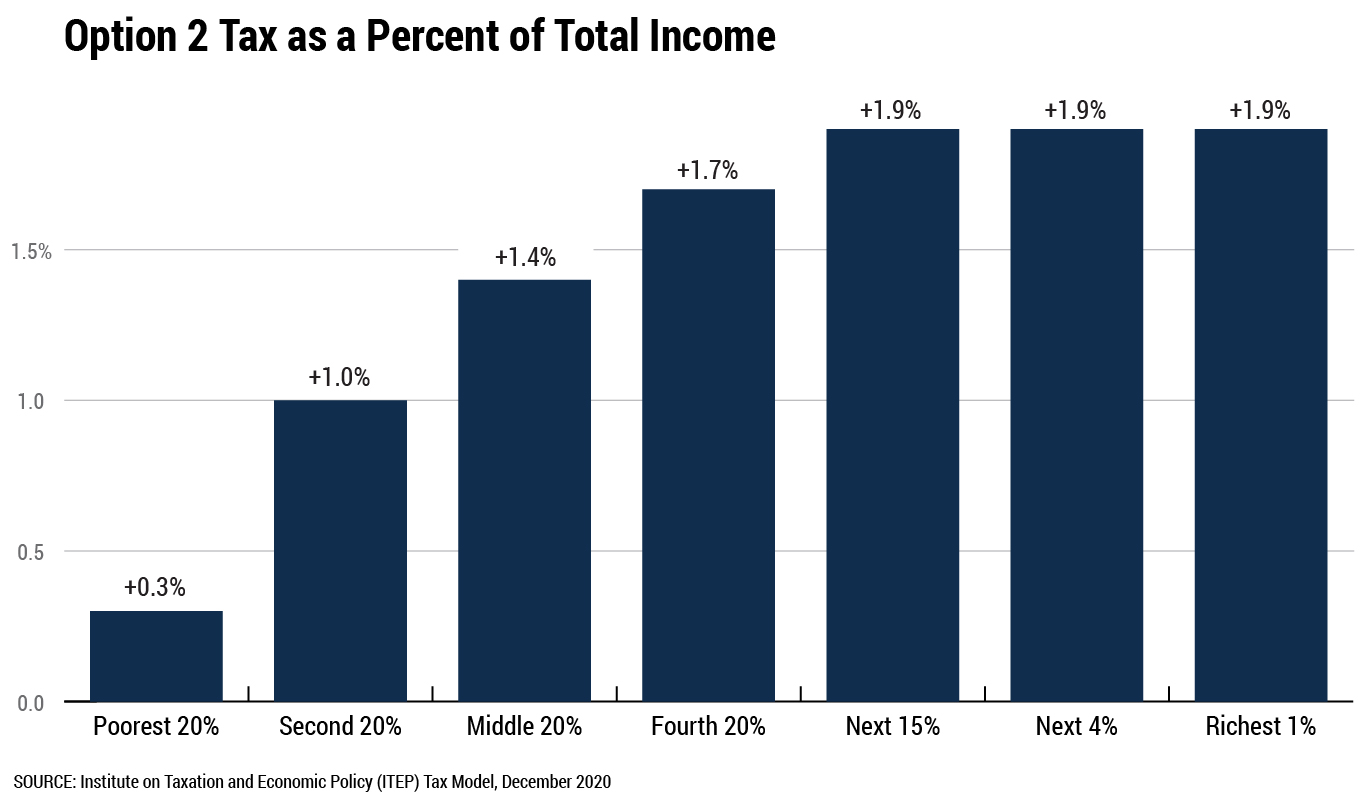
Using the ITEP Model, we calculate that average tax bills under Option 2 would amount to $43 per year (or 0.3 percent of income) for the bottom 20 percent of Alaska households, $729 per year (or 1.4 percent of income) for the middle 20 percent, and $24,547 (or 1.9 percent of income) for the top 1 percent of earners.
This tax would require payments from nearly 8 in 10 (or 78 percent) of Alaska households. One-third (33 percent) of the revenue would come from the state’s top earners (defined as the top 5 percent of taxpayers, earning over $237,000 in 2019). But these payments would be roughly in line with this group’s share of statewide income (29 percent of all income earned in Alaska flows to this group).
Compared to Option 1, tax bills under Option 2 would be lower across the income distribution. The most dramatic difference, measured as a percent of income, would be at the bottom where tax liability would be 1.2 percentage points lower under Option 2, at 0.3 percent of income rather than 1.5 percent. The middle 20 percent of earners would pay 0.5 percentage points less of their income in tax under Option 2 while the state’s top earners would pay 0.1 percentage points less.
These lower tax bills, relative to Option 1, are due entirely to the standard deduction. When claimed against a 2.5 percent tax rate, a $10,000 standard deduction would produce a maximum tax savings per household of $250 per year while the $20,000 deduction available to married couples would reduce income taxes by up to $500 per year. Families across the income distribution would receive these tax reductions but they are more consequential for families with lower and moderate incomes than they are to high-income families for whom a few hundred dollars per year might barely be noticed.
While standard deductions are made broadly available to taxpayers at all income levels in most states that offer them, there are some exceptions. In particular, a small but diverse group of states – including Alabama, Connecticut, Rhode Island, and Wisconsin – either reduce the standard deduction or deny it entirely for upper-income families.[9] This design results in a somewhat higher income tax revenue yield and reserves the deduction only for those families for whom it will matter most.
Option 3: TI Tax Based on 2021 Definition of TI
Adjusted gross income is not the only definition of income provided in federal tax law. Another version of draft legislation provided by the committee would use the federal government’s definition of taxable income (TI) as the starting point for defining personal income in Alaska tax law.
As a general matter, coupling to TI will make it somewhat more complicated for Alaska lawmakers to retain control of their state’s tax base than coupling to AGI. The calculation of federal TI involves many additional steps and therefore requires conforming Alaska’s tax code to a broader swath of federal law. Those federal laws are subject to change by future Congresses and federal TI tends to undergo more frequent and extensive changes than federal AGI. Alaska lawmakers will have the authority to decouple their own tax code from features of federal tax law regardless of whether the state couples to AGI or TI. But the more fluid nature of federal TI requires extra vigilance from lawmakers and staff to ensure that undesirable changes in federal tax law do not find their way into Alaska’s tax code.
At this moment in history, federal taxable income offers a highly uncertain tax base on which to build a state personal income tax. Taxable income is scheduled to undergo a major revision on Jan. 1, 2026 when most of the federal Tax Cuts and Jobs Act (TCJA) expires. Whether that will be allowed to occur, in full or in part, will likely not be known for several years and may depend on how each political party fares in the 2024 presidential and Congressional elections. The following discussion of Options 3a, 3b, and 3c use the definition of federal TI that is currently in effect and scheduled to remain in place through 2025. The subsequent discussion of Option 4 examines a potential Alaska income tax built on the modified definition of TI scheduled to take effect in 2026.
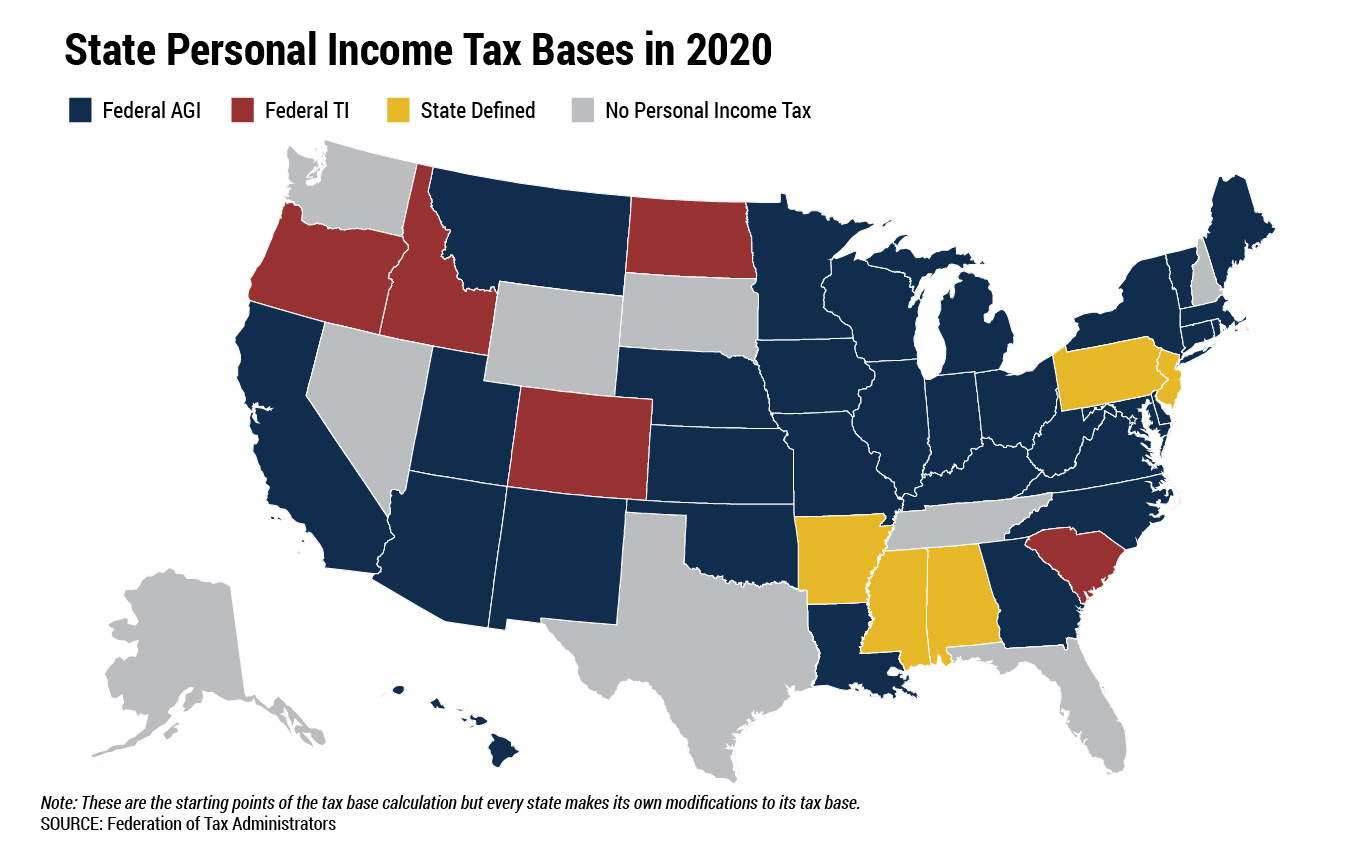
Federal TI is also a significantly narrower definition of income than federal AGI, so using this base would result in lower taxes on Alaska families and a lower revenue yield for the state. Federal TI is also a much less common starting point for state income tax law. Only 5 of the 41 states with broad-based personal income taxes link their tax codes to the federal definition of TI.[10]
The most significant difference between AGI and TI is that the latter is calculated after subtracting a sizeable standard deduction. Using a TI base in Alaska income tax law would result in a standard deduction for single taxpayers of $12,550 in 2021 (compared to $10,000 in Option 2 and $0 in Option 1). Heads of household filers – primarily single parents – would enjoy a much larger $18,800 standard deduction (compared to $10,000 in Option 2 and $0 in Option 1). And under a tax based on TI, married couples would enjoy a standard deduction of $25,100 (compared to $20,000 in Option 2 and $0 in Option 1). The standard deduction amounts in federal law are indexed to inflation and Alaska’s standard deduction would rise each year in lockstep with the federal deduction.
The next most significant difference between AGI and TI is that owners of pass-through businesses can deduct up to 20 percent of their qualified business income (QBI) when computing taxable income. These owners (including sole proprietors, partnerships, S corporations, and other businesses) pay tax on their incomes via the personal income tax code rather than the corporate tax code applying to C corporations. Linking Alaska’s income tax code to TI would therefore afford these businesses a state tax subsidy that would not be available to them under an AGI-based income tax. As explained below, however, there are compelling arguments against providing this deduction under an Alaska personal income tax. Option 3b examines a potential modification to the draft legislation that would generally remain coupled to federal TI but would deny the QBI deduction.
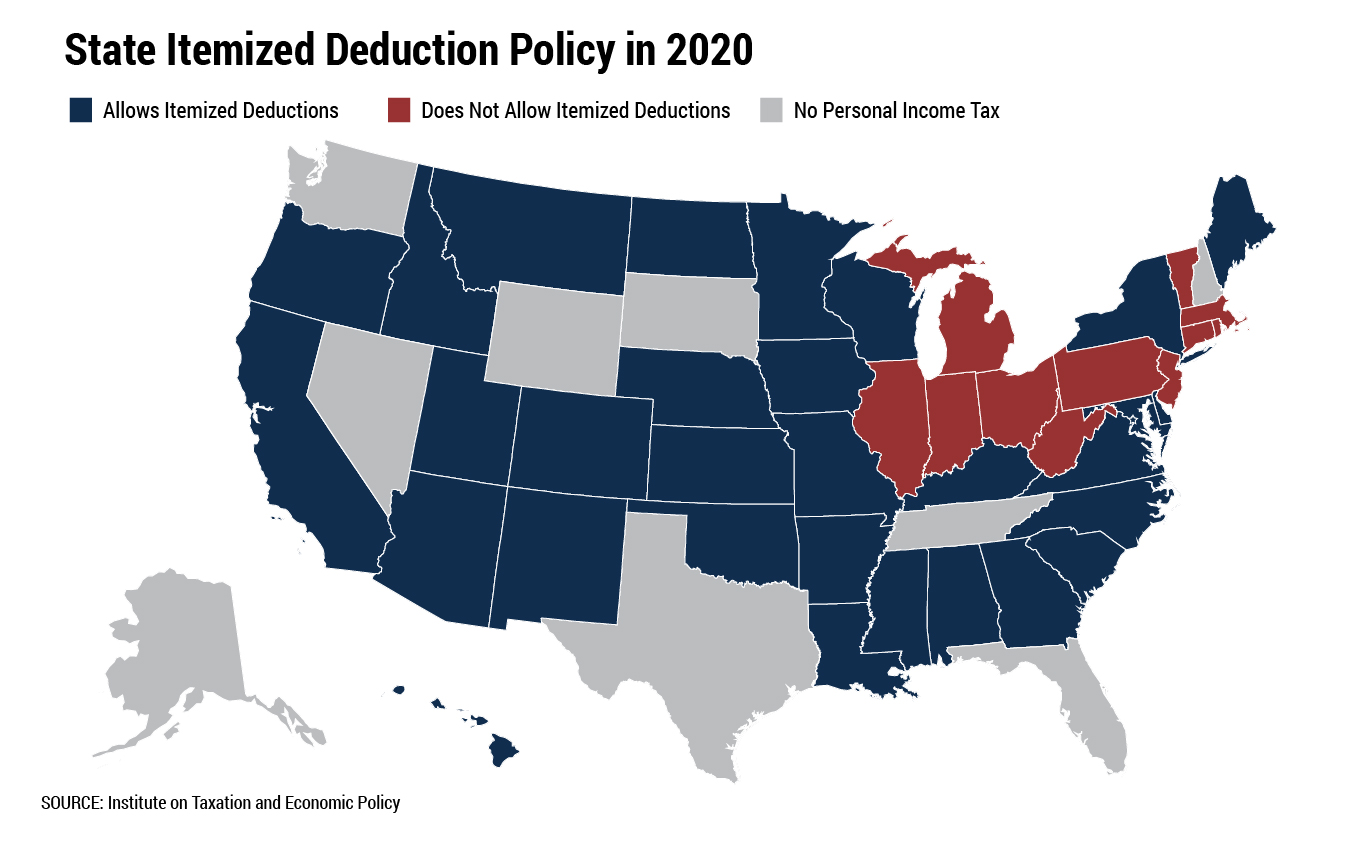
The third significant difference between AGI and TI is the availability of itemized deductions for expenses such as mortgage interest, property and sales tax payments, charitable gifts, and medical expenses. At the federal level, state income tax payments are partially deductible as well, but the draft legislation provided by the committee would deny this tax break at the state level, presumably because there is no policy rationale for allowing taxpayers to deduct a tax from itself.[11]
A large majority of Alaska households (more than 9 in 10) do not claim itemized deductions and those who do tend to have high incomes. In Alaska, just four percent of filers with income below $100,000 claimed itemized deductions in 2018 compared to one-third of filers with income between $200,000 and $500,000 and more than half of filers with income over $500,000.[12] Option 3c examines the impact of modifying the draft legislation provided by the committee to deny itemized deductions of all types.
Option 3a: Baseline Case
This option analyzes the TI based flat tax contained in draft legislation provided by the committee. We estimate that this tax would have raised $531 million if it had been in effect in 2019, including $39 million from nonresidents. This is $50 million less than under Option 2, the AGI based flat tax with a standard deduction and $165 million less than Option 1, the AGI tax lacking a standard deduction.
As with Option 2, the standard deduction included in this tax would not fully insulate the poor from paying tax, though it would come closer to doing so.
Our distributional analysis indicates that the bottom 20 percent of earners would face an effective tax rate of just 0.1 percent of income, or $17 per year on average. The middle 20 percent would pay 1.2 percent of income on average, or $634 per year. And the top 1 percent of earners would pay 1.8 percent, or $22,944.
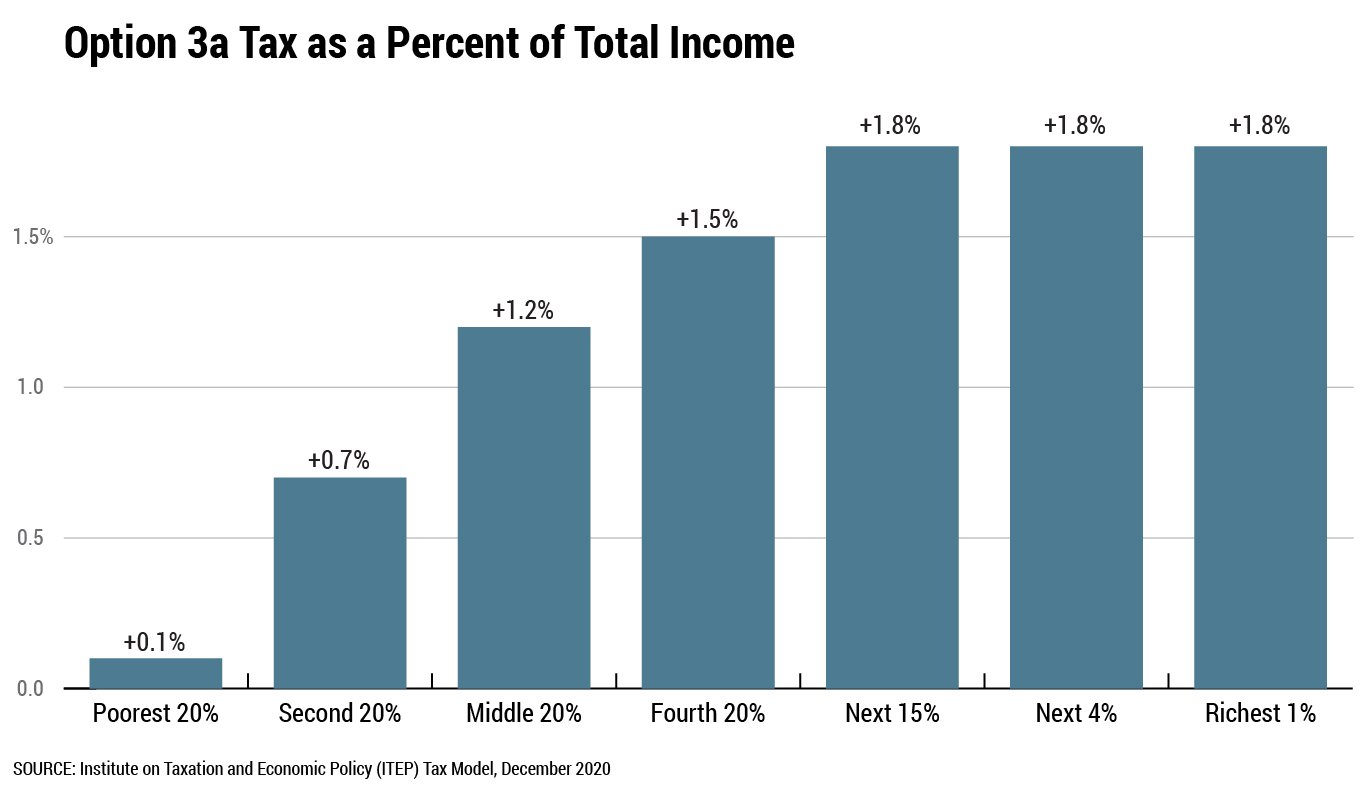
Relative to Option 2, Option 3a results in lower taxes across the income distribution in a way that is roughly proportional to income. As shown in Figure 7, most groups pay between 0.1 and 0.2 percent less of their income in tax under Option 3a. Measured in absolute dollar terms, however, the largest tax benefits of Option 3a, relative to Option 2, accrue to taxpayers at the top of the income distribution. We estimate that choosing Option 3a instead of Option 2 would produce an average tax bill that is $26 per year lower for low-income families, $95 per year lower for middle-income families, and $1,603 per year lower for the state’s top 1 percent of earners.
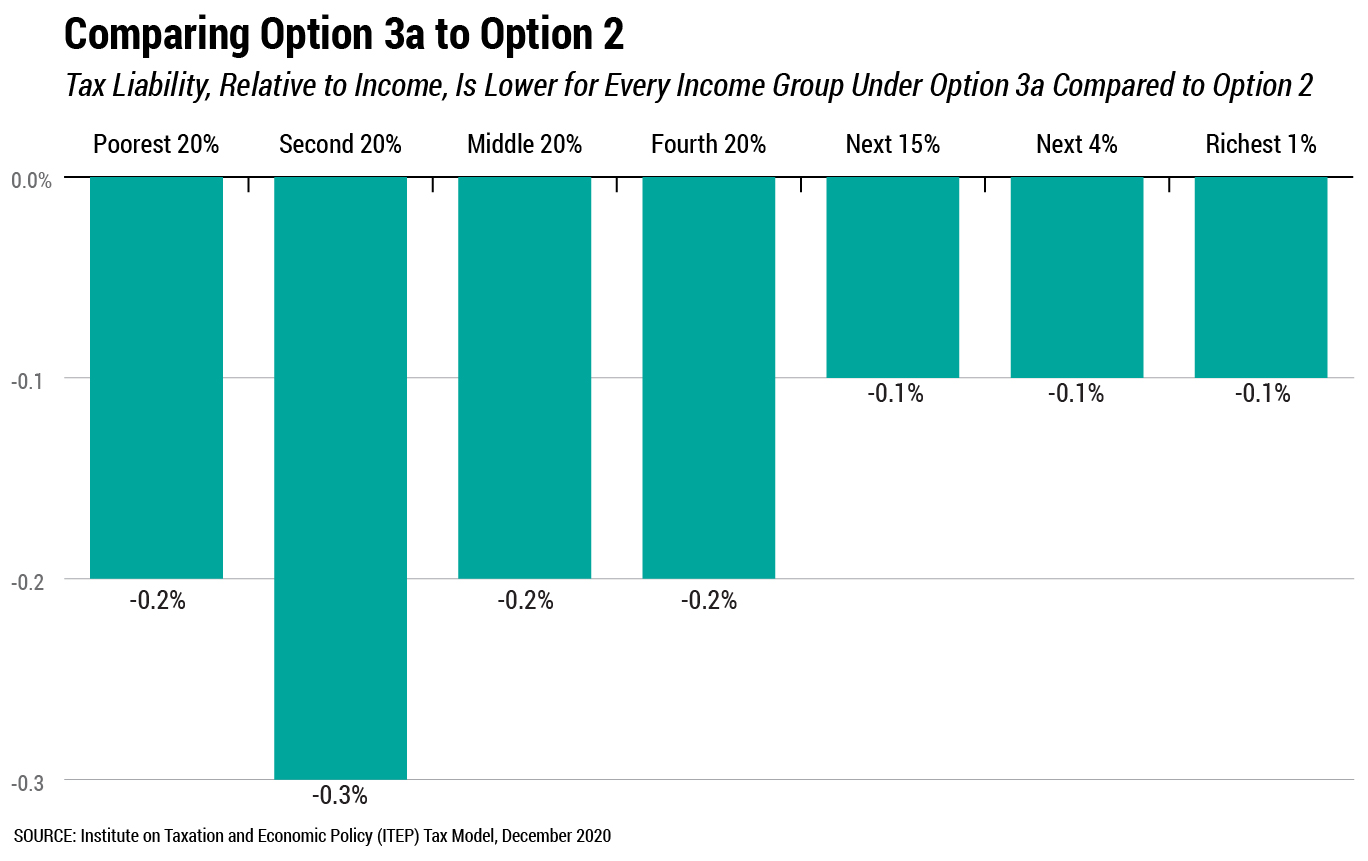
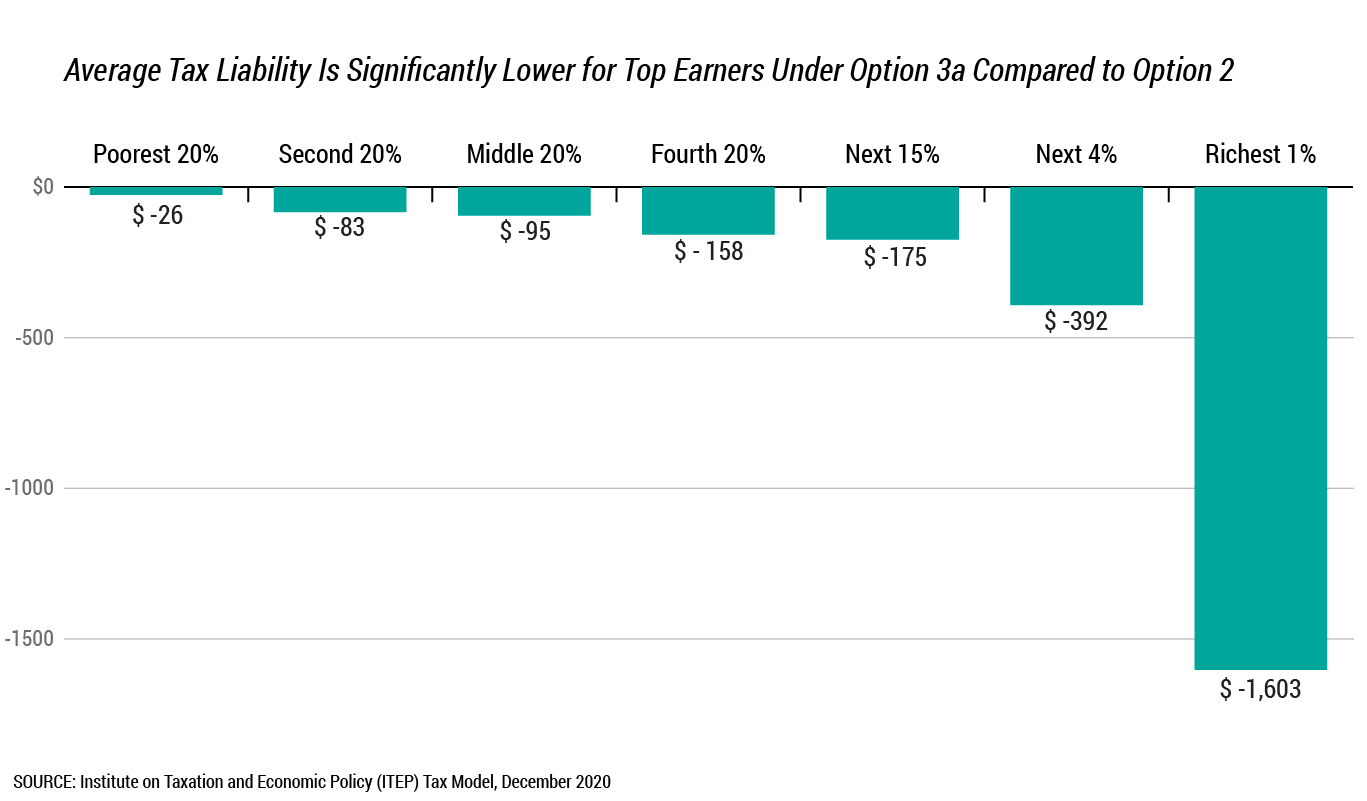
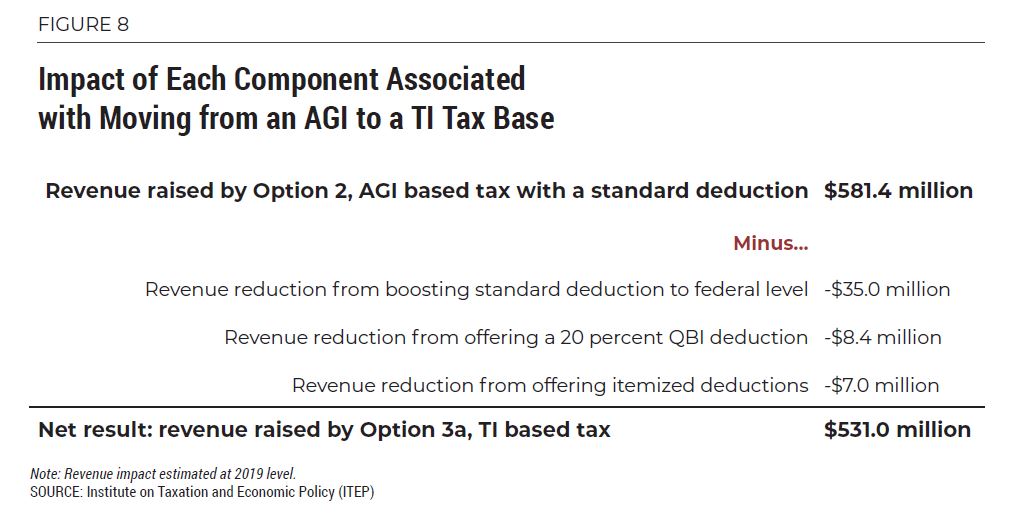
Figure 8 helps to illuminate the source of these tax cuts by showing the relative importance of each of the three major changes associated with moving from Option 2 to Option 3a. Increasing the standard deduction in line with the federal amounts reduces revenue by $35 million relative to Option 2 and is the source of the tax cuts seen throughout most of the income distribution. Offering a 20 percent deduction for qualified business income reduces revenue by an additional $8.4 million and is overwhelmingly geared toward higher-income earners, as discussed in the next section describing Option 3b. And offering itemized deductions reduces revenue by a further $7 million per year and is also generally more favorable to upper-income families, as seen in the section pertaining to Option 3c.
Option 3a would require payments from nearly three-fourths (or 72 percent) of Alaska households – a figure somewhat lower than under Option 1 (89 percent) or Option 2 (78 percent). While a significant portion (33 percent) of the revenue would come from the state’s top earners (defined as the top 5 percent of taxpayers, earning over $237,000 in 2019), it is important to note that these payments would be roughly in line with this group’s share of statewide income (29 percent of all resident income earned in Alaska flows to this group).
Option 3b: TI Based Tax Decoupled from QBI Deduction
While all the taxes examined in this report involve a linkage to federal law, they each also build unique, Alaska-specific rules on top of federal income definitions. For example, each piece of draft legislation reviewed by ITEP adds an exemption for PFD income and the TI based tax denies the deduction for state income taxes paid. If lawmakers choose to pursue a TI based tax, they may wish to further modify that TI base to forgo the 20 percent deduction for pass-through businesses’ qualified business income (QBI). This is known as partially “decoupling” state law from a feature of federal law.
The 20 percent QBI deduction is a new feature of federal law, first taking effect on Jan. 1, 2018. The deduction has been highly controversial, attracting criticism because of its regressive impact, significant revenue loss, and the distortionary effects related to treating business income more favorably than wages and salaries.[13]
But in the context of a potential Alaska state income tax, an even more fundamental objection to the QBI deduction emerges. Congress’s primary legislative intent in enacting the QBI deduction was to narrow the gap between the tax rates faced by different types of businesses. In the context of Alaska tax law, however, offering a QBI deduction would have exactly the opposite effect.
Prior to 2018, the federal statutory tax rate faced by C corporations (35 percent) was in close alignment with the top statutory tax rate faced by highly profitable pass-through businesses paying the personal income tax (39.6 percent). The 2017 federal tax overhaul enacted in the Tax Cuts and Jobs Act (TCJA) drove a much larger wedge between these statutory rates by cutting the rate on C corporations to 21 percent while reducing the top personal income tax rate to 37 percent. In other words, different types of businesses now face a 16-percentage point differential in their federal statutory tax rates.
To narrow this gap, the authors of the TCJA invented the QBI deduction. For qualifying business owners, the deduction effectively reduces their top federal income tax rate by 20 percent, from 37 to 29.6 percent. This cuts the gap between corporate and pass-through business tax rates nearly in half, from 16 to 8.6 percentage points.
But the situation in Alaska is very different than at the federal level. Currently, C corporations in Alaska see their profits taxed at state rates ranging up to 9.4 percent while pass-through businesses see no tax at all levied on their profits. Florida is the only other state that taxes C corporations without taxing pass-through businesses, as ITEP explained in testimony before the House Labor and Commerce Committee in 2017.[14]
Against this backdrop, imposing a 2.5 percent income tax on pass-through business income and other forms of personal income would narrow the gap in state tax rates faced by different business forms from a maximum of 9.4 percentage points down to 6.9 percentage points instead. Offering a QBI deduction against that personal income tax, which would effectively cut the pass-through tax rate from 2.5 to 2.0 percent, would lessen the ability of an Alaska personal income tax to narrow that gap. In other words, offering a QBI deduction under an Alaska income tax would widen the gap in tax rates levied on different business forms – precisely the opposite effect of the federal deduction.
Given that the central policy rationale of the QBI deduction is inapplicable in the context of an Alaska state income tax, lawmakers may wish to decouple from this provision if they enact a state income tax based on federal TI. Because of this, we modeled an alternative version of a TI based tax that is nearly identical to the draft legislation provided by the committee (modeled as Option 3a), except that it omits the QBI deduction.
Relative to Option 3a, denying the QBI deduction boosts the revenue yield of the personal income tax by $8.4 million, from almost $531 million to more than $539 million per year. Over half of this revenue gain would come from the state’s top 5 percent of taxpayers.
Taxes as a share of income would not significantly change relative to Option 3a for any income group. The top 1 percent of earners would face an average increase equal to 0.07 percent of income while other groups would face increases of 0.04 percent or less.
Pass-through business owners would see a maximum impact equal to 0.5 percent of income – that is, the tax savings produced by claiming a 20 percent deduction against a 2.5 percent tax rate. Of course, most taxpayers do not own pass-through businesses and would therefore be unaffected by this change.
A full analysis of Option 3b is available in Appendix A. Relative to the AGI-based taxes analyzed under Options 1 and 2, the differences reflected here are a larger standard deduction and the availability of itemized deductions.
Option 3c: TI Based Tax Decoupled from Itemized Deductions
If lawmakers choose to enact a tax based on federal TI, itemized deductions are another area of the tax base they may wish to scrutinize. Most states that couple to federal law regarding itemized deductions make refinements to the package of deductions they offer under their own income tax laws.
The most common modification – which is included in the draft legislation we reviewed – is to deny the deduction for state income taxes paid. There is no tax policy justification for allowing taxpayers to deduct a tax from itself.
Alternative Approaches to Itemized DeductionsIf Alaska lawmakers decide that a state personal income tax should include itemized deductions, they have options for doing so while also reining in the cost of those deductions to the state budget and lessening the extent to which they flow to upper-income earners. As of Tax Year 2019, for instance, twelve states and the District of Columbia applied broad limits to itemized deductions such as a phase-down in the value of deductions that may be claimed by high-income earners, or a flat cap limiting the maximum amount that can be deducted. Our preliminary analysis of such options in Alaska suggests that employing an itemized deduction phase-down for high-income earners, based on the rules the federal government used prior to 2018 for its own itemized deductions, would boost the yield of Option 3a by slightly more than $1 million per year. An alternative reform capping each household’s maximum itemized deductions at twice the value of the standard deduction could raise more than $2 million annually. |
But other itemized deductions are also of questionable merit, particularly at the state level where lower tax rates water down the incentive effect of tax deductions.[15] Key justifications for the mortgage interest and charitable deductions, for instance, are that these write-offs may incentivize homeownership and philanthropy. Their ability to do so at the federal level is disputed, and at the state level they are surely even less effective. Offering a deduction against a 2.5 percent tax rate means that taxpayers will save just 2.5 cents for every dollar they spend on these expenses. It is unlikely that taxpayers will choose to purchase a home, or give to charity, based on such a meager savings.
Relative to Option 3a, denying all forms of itemized deductions would boost the yield of a TI based personal income tax by $7 million per year, from $531 million to $538 million. While the tax cuts afforded by itemized deductions are somewhat less tilted toward high-income taxpayers than the QBI deduction, they still flow overwhelmingly to upper-income taxpayers. Over half of the revenue gain associated with denying itemized deductions would come from the top 5 percent of taxpayers. But given the relatively small size of this reform, the distribution of taxes would not be fundamentally changed. The average tax change facing any income group would fall below 0.05 percent of income.
Eleven states levy broad-based personal income taxes without offering itemized deductions, including Rhode Island and Vermont which each repealed itemized deductions within the last decade.
A full analysis of Option 3c is available in Appendix A. Relative to the AGI-based taxes analyzed under Options 1 and 2, the differences reflected here are a larger standard deduction and the availability of the QBI deduction.
Option 4: TI Tax Based on 2026 Definition of TI
As mentioned above, the future of federal taxable income is highly uncertain. Major changes to TI are scheduled to take effect on Jan. 1, 2026 when most of the TCJA expires. Some members of Congress would like to see significant changes to TI enacted before then. The long-run future of federal TI will likely not be known for several years but the following discussion focuses on the version of TI currently written into law for Tax Years 2026 and later.
Absent a change in federal law, several tax cuts and tax increases will take effect in Tax Year 2026 through changes to the definition of taxable income. The following list includes just a few of the more significant examples:
Tax increases:
- The standard deduction will be dramatically reduced.
- The 20 percent deduction for QBI will be eliminated.
- A phase-down of itemized deductions for high-income taxpayers (known as “Pease”) will be reinstated.
Tax cuts:
- Personal and dependent exemptions will be reinstated.
- The $10,000 cap on deductions for property, sales, and income taxes will be eliminated.
Other notable changes to federal law scheduled for 2026 include increases in statutory tax rates and a dramatic reduction in the federal Child Tax Credit, but these would not impact the Alaska tax options examined in this report because they do not affect any federal definition of income.
The expiration of the TCJA is also scheduled to bring some comparatively minor changes to AGI starting in 2026. Changes to AGI include, for example, reinstating the exclusions from income for reimbursements that employers provide for moving expenses and bicycle commuting.
Because of the highly significant changes to TI that are currently scheduled to take place, we have modeled Option 4, which assumes that Alaska implements an income tax based on TI and remains linked to the definition of TI in the years ahead even as that definition undergoes major changes.
Under the draft legislation we reviewed the changes to federal law scheduled in 2026 would automatically flow through to Alaska tax law if the federal government allows them to occur. Moreover, any additional changes that might be enacted by federal lawmakers would also make their way into Alaska law automatically, unless state lawmakers enact legislation to decouple from those changes.
It is possible to modify the legislation to avoid these outcomes by linking Alaska law less closely to the federal tax code. Such an approach could set Alaska income tax law on a somewhat more stable course, with future changes in federal law only being adopted by the state upon specific approval of future state lawmakers. But doing so would negate some of the simplicity benefits of linking to a federal definition of income.
Put another way, if state lawmakers wish to utilize a tax base resembling federal taxable income, they can do so either through a simple connection to federal TI or through crafting their own state tax base in the image of federal TI as it exists today. The former approach is marginally simpler while the latter is more stable.
Figure 10 displays the distributional impact of Option 4. Under a tax based on the definition of TI scheduled to come back into effect in 2026, the bottom 20 percent of earners would face an effective tax rate of 0.2 percent of income, or $24 per year. The middle 20 percent would pay 1.2 percent of income on average, or $632 per year. And the top 1 percent of earners would pay 1.8 percent, or $23,410.
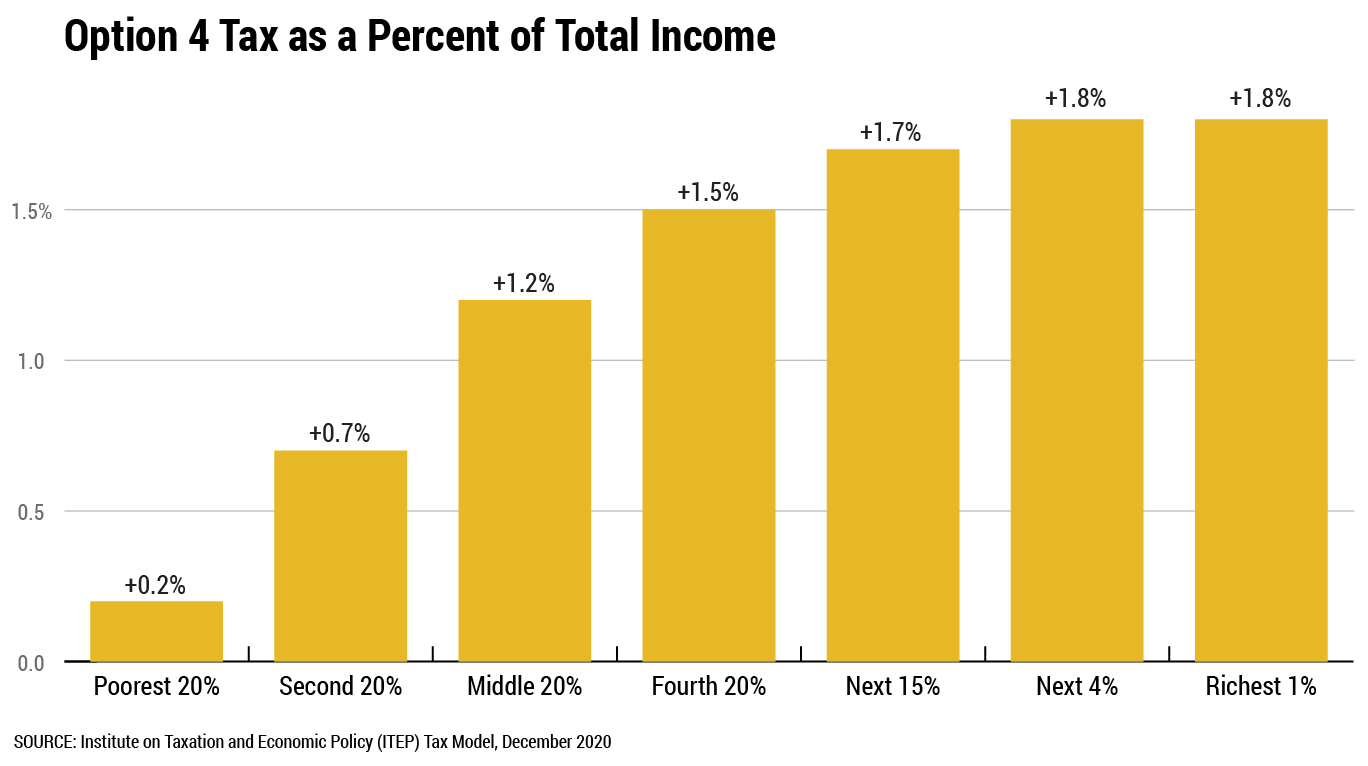
Interestingly, while the rules used to calculate TI in 2021 and 2026 are quite different, those differences do not lead to large changes in the distributional impact of this type of tax. Comparing Option 3a to Option 4, taxes as a percentage of income would change by less than 0.1 percentage point for each income group if the rules scheduled for 2026 take effect. Expressed in actual dollars, the largest average change would occur for the top 1 percent of earners, who would see their taxes rise by an average of $465 per year – in large part because of the expiration of the QBI deduction.

The difference in revenue yield between Options 3a and Option 4 is also modest. Calculated at constant Tax Year 2019 levels, switching from the tax base used under Option 3a to the base used under Option 4 would reduce state revenues by approximately $5 million, from $531 million to $526 million. Under Option 4, $38 million in revenue could be expected to come from nonresidents.
But while Option 3a and Option 4 do not look dramatically different in their overall distributional impact or their revenue yield, there are some families for whom the differences in tax structures used under these two options would be highly consequential. In particular, larger families would generally find Option 4 to result in a lower tax liability because of the reinstatement of flat dollar personal and dependent exemptions for each member of a household. This issue is explored in greater depth in a subsequent section of this report detailing the relationship between family size and tax liability under each option examined.
Comparing Distributional Impact of Flat Tax Options
The distributional impacts, by income level, of the options examined in this report are broadly similar, though there are a few notable differences. Figure 12 displays the impact of each of the four primary tax options as a percent of income (Options 3b and 3c are omitted for readability as they do not differ dramatically from Option 3a by this measure).
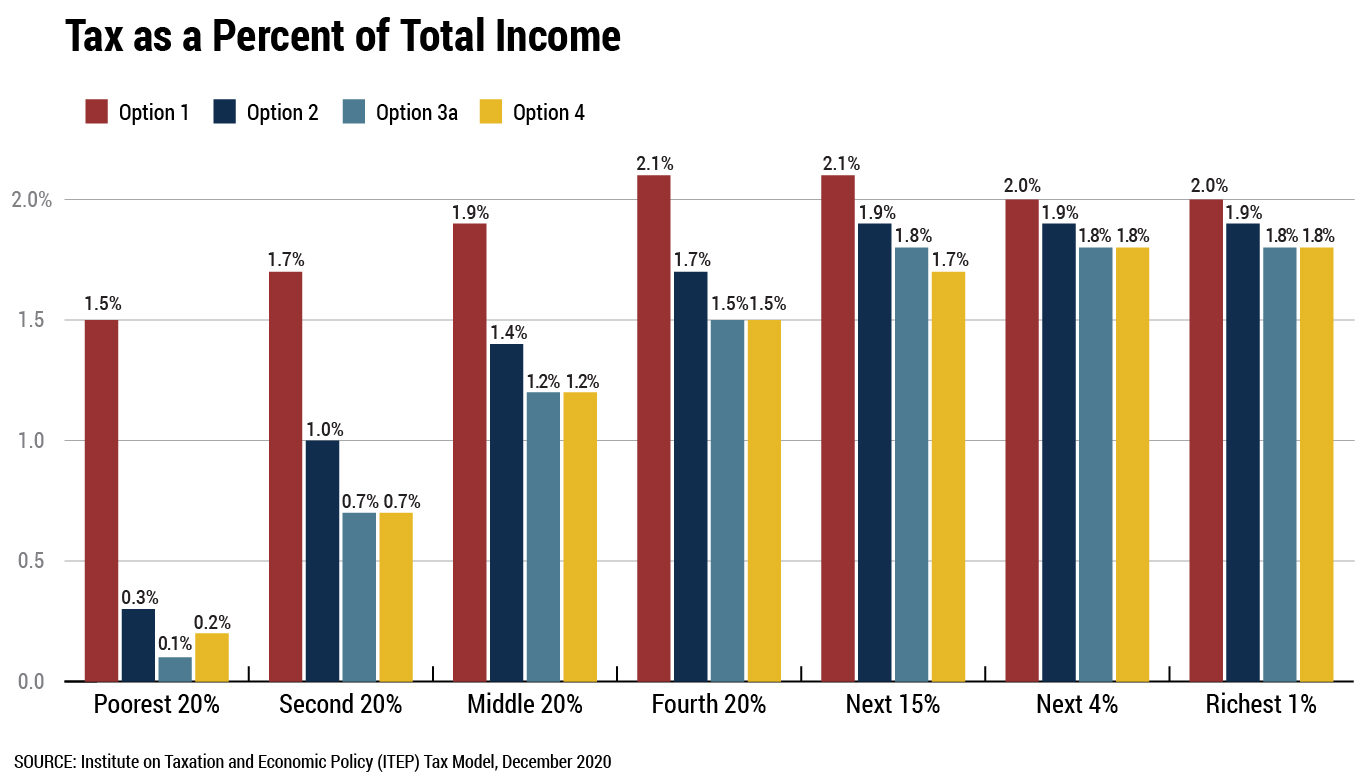
In this figure, Option 1 clearly stands out not just for levying the highest effective tax rates across the board, as is to be expected given its larger revenue yield, but for levying higher tax rates on lower and middle-income families in particular. This is because, unlike every other option examined, Option 1 does not include a standard deduction and instead taxes all AGI aside from families’ PFD income. Standard deductions cut taxes for families at all income levels but they are most important to lower- and middle-income families. While a $10,000 standard deduction allows a $50,000 earner to shelter 20 percent of their earnings from tax, for instance, that same deduction only shelters 5 percent of earnings for a $200,000 earner.
Similarly, the higher taxes on lower- and middle-income families levied under Option 2, relative to Options 3a and 4, is attributable to the fact that Option 2 includes lower baseline deductions than these other two options. The differences between each of these options’ standard deductions (and personal exemptions, in the case of Option 4) is summarized in Figure 1 near the beginning of this report.
Finally, Figure 12 also makes clear that the TI based options result in somewhat lower effective tax rates for high-income families than the AGI tax options. Under Option 4, this is due to the presence of a host of itemized deductions for mortgage interest, property taxes, charitable gifts, and other expenses that are more likely to be claimed by high-income families. Option 3a also includes these deductions, as well as an additional 20 percent deduction for certain business income that further brings down the effective tax rate paid by families at the very top of the income distribution.
In summary, the size of the standard deduction is the most important determinant of differences in effective tax rates for lower- and middle-income families, while the presence or absence of itemized deductions and the QBI deduction is more significant at the top of the income scale.
Comparing Options Based on Impact on Families of Different Sizes
While income level is the most important driver of tax liability under all the taxes examined in this report, family size can also affect tax liability – though it matters more under some structures than others. At the federal level and in many states, income tax laws are setup to take family size into consideration based on the notion that larger families face higher expenses and therefore have a reduced ability to pay taxes. A single taxpayer earning $50,000 per year, for instance, likely has a greater ability to pay than a family of four trying to live on that same level of earnings.
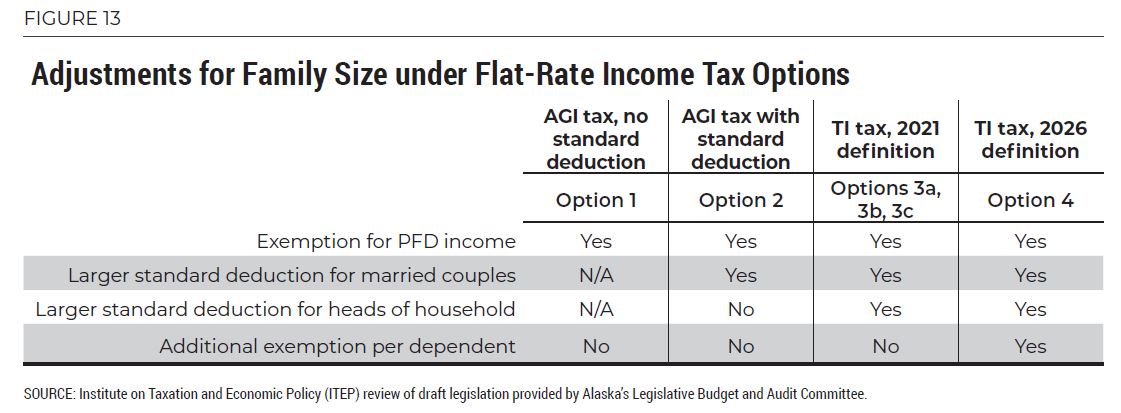
The only adjustment for family size shared across all six options in this report is the exemption for PFD income. Because the PFD is tied to family size, this exemption is worth more for larger families. Assuming a $1,000 PFD payout, for instance, an exemption from a 2.5 percent income tax would save a single taxpayer $25 per year, a married couple $50, a married couple with one child $75, and so forth.
Options 2, 3, and 4 each make an additional adjustment for family size in the form of a larger standard deduction for married couples than for single taxpayers. While single taxpayers can deduct a flat $10,000 from their taxable income under Option 2, for instance, married couples can deduct twice that amount, or $20,000. Options 3 and 4, which offer standard deductions in line with federal law, also offer a doubled standard deduction to married couples. This is necessary to avoid a marriage penalty under which two people filing as a married couple would pay more tax than would have been the case if they had each filed separately.
By linking to federal rules regarding standard deductions, Options 3 and 4 pick up an additional adjustment for family size specifically targeted toward head of household filers – a group primarily composed of single parents. Under both these options, heads of household receive a standard deduction roughly one and a half times the size of the deduction available to single taxpayers without children. Option 2, by contrast, offers the same standard deduction to single parents that it does to other single individuals.
Finally, Option 4 adds yet another adjustment for family size in the form of personal and dependent exemptions for most families. In accordance with federal law prior to 2018, these exemptions are gradually phased out for high-income taxpayers.[16] The exemption was set at $4,050 per person in 2017 – the last year in which it was in effect. When claimed against a 2.5 percent tax rate, an exemption of this size would result in a tax savings of up approximately $101 per person. Because the exemption was indexed to inflation, however, its nominal size and tax savings will be somewhat larger if allowed to come back into effect in 2026, as currently scheduled in federal law. It is worth noting that the personal income tax legislation passed by the Alaska House of Representatives in 2017 included a $4,000 exemption for each dependent in the home.[17]
It is important to note that both 2021 and 2026 federal law include refinements based on the number of children in the home. From 2018-2025, that refinement takes the form of an expanded Child Tax Credit, which does not impact federal AGI or TI and would therefore not show up in Alaska tax law under any of the options examined in this report. In 2026 and beyond, the Child Tax Credit is reduced but an additional refinement comes into effect through reinstated personal and dependent exemptions, which do affect taxable income and therefore could make their way into Alaska law.
In other words, the reason Option 4 includes an extra refinement for family size, relative to Option 3, is not because federal law adds such a refinement in 2026. Rather, it is because the federal refinement is scheduled to be restructured in a way that impacts federal taxable income.
Linking Alaska income tax law to federal taxable income produces unusual results over time regarding the tax’s ability to account for the number of dependents in the home. From 2021-2025, such a tax would include only a very modest adjustment for dependents in the home, in the form of the PFD exemption. From 2026 onward, however, such a tax would come to include a much more significant adjustment if the federal dependent exemption ends up coming back into effect.
The final two columns of the table provided in Appendix B illustrate this point. They show, for instance, that a married couple with two kids earning $50,000 per year could expect their tax liability to fall by 29 percent – from $520 to $370 per year – if the 2026 changes in taxable income take effect.
If Alaska lawmakers want to craft their own adjustment for family size rather than leaving that decision up to Congress, they have multiple options for doing so. Perhaps the most straightforward would be linking to federal AGI (as in Options 1 and 2) and building an Alaska-specific family size adjustment on top of that federal tax base. This adjustment could take the form of an exemption or credit for each member of the household and it could be done in addition to, or in lieu of, the standard deduction offered under Option 2.
Alternatively, a family size adjustment could be built on top of an Alaska income tax linked to federal TI, though in this case the tax would likely need to be selectively decoupled from the federal government’s shifting policy regarding personal and dependent exemptions.
Offering a state-designed exemption or credit per household member would not meaningfully complicate state tax administration. Designing such an adjustment at the state level, rather than piggybacking on the federal government’s unstable approach to this adjustment, would also provide significantly more predictability regarding the future trajectory of the state’s income tax code.
National Context
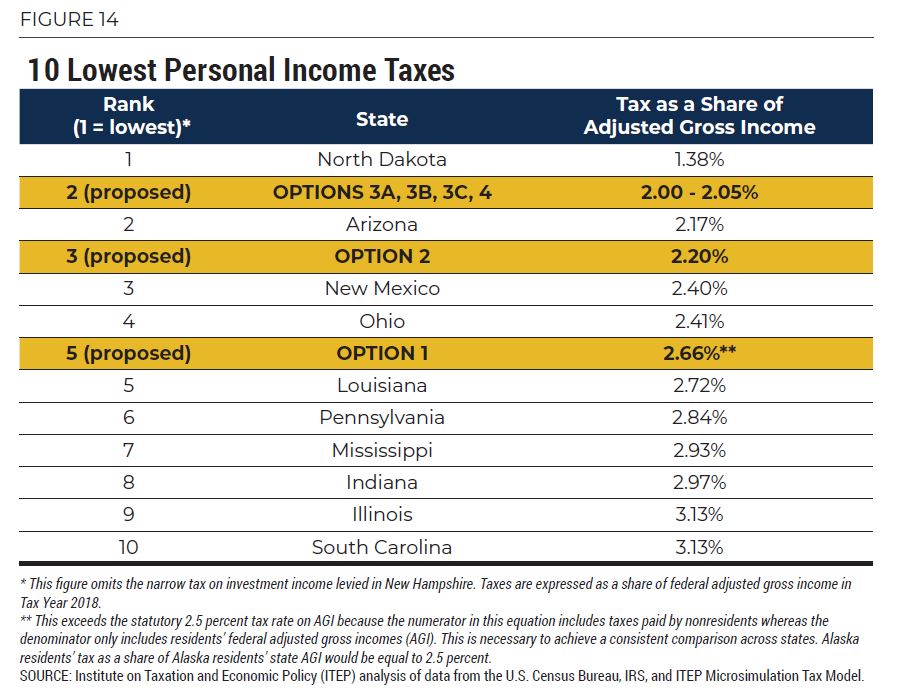
Any of the income tax options examined in this report would be exceptionally low relative to other states.
As seen in Figure 14, the taxes based on federal taxable income (Options 3a, 3b, 3c, and 4) would rank as the second lowest in the nation, after only North Dakota, when measured relative to residents’ incomes. An AGI-based tax with a standard deduction (Option 2) would rank as the third lowest, behind North Dakota and Arizona. And an AGI-based tax with no standard deduction would be the fifth lowest, behind North Dakota, Arizona, New Mexico, and Ohio. It is important to note that Ohio also have significant local-level income taxes that are excluded from this table, as do Pennsylvania and Indiana. Moreover, all the states that would have lower personal income taxes than Alaska also levy significant statewide general sales taxes. In fact, the lowest 22 personal income taxes in the country are all levied in states with general sales taxes.
Measuring taxes relative to income is the best way to gauge the true size of an income tax, given significant variation in both tax bases and rate structures across states. But another common, albeit more simplistic, way to compare income taxes is to look only at the top statutory tax rate. By this measure, any of the options examined in this report would rank as the lowest in the nation. Currently the lowest five states by this measure are North Dakota (2.9 percent top rate), Pennsylvania (3.07 percent flat rate), Indiana (3.23 percent flat rate), Michigan (4.25 percent flat rate), and Arizona (4.5 percent top rate).
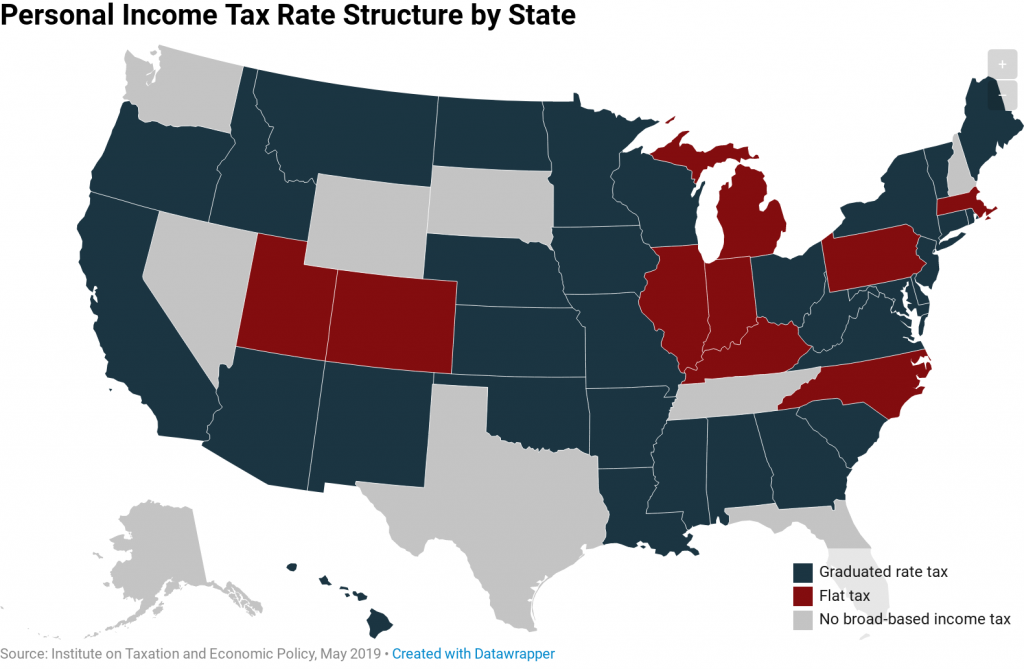
Compared to other states, Alaska’s personal income tax would also be somewhat unusual for being levied at a single, flat rate rather than using a system of tax brackets and graduated rates that rise as income rises. Thirty-two states levy income taxes with graduated rates while just nine states levy flat taxes.[18]
Illustrating Tradeoffs in Tax Base and Rate
Each of the options examined in this report raises a different amount of revenue. These differences can make it difficult to compare the distributional impact of tax base design choices across the options examined. To demonstrate the tradeoffs involved when choosing a tax rate and a tax base, this section examines a few scenarios where variations of Options 1, 2, and 3a are brought into alignment with each other at similar revenue levels, thereby making it easier to tease out the impacts of differences in tax base design. In other words, this section is meant to help answer the question: given a specific revenue goal, how do differences in income tax design affect each tax’s impact on families at different income levels?
Comparing AGI Taxes with and without a Standard Deduction
A flat tax without a standard deduction (Option 1) produces the highest revenue yield of any option examined in this report. It should therefore come as little surprise that Option 1 also results in higher taxes across the income spectrum relative to every alternative examined. But this does not necessarily have to be the case for every flat tax lacking a standard deduction. If Option 1 were levied at a lower rate – designed to raise the same amount as Option 2, for example – its impact compared to the other options would look quite different.

Figure 15 compares two flat-rate income taxes raising nearly identical amounts of revenue, at approximately $580 million per year.[19] In this comparison, Option 2 is unchanged but Option 1 is modified to be levied at a 2.1 percent tax rate, rather than its original 2.5 percent level.
Aside from differences in tax rate, the only other difference between the options examined in Figure 15 is the standard deduction: Option 1 includes no such deduction whereas Option 2 exempts the first $10,000 in income from tax for single taxpayers and the first $20,000 from tax for married couples.
As can be seen in Figure 15, Option 2 – with a standard deduction – results in lower taxes for most income groups despite being levied at a higher statutory rate than Option 1 (2.5 versus 2.1 percent) and despite raising an identical amount of revenue for the state. In this comparison, we estimate that more than 6 in 10 Alaska households (61 percent) would pay less under Option 2, compared to less than 3 in 10 (28 percent) that would pay more.
In each of the bottom three income groups, more than 8 in 10 households would pay less under Option 2. The fourth quintile is roughly the pivot point, where households are almost evenly split between the two options (55 percent would pay less under Option 2). Only among the top 20 percent of earners does Option 2 result in a higher tax bill for most households.
These results indicate that, for most families, forgoing a standard deduction (or offering a lower deduction) is a high price to pay for a lower tax rate. Most families would pay less under a flat tax that includes a standard deduction as opposed to an equivalently sized flat tax (in terms of revenue yield) that lacks such a deduction, even when the latter is levied at a lower tax rate.
Comparing an AGI Tax with a Lower Rate to a TI Tax
A flat tax on AGI with a $10,000/$20,000 standard deduction (Option 2) results in higher taxes across the board than a flat tax on TI (Option 3a) because the latter includes a larger standard deduction as well as additional deductions for business income, mortgage interest, property taxes, charitable contributions, and other expenses. As one would expect, Option 2 also results in a higher revenue yield than Option 3a.
But if Options 2 and 3a were brought into alignment by cutting the tax rate levied under Option 2, then the results would look quite different. Figure 16 compares Option 3a to an alternative version of Option 2 under which the rate is reduced to 2.29 percent, but the standard deduction is left unchanged. We estimate that these two options would generate nearly identical levels of revenue – $531 million per year. Put another way, basing an Alaska income tax on TI would require levying a 2.5 percent tax rate to generate the same level of revenue that could be produced by taxing the AGI base under Option 2 at just 2.29 percent.
As with the previous comparison, however, a lower statutory tax rate does not necessarily lead to lower tax bills for most families. Figure 16 shows that effective tax rates at the bottom and middle of the income distribution would be somewhat higher under a 2.29 percent AGI tax than under a 2.5 percent TI tax.
A plurality of households (44 percent) would pay more under this modified version of Option 2, with its 2.29 percent rate, while 34 percent of households would pay less.
Upper-middle income households would generally see lower tax bills under a modified Option 2, with its lower statutory rate. The average impact on the top 1 percent of earners does not differ dramatically between the two options because, although Option 2 offers a lower rate on most forms of income, Option 3a includes a preference for pass-through business income, which makes up a significant share of this group’s earnings.
Once again, this example illustrates that the option with the higher standard deduction (Option 3a) tends to produce lower tax bills at low- to moderate-income levels than the option with the lower tax rate (modified Option 2).

Comparing an AGI Tax with a Higher Standard Deduction to a TI Tax
The previous section demonstrated that even if the rate levied under Option 2 were reduced to yield a revenue amount in line with Option 3a, the latter would continue to result in a lower tax bill for a plurality of families. The reverse is true, however, if Option 2 is adjusted downward by boosting the standard deduction rather than cutting its rate.
The analysis in Figure 17 assumes an enhanced standard deduction under Option 2 of $13,800 for single taxpayers, $20,700 for heads of household, and $27,600 for married couples.[20] Boosting the standard deduction to this level (up from roughly $10,000 for single taxpayers and $20,000 for married couples) would reduce the revenue yield of this option to just under $531 million – an amount in line with Option 3a.
This version of Option 2 allows for a somewhat higher standard deduction than Option 3a, while raising an equivalent amount of revenue, because Option 2 does not forgo any revenue through deductions for pass-through business income, mortgage interest, property taxes, charitable contributions, and other itemized deductions.[21] Offering a higher standard deduction in lieu of this grab bag of deductions is beneficial to most families. We estimate that, relative to Option 3a, nearly 6 in 10 Alaska households (59 percent) would pay less under this modified version of Option 2 compared to 13 percent that would pay more.
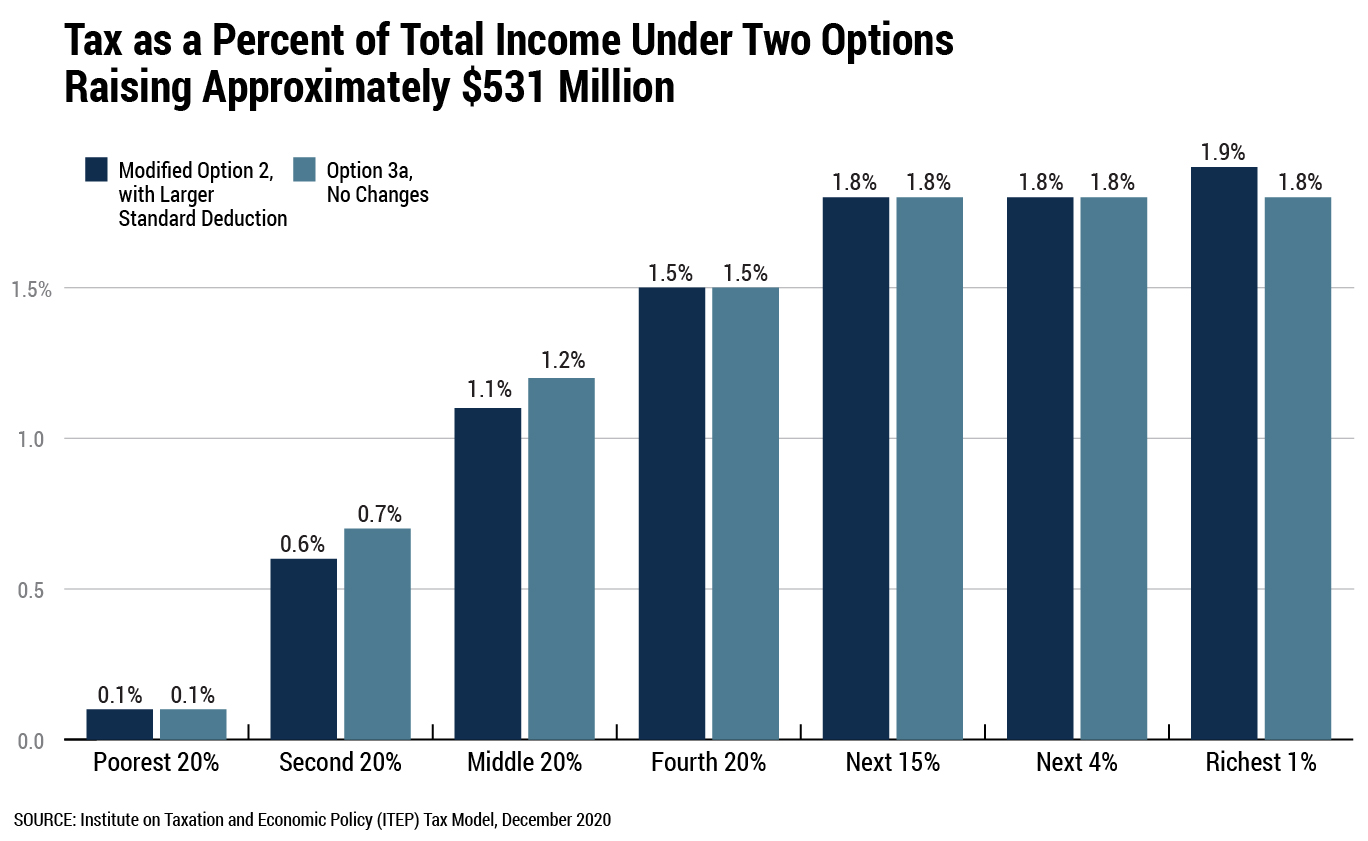
Among the middle 60 percent of earners, more than 3 out of 4 households (76 percent) would pay less under this version of Option 2 with the enhanced standard deduction. At the top, the percentages are flipped with just 18 percent of households among the top 1 percent of earners paying less under this iteration of Option 2 and the other 82 percent paying more.
These results should be unsurprising in their broad strokes. The QBI deduction and itemized deductions tend to be more beneficial to upper-income households and are in fact only claimed by a relatively small number of households. Forgoing those narrowly tailored deductions and offering a larger, broad-based standard deduction instead would naturally result in lower tax bills for most families.
Income Taxes and PFD Reductions
If Alaska lawmakers enact a personal income tax, this policy change will surely not be made in a vacuum. In practice, an income tax would be accompanied by other policy changes such as spending reductions, excise tax increases, or cuts to the PFD. When viewed against this backdrop, the moderately progressive nature of flat-rate income taxes can offer a partial counterbalance to other policy changes likely to have the opposite distributional impact.
For instance, unlike personal income taxes, excise tax increases on motor fuel, alcohol, and tobacco are regressive. This means that, when measured as a percentage of household income, these taxes fall most heavily on families with low and moderate incomes.[22]
Cuts to the PFD are also regressive. A flat cut to each family member’s PFD reduces income by a larger percentage for low- and middle-income families, who may rely on the PFD to make ends meet, than for high-income families for whom the PFD is a comparatively much less important source of income.
We estimate that in 2019, a $500 cut to the PFD would have reduced the income of the state’s lowest 20 percent of earners by 5.7 percent. Middle-income earners would have seen their income fall by 1.3 percent. And the state’s top 1 percent of earners would have faced a loss of income of less than 0.1 percent.
Figure 18 presents these results alongside the flat-rate income tax proposal labeled as Option 1 in this report. The net impact of these two policy changes would a $1 billion improvement to the state’s fiscal outlook: $696 million in new revenue from the income tax and $316 million in reduced outlays from the PFD reduction. The combined impact of these two policy changes would be regressive. The income tax somewhat lessens the regressive nature of the overall package, but it does not result in a progressive distribution overall.
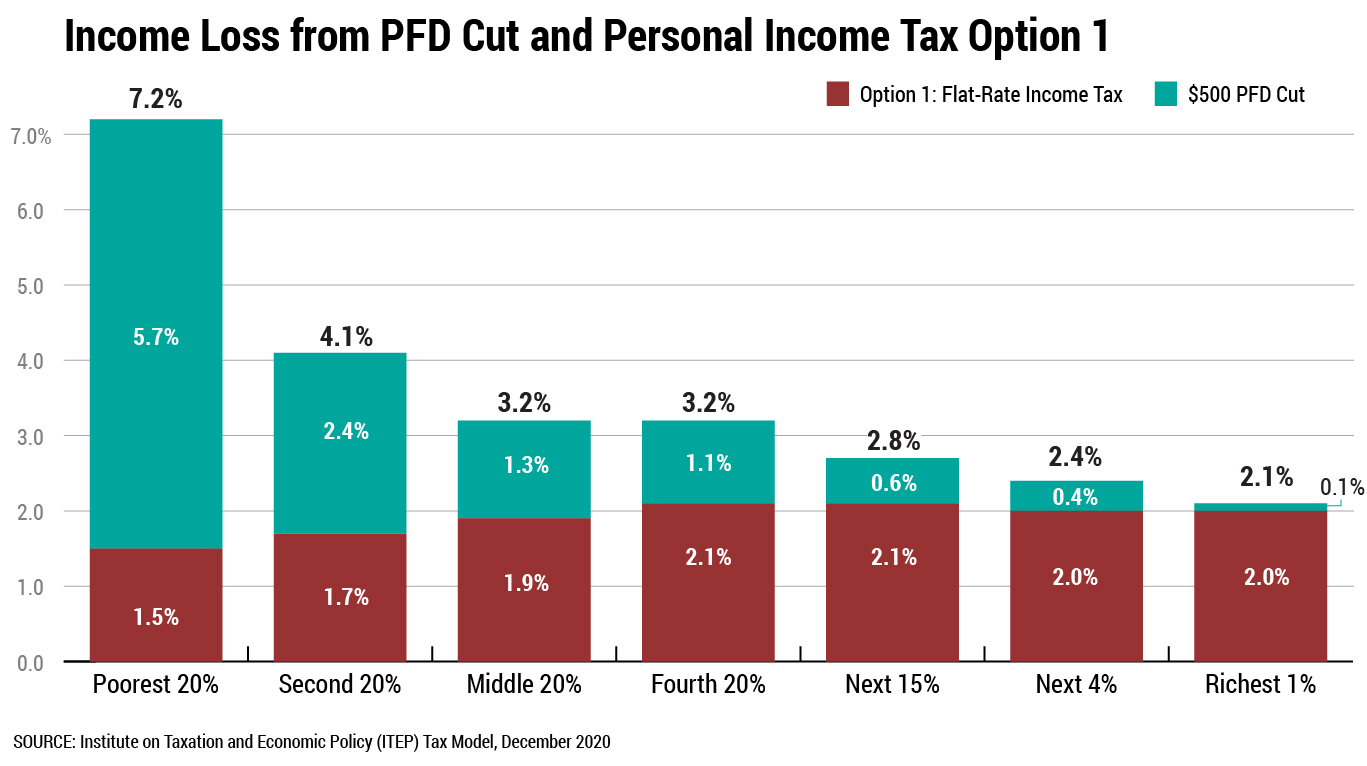
Figure 19 offers the same type of analysis but with Option 2 presented in place of Option 1. This combination of policy changes improves the state’s fiscal situation by approximately $897 million: $581 million from the income tax and $316 million from the PFD cut. This combination is also regressive overall, but the presence of a standard deduction makes Option 2 somewhat more effective than Option 1 in offsetting the regressive nature of a PFD cut because the standard deduction reduces income taxes most sharply for those low-income families impacted most by a PFD reduction.
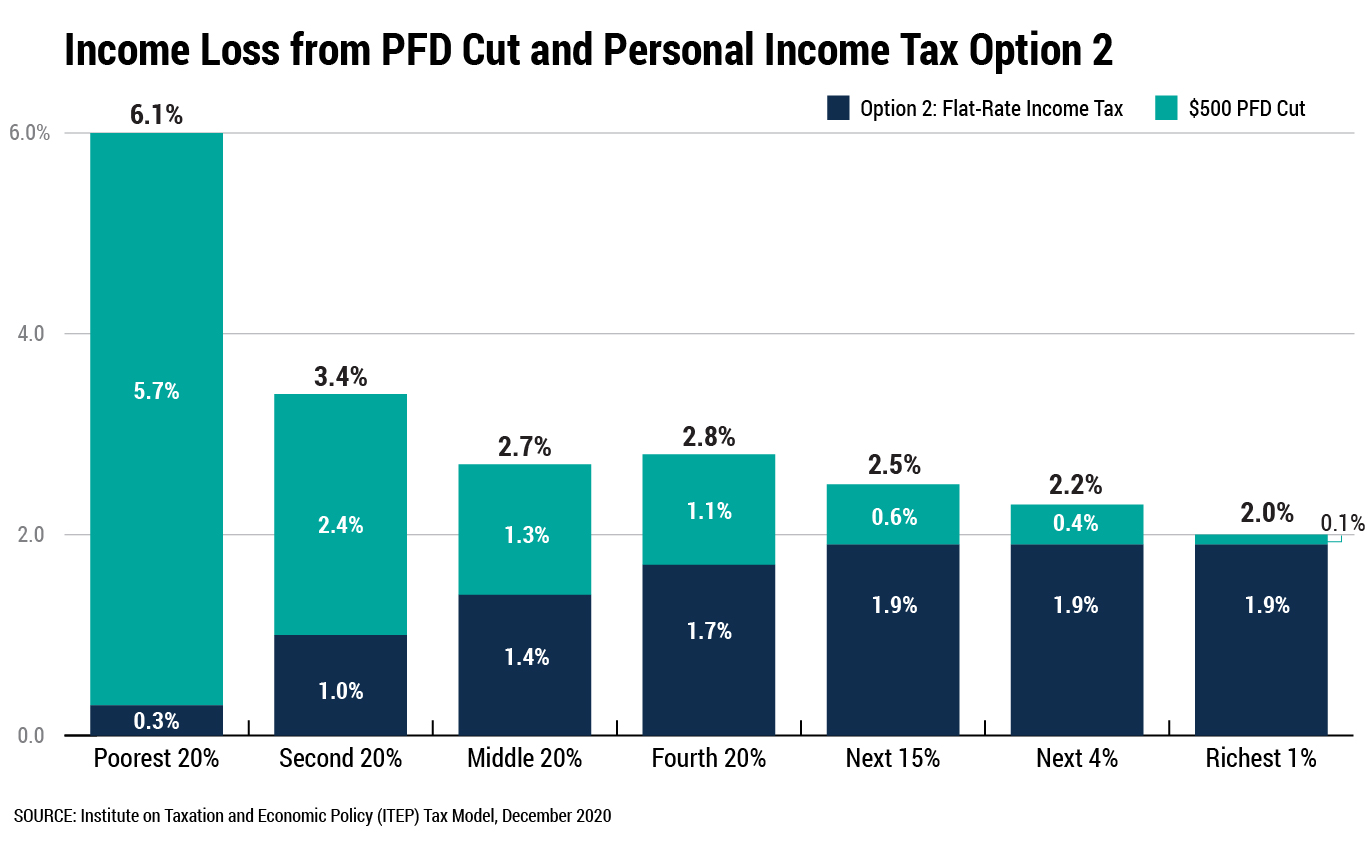
While income reductions are lower across the board under the second combination of changes – as is to be expected since Option 2 is a lower tax than Option 1 – the difference is most pronounced at the bottom. A $500 PFD cut paired with Option 1 would reduce income by 7.2 percent for the bottom 20 percent of earners. Pairing a PFD cut of the same size with Option 2, by contrast, results in that group’s income falling by about 15 percent less, or 6.1 percent.
Conclusion
This report explored six flat-rate income tax options levied at a rate of 2.5 percent. All the options in this report would require tax payments by a broad swath of Alaskans, including full-time minimum wage workers. But a significant portion of the revenue raised would come from higher-income families – a reflection of the fact that these families reap a large share of overall personal income in Alaska.
The most significant difference between the options examined in this report is the size of the standard deduction. Options with larger standard deductions raise less revenue and result in lower tax payments by families across the board. They also tend to be slightly more progressive, which could be useful in mitigating the regressive impact of other policy changes likely to accompany an income tax, such as cuts to the PFD. While each piece of draft legislation we reviewed included a flat rate of 2.5 percent, a supplementary analysis contained in this report indicates that most families would pay less under a higher-deduction, higher-rate tax as opposed to a lower-deduction, lower-rate tax raising an identical level of revenue.
In designing an Alaska income tax, another significant decision that must be made is whether the underlying structure of the tax should be linked to the federal government’s definition of adjusted gross income (AGI), or to taxable income (TI) instead. Most states have chosen to link to AGI, presumably because it offers a broader and more predictable tax base than TI. If Alaska lawmakers wish to incorporate some features of federal TI into their own income tax code, they may wish to adopt those provisions on a case-by-case basis rather than couple to TI in full. Such an approach could afford Alaska lawmakers greater control over their tax base and would offer taxpayers somewhat more certainty in regard to the tax rules they are likely to face in the years ahead.
Ultimately, while this report has focused largely on illuminating the differences between the options examined, each of these taxes is similar in its broad strokes. Any of these taxes would be among the lowest in the nation if enacted and the headline, statutory tax rate of 2.5 percent would be the lowest top rate of any state. Despite their modest size, a tax at this level could make a meaningful contribution toward improving Alaska’s fiscal outlook. Each option examined could be expected to raise in excess of $500 million in state revenue per year.
Appendices
[1] An overview of the ITEP Microsimulation Tax Model is available in Appendix E of this report and at: https://itep.org/about/itep_tax_model_simple.php.
[2] Federation of Tax Administrators, “State Personal Income Taxes: Federal Starting Points as of January 1, 2020,” Feb. 2020. https://www.taxadmin.org/assets/docs/Research/Rates/stg_pts.pdf.
[3] Our estimates for revenue raised from nonresidents are based the following research, which found that 7.3 percent of the total revenue raised by a flat income tax would come from nonresidents. Gunnar Knapp et al., “Short-Run Economic Impacts of Alaska Fiscal Options,” Institute of Social and Economic Research, University of Alaska Anchorage, Mar. 2016. https://iseralaska.org/static/legacy_publication_links/2016_03_30-ShortrunEconomicImpactsOfAlaskaFiscalOptions.pdf.
[4] Internal Revenue Service, “Federal Tax Compliance Research: Tax Gap Estimates for Tax Years 2011-2013,” Publication 1415 (Rev. 9-2019), Sep. 2019. https://www.irs.gov/pub/irs-pdf/p1415.pdf. Andrew Johns and Joel Slemrod, “The Distribution of Income Tax Noncompliance,” 2010, National Tax Journal, 63 (3): 397-418. https://www.ntanet.org/NTJ/63/3/ntj-v63n03p397-418-distribution-income-tax-noncompliance.pdf.
[5] See note 1.
[6] We use the word “household” in this analysis because it is a familiar term, but it is important to note that the unit of analysis in this study is technically a “tax unit.” A tax unit is a person or group of people that file a single tax return or, in the case of non-filers, could be expected to file a single tax return if they decided to file. Households and tax units sometimes differ, though there is substantial overlap in these two definitions.
[7] When discussing standard deductions throughout the text of this report we reference their 2021 value because that is the soonest that an Alaska income tax could take effect. The standard deduction values we used in our modeling, however, were somewhat lower than these amounts because our modeling was done primarily at 2019 levels and these deductions are indexed to inflation to achieve a consistent real value over time.
[8] U.S. Department of Health and Human Services, “U.S. Federal Poverty Guidelines Used to Determine Financial Eligibility for Certain Federal Programs; HHS Poverty Guidelines for 2020,” Jan. 17, 2020. https://aspe.hhs.gov/poverty-guidelines.
[9] Rick Olin, “Individual Income Tax Provisions in the States,” Wisconsin Legislative Fiscal Bureau, Jan. 2019. http://docs.legis.wisconsin.gov/misc/lfb/informational_papers/january_2019/0004_individual_income_tax_provisions_in_the_states_informational_paper_4.pdf.
[10] See note 2.
[11] All but five states deny this deduction. Carl Davis, “State Itemized Deductions: Surveying the Landscape, Exploring Reforms,” Institute on Taxation and Economic Policy, Feb. 2020. https://itep.org/state-itemized-deductions-surveying-the-landscape-exploring-reforms/.
[12] ITEP analysis of IRS Historic Table 2: Individual Income and Tax Data, by State and Size of Adjusted Gross Income, Tax Year 2018. https://www.irs.gov/statistics/soi-tax-stats-historic-table-2.
[13] Center on Budget and Policy Priorities, “Pass-Through Deduction Benefits Wealthiest, Loses Needed Revenue, and Encourages Tax Avoidance,” https://www.cbpp.org/research/federal-tax/pass-through-deduction-benefits-wealthiest-loses-needed-revenue-and-encourages.
[14] Matthew Gardner, “Testimony before the Alaska House Labor & Commerce Committee on House Bill 36,” Institute on Taxation and Economic Policy, Apr. 1, 2017. http://www.legis.state.ak.us/basis/get_documents.asp?session=30&docid=15493.
[15] See note 11.
[16] In 2017, the phase out for personal and dependent exemptions started at income of $261,500 for single taxpayers, $287,650 for heads of household, and $313,800 for married couples. These amounts were indexed to inflation and will thus be higher if the exemptions and exemption phase-out are allowed to come back into effect in 2026.
[17] H.B. 115, Alaska State Legislature, 30th Legislature (2017-2018).
[18] Institute on Taxation and Economic Policy, “How Does Your State Tax Income?,” May 22, 2019. https://itep.org/personal-income-tax-rate-structure-by-state/.
[19] We estimate that this modified version of Option 1 would have raised $582 million in 2019, compared to the $581 million generated by Option 2.
[20] These are 2019 levels and would be higher when adjusted forward into Tax Year 2021 or later.
[21] The 2019 level standard deduction in Option 3a is set at $12,200 for single taxpayers, $18,350 for heads of household, and $24,400 for married couples.
[22] ITEP studied the distributional impact of possible increases in these taxes in: Aidan Russell Davis et al., “Distributional Analyses of Revenue Options for Alaska,” Institute on Taxation and Economic Policy, Apr. 2016. https://itep.org/distributional-analyses-of-revenue-options-for-alaska/.