Read as PDF | Leer en Español | View state data map here
Key Findings
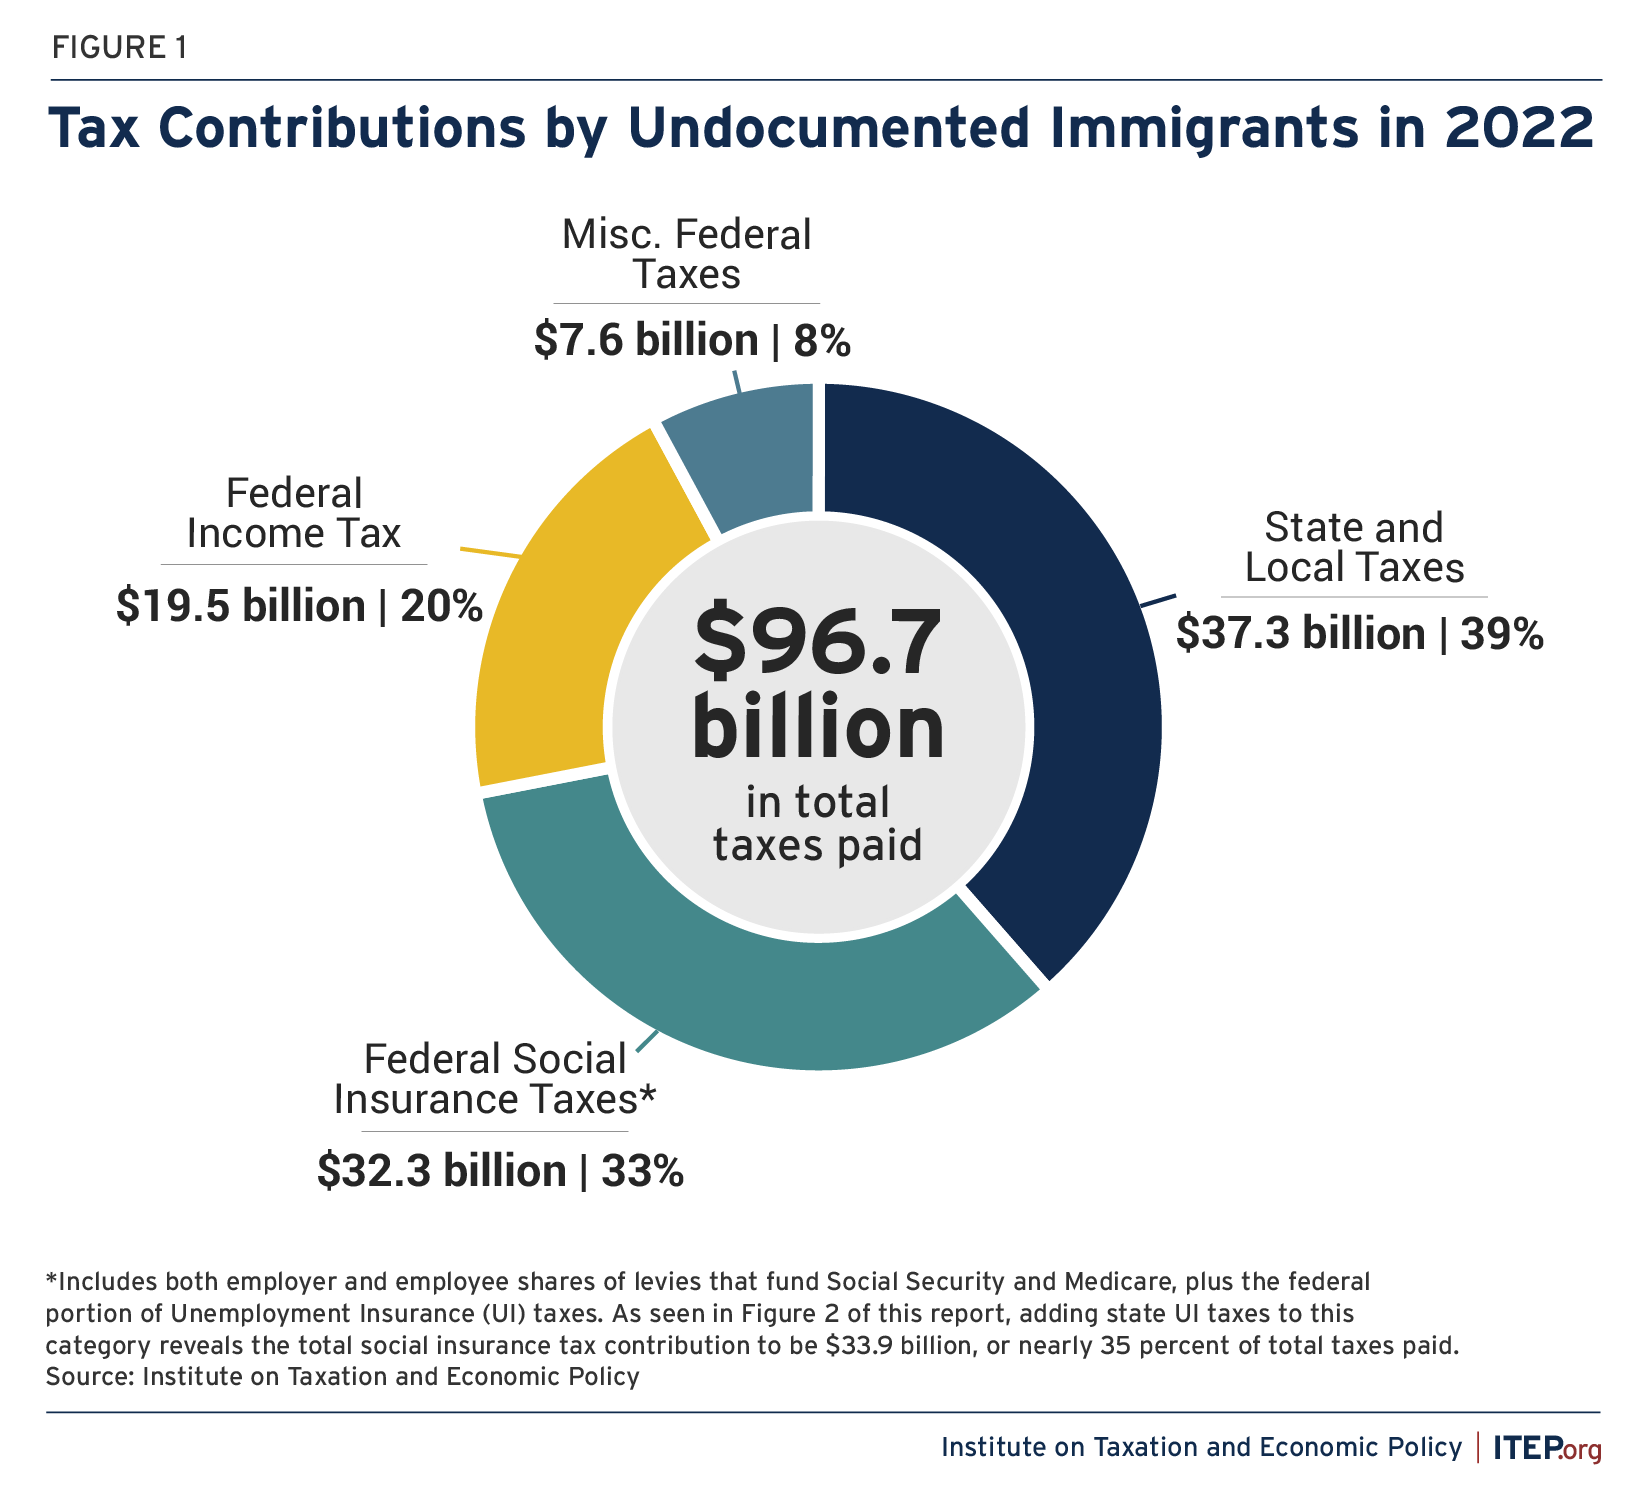
- Undocumented immigrants paid $96.7 billion in federal, state, and local taxes in 2022. Most of that amount, $59.4 billion, was paid to the federal government while the remaining $37.3 billion was paid to state and local governments.
- Undocumented immigrants paid federal, state, and local taxes of $8,889 per person in 2022. In other words, for every 1 million undocumented immigrants who reside in the country, public services receive $8.9 billion in additional tax revenue.
- More than a third of the tax dollars paid by undocumented immigrants go toward payroll taxes dedicated to funding programs that these workers are barred from accessing. Undocumented immigrants paid $25.7 billion in Social Security taxes, $6.4 billion in Medicare taxes, and $1.8 billion in unemployment insurance taxes in 2022.
- At the state and local levels, slightly less than half (46 percent, or $15.1 billion) of the tax payments made by undocumented immigrants are through sales and excise taxes levied on their purchases. Most other payments are made through property taxes, such as those levied on homeowners and renters (31 percent, or $10.4 billion), or through personal and business income taxes (21 percent, or $7.0 billion).
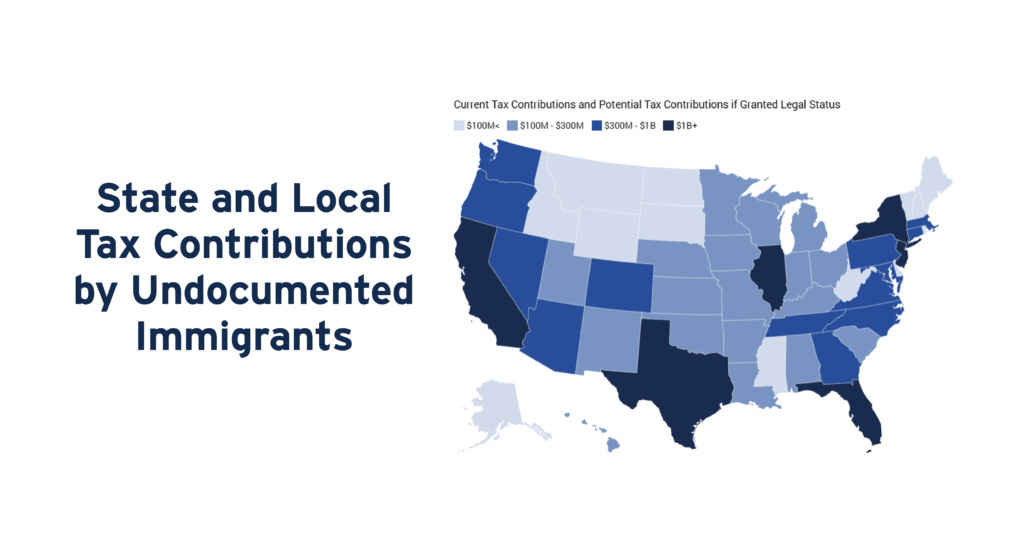
- Six states raised more than $1 billion each in tax revenue from undocumented immigrants living within their borders. Those states are California ($8.5 billion), Texas ($4.9 billion), New York ($3.1 billion), Florida ($1.8 billion), Illinois ($1.5 billion), and New Jersey ($1.3 billion).
- In a large majority of states (40), undocumented immigrants pay higher state and local tax rates than the top 1 percent of households living within their borders.
- Income tax payments by undocumented immigrants are affected by laws that require them to pay more than otherwise similarly situated U.S. citizens. Undocumented immigrants are often barred from receiving meaningful tax credits and sometimes do not claim refunds they are owed due to lack of awareness, concern about their immigration status, or insufficient access to tax preparation assistance.
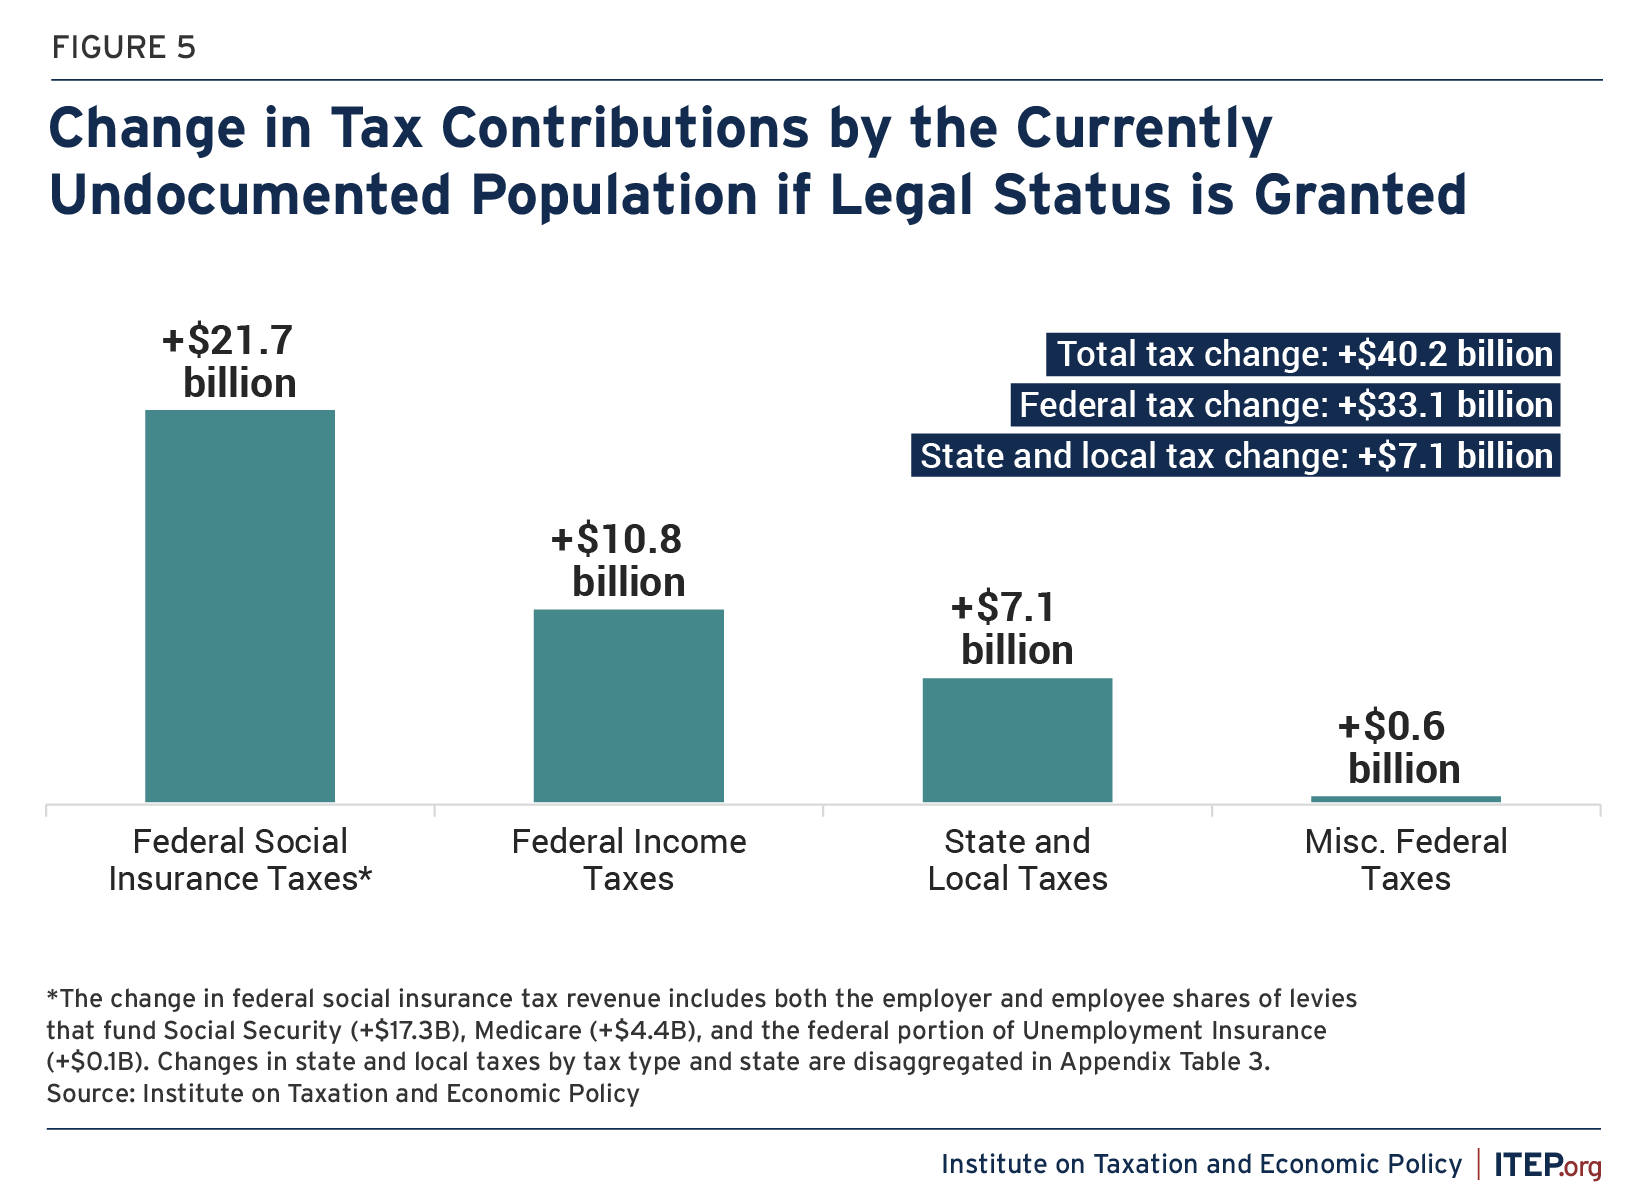
- Providing access to work authorization for undocumented immigrants would increase their tax contributions both because their wages would rise and because their rates of tax compliance would increase. Under a scenario where work authorization is provided to all current undocumented immigrants, their tax contributions would rise by $40.2 billion per year to $136.9 billion. Most of the new revenue raised in this scenario ($33.1 billion) would flow to the federal government while the remainder ($7.1 billion) would flow to states and localities.
Introduction
Immigration has always been an important part of the story of the United States. Today is certainly no exception.
Debates over immigration policy raise a huge array of issues that are fundamental to life in the U.S. To shed light on just one of those issues, this study undertakes the most thorough examination to date of the federal, state, and local tax payments made by undocumented immigrants.
To accomplish this, the study combines well-established techniques for estimating the size and tax-relevant characteristics of the undocumented population with the trove of data underlying ITEP’s comprehensive studies of U.S. tax incidence.[1] In doing so, it arrives at nationwide estimates of the overall tax contributions of the estimated 10.9 million undocumented immigrants living in the U.S. as of 2022, as well as state-by-state estimates for those immigrants’ payments of state and local taxes.[2] The report also forecasts the growth in tax contributions that would occur under a scenario in which these taxpayers were granted work authorization.
Current Tax Payments by Undocumented Immigrants
Federal, state, and local governments in the U.S. levy a wide array of taxes and most of those taxes affect undocumented immigrants in some fashion. Much like their neighbors, undocumented immigrants pay sales and excise taxes on goods and services like utilities, household products, and gasoline. They pay property taxes either directly on their homes or indirectly when these taxes are folded into the price of their monthly rent. And they pay income and payroll taxes through automatic withholding from their paychecks or by filing income tax returns using Individual Taxpayer Identification Numbers (ITINs).[3]
Using the method described in detail at the end of this report, we estimate that undocumented immigrants paid $96.7 billion in U.S. taxes in 2022, including $59.4 billion in payments to the federal government and $37.3 billion in payments to states and localities. Those tax payments are disaggregated by major category in Figure 1.
Given that the undocumented population included 10.9 million people in 2022, this $96.7 billion tax payment is equivalent to $8,889 per person. In other words, this analysis finds that for every 1 million undocumented immigrants who reside in the country, public services receive $8.9 billion in additional tax revenue. It bears noting that this figure includes only the taxes borne by undocumented immigrants and that other research attempting to quantify the significance of immigrants to the economy more broadly points toward a higher revenue impact per person.[4]
In total, the tax contribution of undocumented immigrants amounted to 26.1 percent of their incomes in 2022. This figure is close to the 26.4 percent rate facing the median income group of the overall U.S. population.[5] This closeness is the net result of factors that tend to lower the tax contributions of undocumented immigrants relative to U.S. citizens (such as lower incomes, lower income tax compliance, and lower smoking rates), as well as factors that tend to increase the contributions of those immigrants (such as tax credit restrictions, reduced likelihood of claiming refunds owed, and lower prevalence of tax-preferred retirement and investment income). These issues are discussed in more detail in the report methodology.
Most of the tax dollars paid by undocumented immigrants are collected through levies applied to their incomes. This includes broad income taxes as well as narrower payroll taxes levied on workers’ earnings that are dedicated to specific programs. It is well established that undocumented workers contribute to the solvency of major social insurance programs through their tax contributions.[6] They pay taxes that fund Social Security, Medicare, and Unemployment Insurance, among other programs, despite their exclusion from most of those benefits.[7] Figure 2 details the tax contributions that undocumented immigrants make under major social insurance programs.
FIGURE 2.
Social Insurance Taxes Attributed to Undocumented Immigrants
| Tax Type | Revenue |
| Social Security Tax | $25.7 billion |
| Medicare Tax | $6.4 billion |
| Unemployment Insurance Tax | $1.8 billion |
| Sum of Social Insurance Taxes | $33.9 billion |
| Grand Total of All Taxes | $96.7 billion |
| Social Insurance Share of Grand Total | 35.00% |
Note: Figures include both the employer and employee share of these taxes. Unemployment Insurance Tax figure includes both state and federal components.
Source: Institute on Taxation and Economic Policy
While the federal government collects the bulk of its revenue through various kinds of income taxes, states and localities levy a wider array of tax types. Nearly 39 percent of the total tax dollars paid by undocumented immigrants are to state and local governments, for a total of $37.3 billion in 2022. Figure 3 disaggregates those payments by broad tax category.
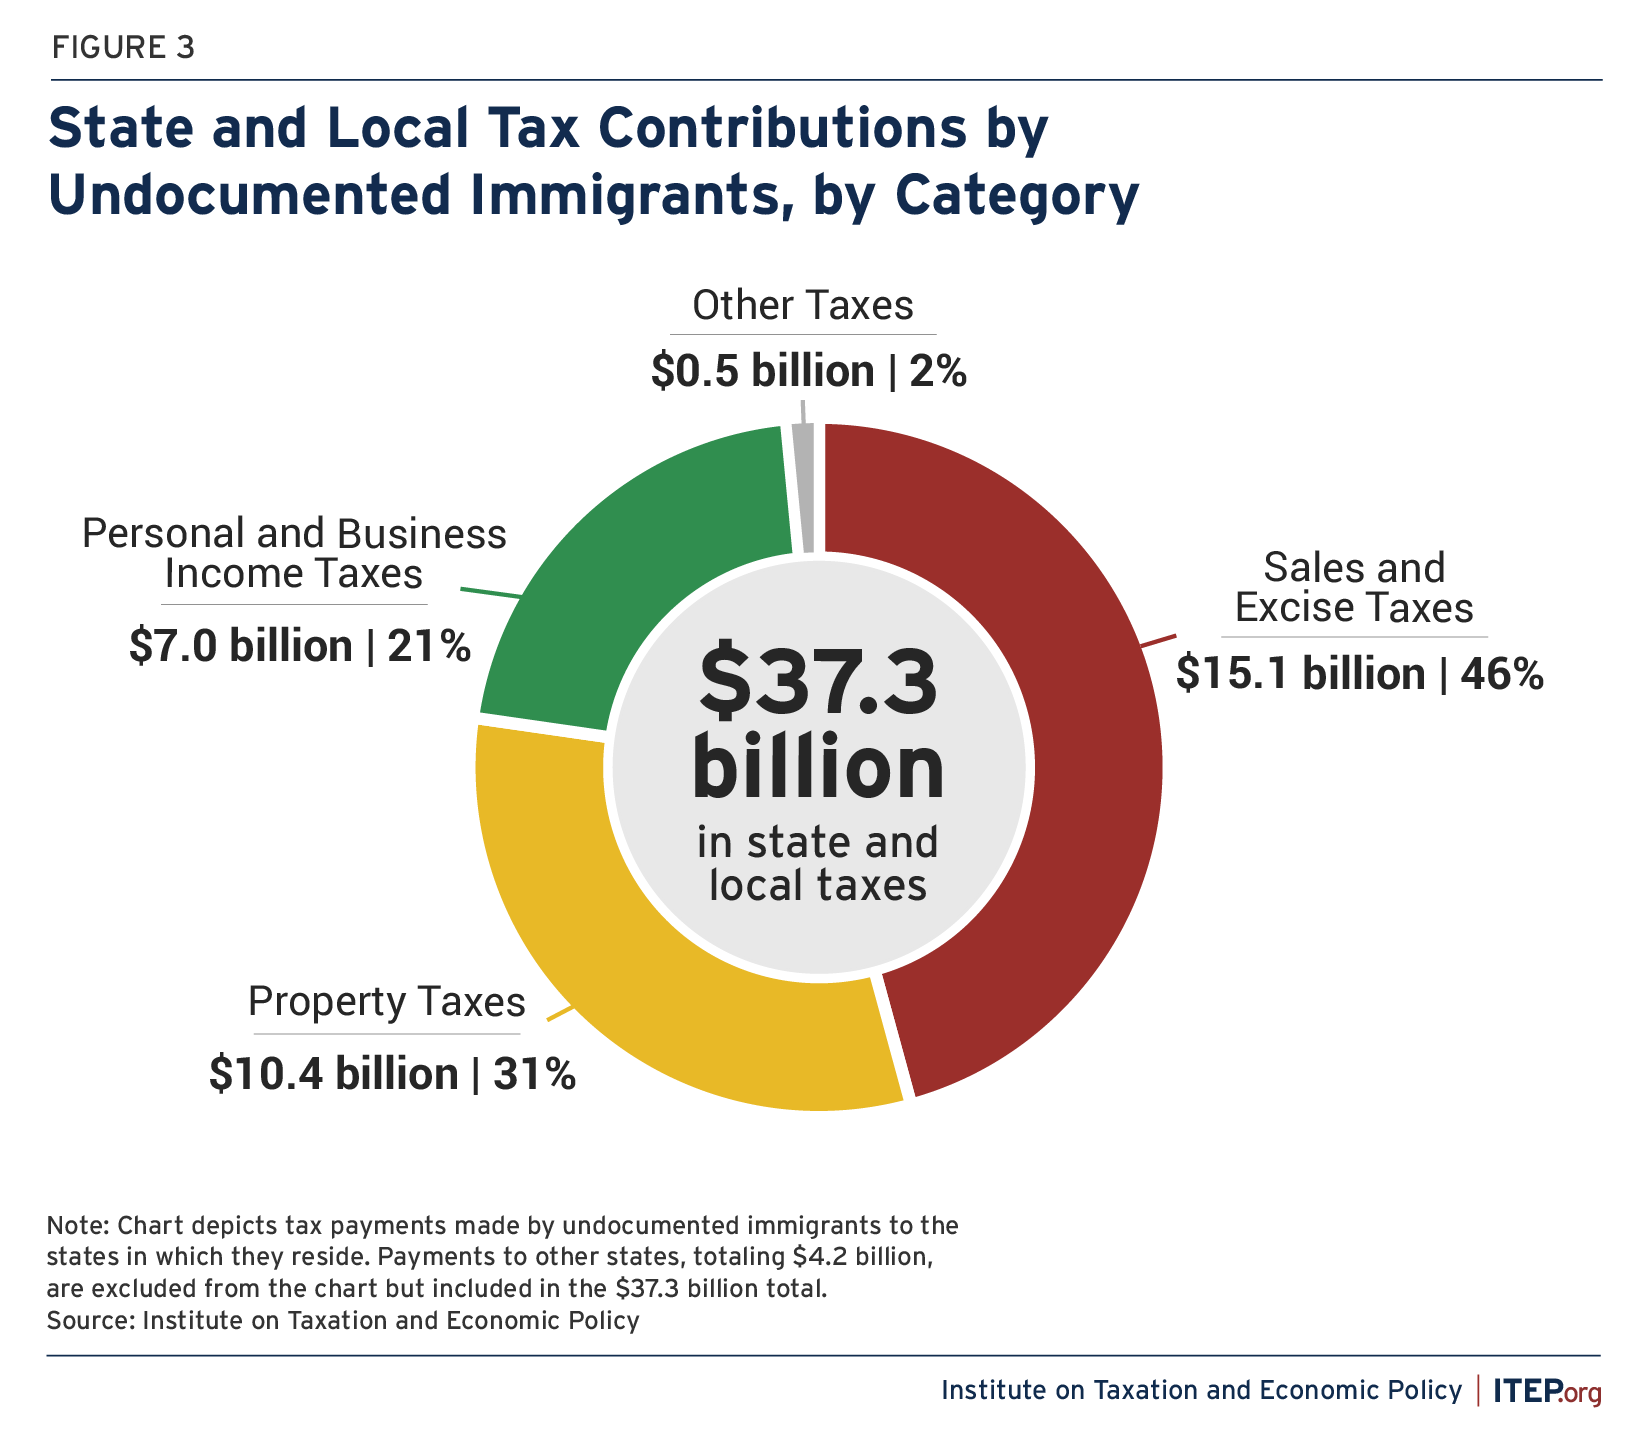
The bulk of state and local tax payments by undocumented immigrants occur through sales and excise taxes on their purchases. The total state and local tax contribution of these families, in 2022, included $15.1 billion in sales and excise taxes, $10.4 billion in property taxes, $7.0 billion in personal and business income taxes, and $0.5 billion in other taxes to the states in which they live. Undocumented immigrants also paid another $4.2 billion in taxes to states aside from the ones in which they reside, mostly by making taxable purchases when traveling across state lines or by purchasing items from businesses located in other states that have passed some of their tax expense along to their consumers.
The undocumented immigrant population, and its tax contributions, are relatively concentrated in just a few states. Six states raised more than $1 billion each in tax revenue from undocumented immigrants in 2022, and together those states made up nearly two-thirds (64 percent) of all state and local tax collections from undocumented immigrants in that year. Those states are California ($8.5 billion), Texas ($4.9 billion), New York ($3.1 billion), Florida ($1.8 billion), Illinois ($1.5 billion), and New Jersey ($1.3 billion).
Measured relative to their incomes, undocumented immigrants nationwide paid an average effective state and local tax rate of 8.9 percent toward funding public infrastructure, services, and institutions in their home states. To put this in perspective, the nation’s most affluent taxpayers (those in the top 1 percent of the income scale) paid an average nationwide effective tax rate of just 7.2 percent to their home states.[8] Appendix Table 4 provides effective tax rate data by state and reveals that 40 states collect higher tax rates, relative to income, from undocumented immigrants than from the top 1 percent of households living within their borders.
State-by-state data on the tax contributions of undocumented immigrants can be found in Figure 4 and in the appendix to this report.
FIGURE 4.
State and Local Tax Contributions by Undocumented Immigrants
Current Contributions and Potential Contributions if Granted Legal Status
| State | Current Contributions |
Potential Contributions with Legal Status |
Tax Change* |
| Alabama | $146,000,000 | $180,000,000 | $34,000,000 |
| Alaska | $12,600,000 | $14,600,000 | $2,000,000 |
| Arizona | $704,000,000 | $813,500,000 | $109,500,000 |
| Arkansas | $188,200,000 | $223,200,000 | $35,000,000 |
| California | $8,470,100,000 | $10,314,700,000 | $1,844,600,000 |
| Colorado | $436,500,000 | $537,800,000 | $101,300,000 |
| Connecticut | $406,400,000 | $496,400,000 | $90,000,000 |
| Delaware | $57,000,000 | $75,000,000 | $18,000,000 |
| District of Columbia | $73,600,000 | $94,700,000 | $21,100,000 |
| Florida | $1,844,300,000 | $1,998,600,000 | $154,300,000 |
| Georgia | $928,500,000 | $1,156,600,000 | $228,100,000 |
| Hawaii | $157,200,000 | $194,400,000 | $37,200,000 |
| Idaho | $71,900,000 | $89,900,000 | $18,000,000 |
| Illinois | $1,551,300,000 | $1,917,300,000 | $366,100,000 |
| Indiana | $285,900,000 | $354,600,000 | $68,700,000 |
| Iowa | $124,300,000 | $150,100,000 | $25,700,000 |
| Kansas | $208,200,000 | $253,100,000 | $44,900,000 |
| Kentucky | $118,900,000 | $151,900,000 | $33,000,000 |
| Louisiana | $181,000,000 | $211,000,000 | $29,900,000 |
| Maine | $15,600,000 | $19,800,000 | $4,100,000 |
| Maryland | $779,300,000 | $1,041,400,000 | $262,100,000 |
| Massachusetts | $649,800,000 | $847,100,000 | $197,300,000 |
| Michigan | $290,100,000 | $353,200,000 | $63,100,000 |
| Minnesota | $221,700,000 | $294,100,000 | $72,400,000 |
| Mississippi | $49,900,000 | $58,100,000 | $8,200,000 |
| Missouri | $113,700,000 | $139,300,000 | $25,600,000 |
| Montana | $2,000,000 | $2,500,000 | $500,000 |
| Nebraska | $113,100,000 | $136,300,000 | $23,200,000 |
| Nevada | $507,100,000 | $585,100,000 | $78,100,000 |
| New Hampshire | $23,100,000 | $26,000,000 | $2,800,000 |
| New Jersey | $1,325,500,000 | $1,658,000,000 | $332,500,000 |
| New Mexico | $153,800,000 | $174,100,000 | $20,300,000 |
| New York | $3,102,700,000 | $3,953,600,000 | $850,800,000 |
| North Carolina | $692,200,000 | $843,600,000 | $151,400,000 |
| North Dakota | $12,900,000 | $14,400,000 | $1,500,000 |
| Ohio | $265,400,000 | $332,400,000 | $67,000,000 |
| Oklahoma | $227,500,000 | $273,100,000 | $45,700,000 |
| Oregon | $353,100,000 | $487,700,000 | $134,600,000 |
| Pennsylvania | $523,100,000 | $667,000,000 | $143,900,000 |
| Rhode Island | $94,900,000 | $115,000,000 | $20,100,000 |
| South Carolina | $213,800,000 | $256,800,000 | $43,100,000 |
| South Dakota | $14,300,000 | $15,600,000 | $1,300,000 |
| Tennessee | $314,200,000 | $341,300,000 | $27,000,000 |
| Texas | $4,872,500,000 | $5,346,400,000 | $473,900,000 |
| Utah | $235,100,000 | $292,500,000 | $57,400,000 |
| Vermont | $7,900,000 | $10,100,000 | $2,300,000 |
| Virginia | $689,800,000 | $856,900,000 | $167,100,000 |
| Washington | $997,300,000 | $1,099,300,000 | $101,900,000 |
| West Virginia | $10,400,000 | $12,900,000 | $2,500,000 |
| Wisconsin | $198,900,000 | $246,800,000 | $47,900,000 |
| Wyoming | $15,800,000 | $18,100,000 | $2,300,000 |
| SUM ALL STATES* | $33,052,600,000 | $39,745,700,000 | $6,693,100,000 |
| Payments to other states | $4,225,000,000 | $4,582,800,000 | $357,900,000 |
| NATIONAL TOTAL** | $37,277,600,000 | $44,328,600,000 | $7,051,000,000 |
*Figures may not sum to totals due to rounding.
**National total differs from the all states sum because it includes taxes paid by residents of one state to governments of another state.
Source: Institute on Taxation and Economic Policy
In many respects, undocumented immigrants face a harsher tax code than legal residents. They often pay taxes that are dedicated to funding programs from which they are barred from participating because of their immigration status. In addition, undocumented immigrants and the citizen members of their families are ineligible for the federal Earned Income Tax Credit (EITC).[9] While some states have moved to make more taxpayers eligible for state EITCs regardless of immigration status, most states still exclude taxpayers filing with ITINs. On top of that, only qualifying taxpayers with children with Social Security Numbers (SSNs) qualify for the federal Child Tax Credit (CTC) and a few states with CTCs have chosen to mimic this restriction in their own CTCs. While some kids — with valid taxpayer identification numbers — may qualify for the Credit for Other Dependents, the credit value is only one-fourth the size of the federal CTC and is not refundable.[10]
Steps toward more immigrant-inclusive tax policies have been uneven in recent years. On the one hand, the 2017 Trump tax law added the SSN requirement for the Child Tax Credit that has barred many immigrant children and their families from benefiting. On the other hand, a growing number of states have chosen a more inclusive path with their own tax credits in recent years. Roughly one-third of states with EITCs and most states with CTCs have written their tax laws to be inclusive of children who do not qualify for an SSN.[11]
Effect of Work Authorization on Undocumented Immigrant Tax Contributions
Undocumented immigrants work without authorization and, as a result, their tax contributions are lower than what would be paid by a worker with legal status in an otherwise comparable position. Granting work authorization to undocumented immigrants would increase their tax contributions for two reasons.
First, income tax revenues would increase because legal status would lessen barriers to complying with existing income tax laws. Second, the data demonstrate that immigrants with employment authorization earn higher wages than undocumented immigrants.[12] Greater access to job opportunities and higher-level education would provide immigrants with the opportunity to earn substantially higher wages which would have the effect of raising taxable earnings, consumption, and property ownership.
We estimate that providing access to work authorization to the currently undocumented population would boost their overall tax contribution by $40.2 billion per year, from $96.7 billion to $136.9 billion. As seen in Figure 5, $33.1 billion of that increase would occur through higher federal tax payments while the other $7.1 billion would occur through higher tax payments to states and localities. Disaggregation of the state and local figure by state is available in Figure 4 and Appendix Table 3.
Recipients of Deferred Action for Childhood Arrivals (DACA) already have access to work authorization and are therefore not included in these estimates of expanded access to work authorization, or in the other estimates contained in this report.
Conclusion
Undocumented immigrants pay substantial amounts toward the funding of public infrastructure, institutions, and services. Specifically, we find that in 2022, undocumented immigrants paid $96.7 billion in taxes at the federal, state, and local levels. More than a third of that amount, $33.9 billion, went toward funding social insurance programs that these individuals are barred from accessing because of their immigration status.
In total, the federal tax contribution of undocumented immigrants amounted to $59.4 billion in 2022 while the state and local tax contribution stood at $37.3 billion. These figures make clear that immigration policy choices have substantial implications for public revenue at all levels of government.
See Appendix A for detailed state-level estimates of the state and local portion of tax contributions made by undocumented immigrants.
See Appendix B for the methodology used to calculate the estimates contained in this report.
Appendix A: State-Level Disaggregation of the State and Local Tax Contributions of Undocumented Immigrants
APPENDIX TABLE 1.
State and Local Tax Contributions by the Undocumented Immigrant Population in 2022
(Scroll right for more)
| State | Sales and Excise Taxes |
Property Taxes |
Personal and Business Income Taxes* |
Other Taxes |
Total State and Local Taxes** |
Effective Tax Rate |
| Alabama | $79,600,000 | $24,900,000 | $38,300,000 | $3,200,000 | $146,000,000 | 8.7% |
| Alaska | $3,900,000 | $5,200,000 | $2,500,000 | $1,000,000 | $12,600,000 | 5.9% |
| Arizona | $422,100,000 | $186,900,000 | $91,200,000 | $3,800,000 | $704,000,000 | 8.4% |
| Arkansas | $119,700,000 | $35,300,000 | $31,000,000 | $2,100,000 | $188,200,000 | 9.0% |
| California | $3,878,400,000 | $2,605,600,000 | $1,780,500,000 | $205,600,000 | $8,470,100,000 | 9.1% |
| Colorado | $184,700,000 | $142,700,000 | $104,300,000 | $4,900,000 | $436,500,000 | 7.8% |
| Connecticut | $140,400,000 | $146,800,000 | $117,900,000 | $1,300,000 | $406,400,000 | 9.5% |
| Delaware | $12,100,000 | $17,100,000 | $25,600,000 | $2,300,000 | $57,000,000 | 6.8% |
| District of Columbia | $22,900,000 | $26,100,000 | $23,700,000 | $900,000 | $73,600,000 | 9.5% |
| Florida | $1,059,600,000 | $725,700,000 | $36,300,000 | $22,700,000 | $1,844,300,000 | 8.0% |
| Georgia | $435,700,000 | $239,600,000 | $245,900,000 | $7,200,000 | $928,500,000 | 8.0% |
| Hawaii | $71,500,000 | $29,900,000 | $54,900,000 | $1,000,000 | $157,200,000 | 11.8% |
| Idaho | $31,400,000 | $19,900,000 | $19,600,000 | $1,000,000 | $71,900,000 | 7.2% |
| Illinois | $585,600,000 | $529,600,000 | $418,300,000 | $17,800,000 | $1,551,300,000 | 10.3% |
| Indiana | $129,100,000 | $67,000,000 | $88,200,000 | $1,500,000 | $285,900,000 | 8.5% |
| Iowa | $51,300,000 | $42,000,000 | $29,900,000 | $1,100,000 | $124,300,000 | 9.6% |
| Kansas | $88,600,000 | $62,200,000 | $55,400,000 | $2,000,000 | $208,200,000 | 9.7% |
| Kentucky | $54,800,000 | $24,100,000 | $39,000,000 | $1,000,000 | $118,900,000 | 8.5% |
| Louisiana | $117,900,000 | $29,400,000 | $30,900,000 | $2,800,000 | $181,000,000 | 9.9% |
| Maine | $4,900,000 | $6,000,000 | $4,400,000 | $300,000 | $15,600,000 | 8.9% |
| Maryland | $261,500,000 | $196,400,000 | $314,700,000 | $6,700,000 | $779,300,000 | 8.7% |
| Massachusetts | $160,700,000 | $209,600,000 | $274,400,000 | $5,200,000 | $649,800,000 | 7.6% |
| Michigan | $113,900,000 | $80,300,000 | $94,400,000 | $1,500,000 | $290,100,000 | 8.0% |
| Minnesota | $84,700,000 | $59,200,000 | $75,700,000 | $2,100,000 | $221,700,000 | 7.8% |
| Mississippi | $29,900,000 | $13,600,000 | $6,100,000 | $300,000 | $49,900,000 | 8.9% |
| Missouri | $52,800,000 | $32,100,000 | $28,000,000 | $800,000 | $113,700,000 | 7.4% |
| Montana | $400,000 | $700,000 | $800,000 | $100,000 | $2,000,000 | 6.9% |
| Nebraska | $47,700,000 | $41,000,000 | $23,100,000 | $1,300,000 | $113,100,000 | 8.7% |
| Nevada | $271,900,000 | $138,600,000 | $77,300,000 | $19,300,000 | $507,100,000 | 8.4% |
| New Hampshire | $4,000,000 | $15,900,000 | $3,000,000 | $200,000 | $23,100,000 | 5.0% |
| New Jersey | $424,100,000 | $450,200,000 | $434,700,000 | $16,500,000 | $1,325,500,000 | 8.4% |
| New Mexico | $102,700,000 | $38,100,000 | $3,700,000 | $9,300,000 | $153,800,000 | 9.3% |
| New York | $919,500,000 | $1,021,700,000 | $1,154,700,000 | $7,000,000 | $3,102,700,000 | 10.6% |
| North Carolina | $365,900,000 | $164,800,000 | $154,300,000 | $7,200,000 | $692,200,000 | 7.6% |
| North Dakota | $7,700,000 | $3,200,000 | $1,000,000 | $1,100,000 | $12,900,000 | 6.9% |
| Ohio | $114,100,000 | $69,200,000 | $78,400,000 | $3,700,000 | $265,400,000 | 8.2% |
| Oklahoma | $122,600,000 | $49,100,000 | $51,300,000 | $4,500,000 | $227,500,000 | 8.9% |
| Oregon | $65,400,000 | $101,300,000 | $181,800,000 | $4,700,000 | $353,100,000 | 9.0% |
| Pennsylvania | $183,600,000 | $139,600,000 | $185,300,000 | $14,600,000 | $523,100,000 | 9.0% |
| Rhode Island | $35,500,000 | $32,500,000 | $25,500,000 | $1,400,000 | $94,900,000 | 9.2% |
| South Carolina | $99,100,000 | $68,700,000 | $41,000,000 | $5,000,000 | $213,800,000 | 7.7% |
| South Dakota | $9,000,000 | $4,400,000 | $400,000 | $500,000 | $14,300,000 | 7.2% |
| Tennessee | $233,200,000 | $63,900,000 | $10,800,000 | $6,400,000 | $314,200,000 | 8.4% |
| Texas | $2,829,000,000 | $1,802,000,000 | $180,900,000 | $60,500,000 | $4,872,500,000 | 8.9% |
| Utah | $115,700,000 | $56,600,000 | $60,400,000 | $2,300,000 | $235,100,000 | 8.3% |
| Vermont | $2,400,000 | $3,200,000 | $2,200,000 | $100,000 | $7,900,000 | 7.7% |
| Virginia | $244,700,000 | $204,200,000 | $209,500,000 | $31,300,000 | $689,800,000 | 7.9% |
| Washington | $646,600,000 | $278,200,000 | $57,400,000 | $15,100,000 | $997,300,000 | 8.7% |
| West Virginia | $4,800,000 | $1,900,000 | $3,000,000 | $700,000 | $10,400,000 | 8.9% |
| Wisconsin | $71,500,000 | $70,100,000 | $55,700,000 | $1,600,000 | $198,900,000 | 8.0% |
| Wyoming | $6,900,000 | $5,300,000 | $2,500,000 | $1,200,000 | $15,800,000 | 6.8% |
| SUM ALL STATES** | $15,125,300,000 | $10,381,800,000 | $7,029,700,000 | $515,800,000 | $33,052,600,000 | 8.9% |
| Payments to other states | N/A | N/A | N/A | N/A | $4,225,000,000 | 1.1% |
| NATIONAL TOTAL*** | N/A | N/A | N/A | N/A | $37,277,600,000 | 10.0% |
*Includes state share of Unemployment Insurance (UI) taxes.
**Figures may not sum to totals due to rounding.
***National total differs from the all states sum because it includes taxes paid by residents of one state to state and local governments in other states.
Source: Institute on Taxation and Economic Policy
APPENDIX TABLE 2.
Potential State and Local Tax Contributions by the Currently Undocumented Population if Legal Status is Granted
(Scroll right for more)
| State | Sales and Excise Taxes |
Property Taxes |
Personal and Business Income Taxes* |
Other Taxes |
Total State and Local Taxes** |
Effective Tax Rate |
| Alabama | $85,500,000 | $26,700,000 | $64,300,000 | $3,500,000 | $180,000,000 | 9.7% |
| Alaska | $4,000,000 | $5,800,000 | $3,700,000 | $1,100,000 | $14,600,000 | 6.2% |
| Arizona | $454,500,000 | $202,400,000 | $152,500,000 | $4,100,000 | $813,500,000 | 8.9% |
| Arkansas | $129,100,000 | $38,600,000 | $53,200,000 | $2,400,000 | $223,200,000 | 9.8% |
| California | $4,136,800,000 | $2,820,300,000 | $3,136,500,000 | $221,200,000 | $10,314,700,000 | 10.1% |
| Colorado | $196,500,000 | $155,100,000 | $181,000,000 | $5,200,000 | $537,800,000 | 8.8% |
| Connecticut | $149,300,000 | $157,700,000 | $188,100,000 | $1,400,000 | $496,400,000 | 10.6% |
| Delaware | $12,800,000 | $18,300,000 | $41,400,000 | $2,500,000 | $75,000,000 | 8.1% |
| District of Columbia | $24,200,000 | $28,700,000 | $40,800,000 | $1,000,000 | $94,700,000 | 11.1% |
| Florida | $1,143,200,000 | $780,100,000 | $50,700,000 | $24,700,000 | $1,998,600,000 | 7.9% |
| Georgia | $467,200,000 | $260,300,000 | $421,200,000 | $7,900,000 | $1,156,600,000 | 9.0% |
| Hawaii | $76,300,000 | $32,200,000 | $84,900,000 | $1,000,000 | $194,400,000 | 13.3% |
| Idaho | $33,700,000 | $21,500,000 | $33,700,000 | $1,100,000 | $89,900,000 | 8.2% |
| Illinois | $622,700,000 | $576,500,000 | $698,800,000 | $19,300,000 | $1,917,300,000 | 11.6% |
| Indiana | $138,400,000 | $72,600,000 | $142,000,000 | $1,700,000 | $354,600,000 | 9.6% |
| Iowa | $55,100,000 | $45,600,000 | $48,300,000 | $1,200,000 | $150,100,000 | 10.6% |
| Kansas | $95,500,000 | $68,100,000 | $87,300,000 | $2,100,000 | $253,100,000 | 10.7% |
| Kentucky | $58,900,000 | $25,700,000 | $66,100,000 | $1,100,000 | $151,900,000 | 9.9% |
| Louisiana | $127,400,000 | $31,900,000 | $48,500,000 | $3,100,000 | $211,000,000 | 10.5% |
| Maine | $5,300,000 | $6,600,000 | $7,600,000 | $300,000 | $19,800,000 | 10.2% |
| Maryland | $277,300,000 | $215,700,000 | $541,100,000 | $7,200,000 | $1,041,400,000 | 10.6% |
| Massachusetts | $170,600,000 | $230,900,000 | $440,100,000 | $5,600,000 | $847,100,000 | 9.0% |
| Michigan | $121,400,000 | $89,100,000 | $141,000,000 | $1,700,000 | $353,200,000 | 8.8% |
| Minnesota | $90,600,000 | $66,100,000 | $135,100,000 | $2,300,000 | $294,100,000 | 9.4% |
| Mississippi | $32,400,000 | $14,700,000 | $10,500,000 | $400,000 | $58,100,000 | 9.4% |
| Missouri | $56,700,000 | $34,700,000 | $46,900,000 | $900,000 | $139,300,000 | 8.2% |
| Montana | $400,000 | $800,000 | $1,200,000 | $100,000 | $2,500,000 | 8.0% |
| Nebraska | $51,400,000 | $44,400,000 | $39,100,000 | $1,400,000 | $136,300,000 | 9.5% |
| Nevada | $292,000,000 | $150,900,000 | $121,200,000 | $21,100,000 | $585,100,000 | 8.8% |
| New Hampshire | $4,200,000 | $17,400,000 | $4,100,000 | $200,000 | $26,000,000 | 5.1% |
| New Jersey | $450,700,000 | $498,000,000 | $691,500,000 | $17,900,000 | $1,658,000,000 | 9.5% |
| New Mexico | $110,900,000 | $40,900,000 | $12,100,000 | $10,200,000 | $174,100,000 | 9.5% |
| New York | $980,600,000 | $1,114,300,000 | $1,851,200,000 | $7,400,000 | $3,953,600,000 | 12.3% |
| North Carolina | $392,800,000 | $177,600,000 | $265,400,000 | $7,800,000 | $843,600,000 | 8.5% |
| North Dakota | $8,300,000 | $3,300,000 | $1,600,000 | $1,200,000 | $14,400,000 | 6.9% |
| Ohio | $122,200,000 | $75,400,000 | $130,800,000 | $4,000,000 | $332,400,000 | 9.4% |
| Oklahoma | $131,900,000 | $53,400,000 | $82,900,000 | $4,900,000 | $273,100,000 | 9.8% |
| Oregon | $68,500,000 | $109,300,000 | $304,900,000 | $5,000,000 | $487,700,000 | 11.3% |
| Pennsylvania | $195,200,000 | $150,500,000 | $305,800,000 | $15,500,000 | $667,000,000 | 10.4% |
| Rhode Island | $37,900,000 | $35,500,000 | $40,200,000 | $1,500,000 | $115,000,000 | 10.1% |
| South Carolina | $106,900,000 | $74,600,000 | $70,000,000 | $5,400,000 | $256,800,000 | 8.4% |
| South Dakota | $9,700,000 | $4,700,000 | $600,000 | $600,000 | $15,600,000 | 7.1% |
| Tennessee | $250,700,000 | $69,400,000 | $14,200,000 | $7,000,000 | $341,300,000 | 8.3% |
| Texas | $3,043,900,000 | $1,959,100,000 | $276,300,000 | $67,100,000 | $5,346,400,000 | 8.8% |
| Utah | $124,700,000 | $62,000,000 | $103,400,000 | $2,400,000 | $292,500,000 | 9.4% |
| Vermont | $2,500,000 | $3,600,000 | $3,900,000 | $100,000 | $10,100,000 | 9.0% |
| Virginia | $261,400,000 | $223,800,000 | $337,800,000 | $33,900,000 | $856,900,000 | 9.0% |
| Washington | $691,300,000 | $302,400,000 | $89,400,000 | $16,200,000 | $1,099,300,000 | 8.7% |
| West Virginia | $5,000,000 | $2,100,000 | $5,000,000 | $800,000 | $12,900,000 | 10.0% |
| Wisconsin | $76,600,000 | $76,400,000 | $92,100,000 | $1,800,000 | $246,800,000 | 9.0% |
| Wyoming | $7,300,000 | $5,800,000 | $3,800,000 | $1,300,000 | $18,100,000 | 7.1% |
| SUM ALL STATES** | $16,192,000,000 | $11,281,500,000 | $11,713,500,000 | $558,700,000 | $39,745,700,000 | 9.7% |
| Payments to other states | N/A | N/A | N/A | N/A | $4,582,800,000 | 1.1% |
| NATIONAL TOTAL*** | N/A | N/A | N/A | N/A | $44,328,600,000 | 10.8% |
*Includes state share of Unemployment Insurance (UI) taxes.
**Figures may not sum to totals due to rounding.
***National total differs from the all states sum because it includes taxes paid by residents of one state to state and local governments in other states.
Source: Institute on Taxation and Economic Policy
APPENDIX TABLE 3.
Change in State and Local Tax Contributions by the Currently Undocumented Population if Legal State is Granted
(Scroll right for more)
| State | Sales and Excise Taxes |
Property Taxes |
Personal and Business Income Taxes* |
Other Taxes |
Total State and Local Taxes** |
Effective Tax Rate |
| Alabama | $5,900,000 | $1,800,000 | $26,000,000 | $300,000 | $34,000,000 | 1.0% |
| Alaska | $100,000 | $500,000 | $1,200,000 | $100,000 | $2,000,000 | 0.3% |
| Arizona | $32,400,000 | $15,500,000 | $61,200,000 | $300,000 | $109,500,000 | 0.4% |
| Arkansas | $9,400,000 | $3,200,000 | $22,200,000 | $200,000 | $35,000,000 | 0.7% |
| California | $258,400,000 | $214,600,000 | $1,356,000,000 | $15,500,000 | $1,844,600,000 | 1.0% |
| Colorado | $11,900,000 | $12,400,000 | $76,700,000 | $300,000 | $101,300,000 | 0.9% |
| Connecticut | $8,800,000 | $10,900,000 | $70,200,000 | $100,000 | $90,000,000 | 1.1% |
| Delaware | $700,000 | $1,200,000 | $15,800,000 | $200,000 | $18,000,000 | 1.3% |
| District of Columbia | $1,300,000 | $2,600,000 | $17,100,000 | $100,000 | $21,100,000 | 1.6% |
| Florida | $83,600,000 | $54,300,000 | $14,400,000 | $2,000,000 | $154,300,000 | -0.1% |
| Georgia | $31,500,000 | $20,700,000 | $175,300,000 | $600,000 | $228,100,000 | 1.1% |
| Hawaii | $4,800,000 | $2,300,000 | $30,000,000 | $100,000 | $37,200,000 | 1.5% |
| Idaho | $2,300,000 | $1,600,000 | $14,000,000 | $100,000 | $18,000,000 | 1.0% |
| Illinois | $37,200,000 | $46,900,000 | $280,500,000 | $1,500,000 | $366,100,000 | 1.3% |
| Indiana | $9,300,000 | $5,600,000 | $53,700,000 | $100,000 | $68,700,000 | 1.1% |
| Iowa | $3,700,000 | $3,600,000 | $18,300,000 | $100,000 | $25,700,000 | 0.9% |
| Kansas | $6,900,000 | $5,900,000 | $31,900,000 | $200,000 | $44,900,000 | 1.0% |
| Kentucky | $4,100,000 | $1,700,000 | $27,100,000 | $100,000 | $33,000,000 | 1.4% |
| Louisiana | $9,500,000 | $2,600,000 | $17,600,000 | $300,000 | $29,900,000 | 0.6% |
| Maine | $300,000 | $600,000 | $3,200,000 | — | $4,100,000 | 1.3% |
| Maryland | $15,800,000 | $19,300,000 | $226,500,000 | $500,000 | $262,100,000 | 1.9% |
| Massachusetts | $9,900,000 | $21,300,000 | $165,700,000 | $400,000 | $197,300,000 | 1.4% |
| Michigan | $7,500,000 | $8,800,000 | $46,600,000 | $100,000 | $63,100,000 | 0.8% |
| Minnesota | $5,900,000 | $6,900,000 | $59,400,000 | $200,000 | $72,400,000 | 1.6% |
| Mississippi | $2,500,000 | $1,200,000 | $4,500,000 | — | $8,200,000 | 0.5% |
| Missouri | $3,900,000 | $2,600,000 | $19,000,000 | $100,000 | $25,600,000 | 0.8% |
| Montana | — | — | $500,000 | — | $500,000 | 1.1% |
| Nebraska | $3,600,000 | $3,400,000 | $16,000,000 | $100,000 | $23,200,000 | 0.8% |
| Nevada | $20,100,000 | $12,300,000 | $43,900,000 | $1,800,000 | $78,100,000 | 0.4% |
| New Hampshire | $200,000 | $1,600,000 | $1,100,000 | — | $2,800,000 | 0.1% |
| New Jersey | $26,600,000 | $47,800,000 | $256,700,000 | $1,400,000 | $332,500,000 | 1.1% |
| New Mexico | $8,200,000 | $2,800,000 | $8,400,000 | $900,000 | $20,300,000 | 0.3% |
| New York | $61,200,000 | $92,600,000 | $696,600,000 | $400,000 | $850,800,000 | 1.7% |
| North Carolina | $26,900,000 | $12,800,000 | $111,100,000 | $600,000 | $151,400,000 | 0.8% |
| North Dakota | $500,000 | $200,000 | $700,000 | $100,000 | $1,500,000 | 0.1% |
| Ohio | $8,100,000 | $6,200,000 | $52,400,000 | $300,000 | $67,000,000 | 1.1% |
| Oklahoma | $9,400,000 | $4,300,000 | $31,500,000 | $500,000 | $45,700,000 | 0.8% |
| Oregon | $3,100,000 | $8,000,000 | $123,100,000 | $400,000 | $134,600,000 | 2.3% |
| Pennsylvania | $11,600,000 | $10,900,000 | $120,500,000 | $900,000 | $143,900,000 | 1.4% |
| Rhode Island | $2,400,000 | $2,900,000 | $14,700,000 | $100,000 | $20,100,000 | 0.9% |
| South Carolina | $7,700,000 | $5,900,000 | $29,000,000 | $500,000 | $43,100,000 | 0.7% |
| South Dakota | $700,000 | $300,000 | $200,000 | — | $1,300,000 | -0.1% |
| Tennessee | $17,500,000 | $5,500,000 | $3,400,000 | $600,000 | $27,000,000 | -0.1% |
| Texas | $214,900,000 | $157,000,000 | $95,400,000 | $6,600,000 | $473,900,000 | 0.0% |
| Utah | $8,900,000 | $5,300,000 | $43,000,000 | $200,000 | $57,400,000 | 1.1% |
| Vermont | $200,000 | $400,000 | $1,700,000 | — | $2,300,000 | 1.3% |
| Virginia | $16,600,000 | $19,600,000 | $128,300,000 | $2,600,000 | $167,100,000 | 1.0% |
| Washington | $44,700,000 | $24,200,000 | $32,000,000 | $1,100,000 | $101,900,000 | 0.0% |
| West Virginia | $300,000 | $200,000 | $2,000,000 | $100,000 | $2,500,000 | 1.1% |
| Wisconsin | $5,100,000 | $6,300,000 | $36,400,000 | $100,000 | $47,900,000 | 1.0% |
| Wyoming | $400,000 | $500,000 | $1,300,000 | $100,000 | $2,300,000 | 0.3% |
| SUM ALL STATES** | $1,066,700,000 | $899,800,000 | $4,683,800,000 | $42,900,000 | $6,693,100,000 | 0.8% |
| Payments to other states | N/A | N/A | N/A | N/A | $357,900,000 | 0.0% |
| NATIONAL TOTAL*** | N/A | N/A | N/A | N/A | $7,051,000,000 | 0.8% |
*Includes state share of Unemployment Insurance (UI) taxes.
**Figures may not sum to totals due to rounding.
***National total differs from the all states sum because it includes taxes paid by residents of one state to state and local governments in other states.
Source: Institute on Taxation and Economic Policy
APPENDIX TABLE 4.
State and Local Effective Tax Rate Data for the Currently Undocumented Population, and Comparison to Each State’s Top 1% of Taxpayers
| — Currently Undocumented Immigrants — | |||||
| State | Current Tax Rate |
Potential Tax Rate with Legal Status |
Current Tax Rate, Top 1% of All Taxpayers |
Difference*, Current Law |
Difference*, with Legal Status |
| Alabama | 8.7% | 9.7% | 5.4% | 3.3% | 4.3% |
| Alaska | 5.9% | 6.2% | 2.8% | 3.1% | 3.4% |
| Arizona | 8.4% | 8.9% | 5.0% | 3.4% | 3.8% |
| Arkansas | 9.0% | 9.8% | 5.8% | 3.2% | 3.9% |
| California | 9.1% | 10.1% | 12.1% | -2.9% | -2.0% |
| Colorado | 7.8% | 8.8% | 7.0% | 0.8% | 1.7% |
| Connecticut | 9.5% | 10.6% | 7.9% | 1.7% | 2.7% |
| Delaware | 6.8% | 8.1% | 6.8% | -0.1% | 1.3% |
| District of Columbia | 9.5% | 11.1% | 11.4% | -1.9% | -0.3% |
| Florida | 8.0% | 7.9% | 2.7% | 5.2% | 5.1% |
| Georgia | 8.0% | 9.0% | 6.9% | 1.0% | 2.1% |
| Hawaii | 11.8% | 13.3% | 10.1% | 1.7% | 3.2% |
| Idaho | 7.2% | 8.2% | 6.4% | 0.7% | 1.7% |
| Illinois | 10.3% | 11.6% | 7.3% | 3.0% | 4.3% |
| Indiana | 8.5% | 9.6% | 6.2% | 2.3% | 3.4% |
| Iowa | 9.6% | 10.6% | 7.2% | 2.5% | 3.4% |
| Kansas | 9.7% | 10.7% | 7.6% | 2.1% | 3.1% |
| Kentucky | 8.5% | 9.9% | 6.6% | 1.9% | 3.2% |
| Louisiana | 9.9% | 10.5% | 6.5% | 3.4% | 4.0% |
| Maine | 8.9% | 10.2% | 9.5% | -0.6% | 0.7% |
| Maryland | 8.7% | 10.6% | 9.1% | -0.4% | 1.5% |
| Massachusetts | 7.6% | 9.0% | 8.9% | -1.3% | 0.1% |
| Michigan | 8.0% | 8.8% | 5.7% | 2.2% | 3.1% |
| Minnesota | 7.8% | 9.4% | 10.5% | -2.8% | -1.2% |
| Mississippi | 8.9% | 9.4% | 7.0% | 1.9% | 2.5% |
| Missouri | 7.4% | 8.2% | 5.7% | 1.7% | 2.5% |
| Montana | 6.9% | 8.0% | 6.8% | 0.1% | 1.3% |
| Nebraska | 8.7% | 9.5% | 7.3% | 1.4% | 2.2% |
| Nevada | 8.4% | 8.8% | 2.8% | 5.6% | 6.0% |
| New Hampshire | 5.0% | 5.1% | 2.9% | 2.1% | 2.2% |
| New Jersey | 8.4% | 9.5% | 10.5% | -2.1% | -1.0% |
| New Mexico | 9.3% | 9.5% | 8.2% | 1.1% | 1.3% |
| New York | 10.6% | 12.3% | 13.5% | -2.9% | -1.2% |
| North Carolina | 7.6% | 8.5% | 6.0% | 1.6% | 2.5% |
| North Dakota | 6.9% | 6.9% | 5.0% | 1.9% | 2.0% |
| Ohio | 8.2% | 9.4% | 6.3% | 1.9% | 3.0% |
| Oklahoma | 8.9% | 9.8% | 6.4% | 2.6% | 3.4% |
| Oregon | 9.0% | 11.3% | 10.5% | -1.5% | 0.8% |
| Pennsylvania | 9.0% | 10.4% | 6.0% | 2.9% | 4.4% |
| Rhode Island | 9.2% | 10.1% | 8.6% | 0.5% | 1.5% |
| South Carolina | 7.7% | 8.4% | 6.5% | 1.2% | 1.9% |
| South Dakota | 7.2% | 7.1% | 2.6% | 4.6% | 4.5% |
| Tennessee | 8.4% | 8.3% | 3.8% | 4.6% | 4.5% |
| Texas | 8.9% | 8.8% | 4.6% | 4.3% | 4.3% |
| Utah | 8.3% | 9.4% | 6.4% | 1.9% | 3.0% |
| Vermont | 7.7% | 9.0% | 10.1% | -2.4% | -1.1% |
| Virginia | 7.9% | 9.0% | 7.2% | 0.7% | 1.7% |
| Washington | 8.7% | 8.7% | 4.1% | 4.6% | 4.7% |
| West Virginia | 8.9% | 10.0% | 7.2% | 1.7% | 2.8% |
| Wisconsin | 8.0% | 9.0% | 6.7% | 1.3% | 2.3% |
| Wyoming | 6.8% | 7.1% | 3.4% | 3.4% | 3.7% |
| SUM ALL STATES | 8.9% | 9.7% | 7.2% | 1.7% | 2.5% |
| Payments to other states | 1.1% | 1.1% | 2.6% | -1.4% | -1.5% |
| NATIONAL TOTAL** | 10.0% | 10.8% | 9.8% | 0.2% | 1.0% |
| Number of States Where Undocumented Immigrants Pay Higher Rate than the Top 1% of All Taxpayers: | |||||
| Undocumented Pay More: | 40 | 45 | |||
| Undocumented Pay Less: | 11 | 6 | |||
*Figures may not sum to totals due to rounding.
**National total differs from the all states sum because it includes taxes paid by residents of one state to state and local governments in other states.
Source: Institute on Taxation and Economic Policy
APPENDIX TABLE 5.
Population and Income Data for the Undocumented Immigrant Population
| State | Population | Aggregate Income |
| Alabama | 61,000 | $1,684,000,000 |
| Alaska | 6,000 | $214,000,000 |
| Arizona | 263,000 | $8,343,000,000 |
| Arkansas | 64,000 | $2,081,000,000 |
| California | 2,434,000 | $92,803,000,000 |
| Colorado | 156,000 | $5,585,000,000 |
| Connecticut | 117,000 | $4,264,000,000 |
| Delaware | 28,000 | $843,000,000 |
| District of Columbia | 17,000 | $773,000,000 |
| Florida | 747,000 | $23,074,000,000 |
| Georgia | 364,000 | $11,677,000,000 |
| Hawaii | 39,000 | $1,329,000,000 |
| Idaho | 30,000 | $1,001,000,000 |
| Illinois | 422,000 | $15,054,000,000 |
| Indiana | 105,000 | $3,353,000,000 |
| Iowa | 42,000 | $1,288,000,000 |
| Kansas | 75,000 | $2,157,000,000 |
| Kentucky | 51,000 | $1,400,000,000 |
| Louisiana | 64,000 | $1,823,000,000 |
| Maine | 5,000 | $176,000,000 |
| Maryland | 259,000 | $8,945,000,000 |
| Massachusetts | 198,000 | $8,545,000,000 |
| Michigan | 111,000 | $3,644,000,000 |
| Minnesota | 82,000 | $2,856,000,000 |
| Mississippi | 21,000 | $560,000,000 |
| Missouri | 57,000 | $1,543,000,000 |
| Montana | 1,000 | $28,000,000 |
| Nebraska | 42,000 | $1,307,000,000 |
| Nevada | 180,000 | $6,034,000,000 |
| New Hampshire | 13,000 | $467,000,000 |
| New Jersey | 428,000 | $15,837,000,000 |
| New Mexico | 61,000 | $1,661,000,000 |
| New York | 676,000 | $29,186,000,000 |
| North Carolina | 314,000 | $9,065,000,000 |
| North Dakota | 7,000 | $189,000,000 |
| Ohio | 104,000 | $3,225,000,000 |
| Oklahoma | 89,000 | $2,545,000,000 |
| Oregon | 112,000 | $3,921,000,000 |
| Pennsylvania | 174,000 | $5,845,000,000 |
| Rhode Island | 29,000 | $1,037,000,000 |
| South Carolina | 97,000 | $2,784,000,000 |
| South Dakota | 8,000 | $199,000,000 |
| Tennessee | 134,000 | $3,744,000,000 |
| Texas | 1,863,000 | $54,978,000,000 |
| Utah | 92,000 | $2,825,000,000 |
| Vermont | 4,000 | $102,000,000 |
| Virginia | 274,000 | $8,703,000,000 |
| Washington | 276,000 | $11,445,000,000 |
| West Virginia | 4,000 | $117,000,000 |
| Wisconsin | 76,000 | $2,496,000,000 |
| Wyoming | 6,000 | $232,000,000 |
| SUM ALL STATES | 10,900,000 | $373,000,000,000 |
Source: Institute on Taxation and Economic Policy
Appendix B: Methodology
The methodology underlying this report involves three broad components. The first is construction of a data file containing income and other tax-relevant economic and demographic data for the undocumented population. The second is application of federal, state, and local tax parameters to the data in that file, with certain adjustments to reflect the ways in which undocumented immigrants interact with the tax code. The third component of the work is to adjust both the underlying economic data and the applicable tax parameters to reflect the likely impact that granting legal status would have on the economic profile and tax contributions of currently undocumented immigrants.
Each of these three steps is described below, followed by a discussion of how the methodology underlying this report differs from ITEP’s most recent prior study of this issue (Gee et al. 2017).
Construction of the Undocumented Immigrant Data File
The analysis begins with our estimates of the economic profile of undocumented immigrants in each state, which is based on our analysis of the U.S. Census Bureau’s American Community Survey (ACS) PUMS 2018-2022 5-year extract. It is a variation on the residual method employed by the Department of Homeland Security (Baker 2021) and of similar methods employed by other researchers (Passel and Cohn 2018; Van Hook et al. 2023; Warren 2024).
The method utilizes demographic, employment, and other social and economic characteristics to make a series of ‘logical edits’ to the entire population of the United States that leaves us with a pool of individuals who are very likely undocumented. The logical edits we employed take place over several iterations, which are listed below.
Round 1: Identify the entire pool of potential non-citizen residents of the United States as a starting point for the analysis. This includes anyone who:
- Is part of the civilian noninstitutionalized population.
- Arrived in the U.S. after 1980.
- Reported their citizenship status as ‘Not a citizen of the U.S.,’ report being recently naturalized (within the last 3 years for spouses of U.S citizens and within 6 years for all other reported naturalized citizens), or report being a naturalized citizen whose country of origin is Mexico.[13]
- Listed their country of birth as Cuba and their date of entry to the U.S. as after 2017, before which all Cuban immigrants are assumed to have taken advantage of the Cuban Adjustment Act.
Round 2: Disqualify people within this universe who likely have lawful permanent residence or temporary authorization to reside in the United States. For some categories of immigration status, these determinations are based on eligibility and then matched to administrative totals, such as those provided in Baker and Miller (2022). This includes anyone who:
- Is a likely recipient of Deferred Action for Childhood Arrivals (DACA), based on age, year of entry into the United States, and occupational information.
- Works in an industry with extensive licensing requirements or strict citizenship requirements, such as the medical field, the legal field, the U.S. government, or the military.
- Likely has a category of work authorization based on a combination of educational attainment and occupations related to highly skilled, religious, or diplomatic work.
- Is a foreign student.
- Is a foreign spouse of a U.S. citizen or a likely visa-holder.
- May be a refugee based on country of birth, year of entry, and DHS-reported refugee arrivals.
- Comes from a country designated by DHS for having Temporary Protected Status.
Round 3: Disqualify people within this universe who receive public assistance for which undocumented individuals are ineligible.
We then adjust for undercounting of the undocumented population in the ACS. It is well established that the foreign-born population is consistently undercounted compared to the native-born population. We adjust for an expected undercount of 13 percent for those immigrants who arrived in the most recent year, with that rate declining by 7.5 percent in each prior year of arrival, in line with Baker (2021). We also make an additional adjustment, based on the work of Warren (2024), to account for more severe undercounting of immigrants from El Salvador, Guatemala, and Honduras in 2020, 2021, and 2022. The final step in our calculation is a slight adjustment to bring our population total in line with the 2022 population count of 10.9 million found in Warren (2024), which builds on the work of Warren and Warren (2013). The result is a 2022-level population total, with detailed economic and demographic information supplied by the larger sample size available in the 5-year, 2018-2022 ACS data.
After identifying undocumented individuals, it is necessary to group those individuals into tax units—which are persons or groups of people who file one tax return or, for nonfilers, who would file one tax return if they were to file. Tax units are the standard unit of analysis in ITEP’s research and in the research of most other organizations that engage in tax modeling (see, for example, JCT 2023 and Gillette et al. 2023). The ACS household is a conceptually different unit of analysis from a tax unit. Tax units can either be smaller or larger than the Census definition of households, though on average they are smaller because the latter can include roommates or multigenerational families that file more than one tax return. ITEP translates ACS households into tax units using an algorithm similar to those described in Cilke (1994) and Rohaly et al. (2005). ITEP uses information about individual relationships, ages, marital status, and incomes to determine dependents, heads of households, spouses, and filing statuses. We then group these people into tax units.
This methodology produces detailed information on tax units in the ACS with undocumented individuals and their economic profiles. For our tax modeling, the most important component of that economic profile is income level, which is taken from the ACS with certain adjustments to account for consistent underreporting of income (particularly self-employment income) in Census surveys, as discussed in Hurst et al. (2014) and Rothbaum (2015). We compute income for undocumented immigrants within seven income groups in each state: the bottom four quintiles as well as the next 15 percent, next 4 percent, and top 1 percent of tax units overall. We use this information to compute the tax contributions of undocumented immigrants across all tax types using the approaches described below.
Application of Tax Parameters to the Data File
The method used in this analysis involves applying modified versions of effective tax rates obtained from three sources: the seventh edition of ITEP’s Who Pays? report, which measures the impact of state and local taxes on families at every income level (ITEP 2024), a subsequent report examining federal tax impacts by income level (Wamhoff 2024), and custom runs of the ITEP Microsimulation Tax Model completed for this study. Those tax rates are applied to the undocumented immigrant data file with adjustments as described below that reflect economic, demographic, behavioral, and statutory factors that impact the tax contributions of undocumented immigrants. In most cases, we use tax rates calculated for the non-senior population as the starting point of our analysis because 97 percent of the undocumented population is below the age of 65 and retirement income makes up an extremely small share (less than 1 percent) of the total income flowing to undocumented immigrants.
Individual income and payroll taxes
This analysis of the individual income and payroll tax contributions of undocumented immigrants relies in part on our estimates of the distribution of income, by source, among those immigrants. After calculating the income received by undocumented immigrants within each income band, we apply modified versions of our population-wide effective income tax rates to each of those bands.
The first step in modifying those tax rates is to remove the federal Earned Income Tax Credit (EITC) and most state EITCs from the tax rates facing undocumented immigrants. This is necessary because the federal government and most states prohibit filers who do not have a valid SSN from claiming the EITC.
We also scale back the amount of federal Child Tax Credit (CTC) claimed by undocumented families to reflect a provision of federal law that limits eligibility based on the citizenship status of otherwise qualifying children. State CTCs are also scaled back in the small number of states that mirror this provision in their own laws. The CTC adjustment is done by identifying the share of children in undocumented tax units who we expect are ineligible for state CTCs based on citizenship status, and then scaling down potential CTC claims by that share.
These refinements to the EITC and CTC provide us with a series of effective income tax rates, by income level, that better reflect the income tax laws that apply to undocumented immigrants.
The next step in the calculation requires an adjustment to account for the administrative factors confronting undocumented immigrants as they navigate federal, state, and local tax systems. Those factors can yield either higher, or lower, tax contributions by undocumented individuals than would be the case among similarly situated U.S. citizens.
It is widely understood that undocumented immigrants exhibit a lower income tax compliance rate than other households, though perhaps not as low as is commonly thought. The literature on this subject has coalesced around a compliance rate in the range of 50 to 75 percent (CBO 2007). Past ITEP studies, for instance, have adopted a 50 percent assumption in the interest of conservative estimation (Gee et al. 2017). The few studies that have attempted formal measurement of the compliance rate, however, generally suggest a rate significantly above the 50 percent level.
For example, a survey of more than 700 undocumented immigrants from Mexico by Cornelius and Lewis (2006) found that 75 percent paid federal income taxes via withholding, filing an income tax return, or both. This finding aligns closely with earlier work by North and Houstoun (1976) which, in a survey of nearly 800 undocumented immigrants, found that 73 percent paid federal income tax via withholding.
But the income tax compliance rate does not provide a full picture of the tax contributions of undocumented immigrants. In the literature on this subject, the income tax compliance rate typically refers only to the share of undocumented immigrants who pay income tax through withholding or filing returns. For purposes of revenue estimation, however, it is necessary to look not at the share of tax units who pay, but rather at the share of taxes paid relative to the share of taxes owed. We will refer to this share as the “contribution rate.”
The overall compliance rate differs from the overall contribution rate because some undocumented individuals pay more income tax than they owe. North and Houstoun (1976), for example, found that while 73 percent of undocumented immigrants paid federal income tax via withholding, just 32 percent of undocumented immigrants filed an income tax return. While the tax filing process has changed significantly for undocumented immigrants since the 1970s, it is clear that a significant number of undocumented immigrants still pay through withholding without filing returns. Because most taxpayers see more tax withheld from their paychecks than they owe and receive a refund upon filing, this suggests that a meaningful number of undocumented immigrants are overpaying federal, state, and local income taxes.
This phenomenon is widespread and has been the subject of some study. The Comptroller of Maryland, for instance, uses the term “unallocated withholding” to refer to tax withholding from individuals who do not file income tax returns (Comptroller of Maryland 2021). Using confidential data from information returns, one study conducted by an official at the Congressional Joint Committee on Taxation found that, at the federal level, 2.7 million people had $7.1 billion in federal income withheld from the paychecks in 2011 and yet failed to file a return despite having incomes above the filing threshold (Cilke 2014). Another study conducted for the IRS Statistics of Income Division estimated that nonfilers failed to claim $3.8 billion in refunds of their withholding in 2005, even before considering the impact of the EITC and CTC (Lawrence et al. 2011). While there are a variety of reasons that a person might choose not to file a return, there is no doubt that a meaningful number of undocumented immigrants are among this group of income tax over-payers.
With this research in mind, we target a 60 percent contribution rate for the undocumented population under the federal individual income tax—a value slightly below the midpoint of the 50 to 75 percent range described earlier. To be clear, the 60 percent contribution rate used in this study implies an income tax compliance rate somewhat below 60 percent because some undocumented immigrants who comply with the tax law pay more income tax than they owe (a fact that bolsters the contribution rate without impacting the compliance rate). Available data do not allow us to translate our contribution rate into a compliance rate and, indeed, such a translation is not needed for the calculations underlying the estimates presented in this report. A sensitivity analysis examining alternative contribution rates of 50 and 75 percent is provided later in this methodology.
The first step in achieving our 60 percent contribution rate target is to derive contribution rates, by income source, for the broader U.S. population. U.S. citizens, much like their undocumented immigrant neighbors, do not exhibit perfect compliance with federal tax law. The IRS estimates that the overall net contribution rate for all federal taxes was 86 percent in 2021 (Krause 2023). For the individual income tax, the net contribution rate is likely closer to 82 percent. These rates vary significantly across individuals based largely on the forms of income they receive. Taxes owed are more likely to be paid on sources of income with robust third-party reporting requirements, such as salaries and wages (Johns and Slemrod 2010; Krause et al. 2023). Our analysis suggests that the average U.S. resident with an income profile in line with that seen in the undocumented population exhibits a contribution rate of 92 percent. This is above the population-wide rate of 82 percent mentioned above because undocumented immigrants receive an unusually large share of their income from salaries and wages.
With contribution rates for the overall U.S. population in hand, we then devise a second set of contribution rates specifically for the undocumented population that allow us to achieve our 60 percent target for the contribution rate under the federal individual income tax. The fact that these contribution rates are constructed separately for each kind of income has the advantage of allowing us to employ different contribution rates to different tax bases. Unemployment insurance taxes, for example, exhibit somewhat higher contribution rates than Social Security and Medicare taxes because the former apply only to wages while the latter include self-employment income that is more likely to go unreported.
Both the employer and employee share of payroll taxes are included in this analysis as there is broad consensus among tax modelers that these taxes are ultimately borne by the employee (Department of the Treasury 2021; CBO 2023). This approach is consistent with our approach to other forms of indirect taxation. For example, motor fuel taxes (discussed below) are remitted by a small number of fuel suppliers, but the final incidence of these taxes is widely understood to fall on fuel consumers and their impact is therefore presented as such.
Sales, excise, and most other consumption taxes
Taxes on purchases made by undocumented immigrants make up the largest share of their state and local tax contributions. These payments are made both through general sales taxes, which apply to a wide range of purchases, as well as through selective taxes levied on narrow categories of goods and services such as alcohol, tobacco, motor fuel, and utilities. These taxes on spending are often referred to as consumption taxes. While the federal government does not levy a broad consumption tax, it does tax certain narrow categories of purchases such as alcohol, tobacco, and motor fuel.
ITEP’s consumption tax model is described in the methodology section of our most recent Who Pays? report (ITEP 2024). The primary data source underlying the model is the Bureau of Labor Statistics’ Consumer Expenditure Survey (CEX), though it is supplemented with data from a variety of other sources. Crucially, the model provides estimates not just the sales and excise taxes paid directly by individuals on their own purchases, but also the sizeable amount of consumption taxes that are paid by businesses on their inputs (Phillips and Ibaid 2019). These taxes are ultimately borne by those businesses’ consumers, workers, and owners—and a portion of those tax payments therefore come from undocumented immigrants.
The ITEP model produces effective tax rates for all consumption tax types, by income level, which provide a key input to our analysis. This analysis assumes that undocumented immigrants’ spending habits are broadly similar to those of U.S. citizens with similar levels of income, with a few exceptions outlined below that reduce the amount of sales and excise tax paid.
We assign 15 percent of income earned by undocumented immigrants to remittances to family members living in other nations. That income is considered unavailable for taxable consumption. The body of research into remittances made by immigrants living in the United States has produced a wide range of estimates depending on the methods used and the populations being studied. Yang (2015) summarizes several studies that find remittances as a share of earnings for various migrant populations in the U.S. as low as 1.4 percent of earnings and as high as 37.7 percent of earnings. Our 15 percent estimate is well within this range and is calibrated to match the United Nations’ 2019 estimate of the share of migrant earnings devoted to remittances worldwide.
To calculate the amount of sales, excise, and other consumption taxes paid by undocumented immigrants, we apply a modified version of the effective consumption tax rates calculated in ITEP (2024) and Wamhoff (2024) to the portion of income earned by undocumented immigrants that is not devoted to remittances. This calculation is performed separately for each of our seven income groupings. A sensitivity analysis examining alternative remittance values of 10 and 20 percent is provided later in this methodology.
Consumption taxes on tobacco
Our federal, state, and local tobacco tax estimates account for the below-average smoking rates observed among immigrants to the U.S. as demonstrated in Bosdriesz et al. (2013) and Azagba et al. (2019). In most states, tobacco is subject to higher effective tax rates than other types of purchases and thus it is important that we avoid overstating the amount of undocumented immigrant spending occurring in this high-tax category. The overall tax rate charged on tobacco is also bolstered with federal excise taxes. Our calculations apply tobacco usage rates among the undocumented population at one half the rate seen among the broader U.S. population.
Vehicle-related taxes
Our analysis of the ACS finds that undocumented immigrants are less likely to own vehicles than other individuals living in the U.S. Other researchers have observed this as well (Cho 2022). The significance of this finding to tax revenue measurement, however, is not entirely clear. While there is little doubt that undocumented immigrants are spending less than average on vehicle-related expenses, the tax impact of that depends on whether foregone spending in that category is instead directed toward taxable spending in another category, or toward a nontaxable purpose such as spending in an exempt category (e.g., public transportation fares) or an increase in personal savings. We err on the side of slightly underestimating the tax contributions of undocumented immigrants by assuming the latter.
More specifically, we reduce sales and excise tax contributions made through taxation of vehicle purchases, repairs, insurance, and motor fuel using ratios that reflect the lower number of vehicles owned by tax units with at least one undocumented individual. We also perform this adjustment for vehicle property taxes and registration charges, and for driver’s license charges in states that allow undocumented immigrants to obtain such licenses. These license charges are set to zero in states that prohibit undocumented immigrants from obtaining driver’s licenses (NCSL 2023).
Residential property taxes
Residential property taxes paid directly by undocumented homeowners and indirectly by undocumented renters make up the second largest component of this group’s state and local tax contribution, after sales and excise taxes on their purchases.
Our analysis of ACS data indicates that undocumented individuals are less likely to own their homes than other U.S. residents. Other researchers have made similar findings (Gelatt and Zong 2018).
After controlling for income level, our review of the ACS data did not uncover consistent, meaningful differences between the average property tax bill paid by undocumented homeowners and the average bill facing other homeowners. We therefore assign undocumented homeowners within each of our seven income groups the same effective property tax rate as all homeowners within that income group.
We then perform a similar calculation for the portion of the undocumented population that does not own homes. Renters are widely understood to pay at least a portion of the property tax levied on their homes as landlords pass along the cost of property taxes in the form of higher rents. We assume in each state that half of the tax is borne by the renter while the other half is borne by the landlord. We are aware of studies finding pass-through percentages both higher and lower than this amount but have concluded that this is roughly the midpoint estimate of the best available literature and, in particular, it is close in line with the estimates produced by Orr (1970), Hyman and Pasour (1973), and Black (1974).
Other included taxes
A wide array of federal, state, and local taxes is included in this study. Our approach to the bulk of those taxes is outlined above. Most other tax types, such as business property taxes, corporate income taxes, and severance taxes are indirect taxes that are formally imposed on business entities but are ultimately borne by people: specifically, by business owners in the form of a reduction in the return on their investments, by employees in the form of lower compensation, or by consumers in the form of higher prices. The parties who ultimately pay different types of indirect taxes vary based on the design of the tax and the nature of the industry being taxed (ITEP 2024).
For the labor share of these indirect taxes, we apply effective tax rates to undocumented immigrants within each income group consistent with the rates paid by the broader population of tax units within that group. For the consumer share, we apply reduced effective tax rates within each group that reflect the lower consumption level occurring due to remittances. For the capital share of these taxes, we reduce the effective tax rate faced by undocumented immigrants to reflect the fact that these immigrants exhibit lower levels of capital ownership than other U.S. residents at the same income level. Specifically, we scale down the capital tax rates by 60 percent based on our analysis of the ratios of capital income to total income in the undocumented population and the broader U.S. population. This adjustment, combined with the fact that undocumented immigrants are disproportionately found in the lower income groups where capital taxes tend to have little impact, means that taxes shifted to labor and consumption have a comparatively larger impact than taxes borne by owners of capital.
Omitted revenue sources
This analysis does not attempt to calculate tax payments made by undocumented immigrants through the federal Net Investment Income Tax, federal excise taxes on airfare, or estate and inheritance taxes levied at all levels of government. While it is clear that undocumented immigrants pay a non-zero amount of at least some of these levies, available data do not allow for reliable estimates and the revenue raised is likely to be low.
The analysis omits a wide array of non-tax revenues paid by undocumented immigrants such as public transportation fares, public parking fees, toll road charges, and college tuition. Including these non-tax revenue contributions would reveal undocumented immigrants to have even greater significance to federal, state, and local revenue streams than is found in this report.
Taxes paid to other states
The bulk of the state and local results reported in this study show the distribution of state and local taxes paid by undocumented immigrants to the states in which they live. This analysis allows lawmakers to understand how undocumented immigrants who live in their states are contributing toward funding the infrastructure, institutions, and services that their states provide.
Some state and local taxes, however, are “exported” to residents of other states. This happens through a variety of channels, such as when a person travels to another state and makes a taxable purchase or, more often, when a business pays a tax and its ultimate incidence is on consumers or firm owners located in another state. From a national perspective, it is worth examining these taxes as well to better understand the full state and local tax contribution made by undocumented immigrants.
We measure undocumented immigrants’ payment of exported taxes using the same kinds of adjustments applied to the measurement of in-state tax contributions, with an added downward adjustment of 50 percent to the direct portion of sales and excise taxes paid by visitors to other states. This adjustment is meant to reflect the fact that lower vehicle ownership, lower access to drivers’ licenses, and fear of deportation likely combine to lessen the amount of travel to other states undertaken by undocumented immigrants.
Sensitivity Analysis for Calculation of Current Tax Contributions
The results presented in this study are relatively insensitive to alternative assumptions regarding the income tax contribution rate (which affects income and payroll tax collections) and the remittance value (which affects consumption tax collections by lowering disposable income).
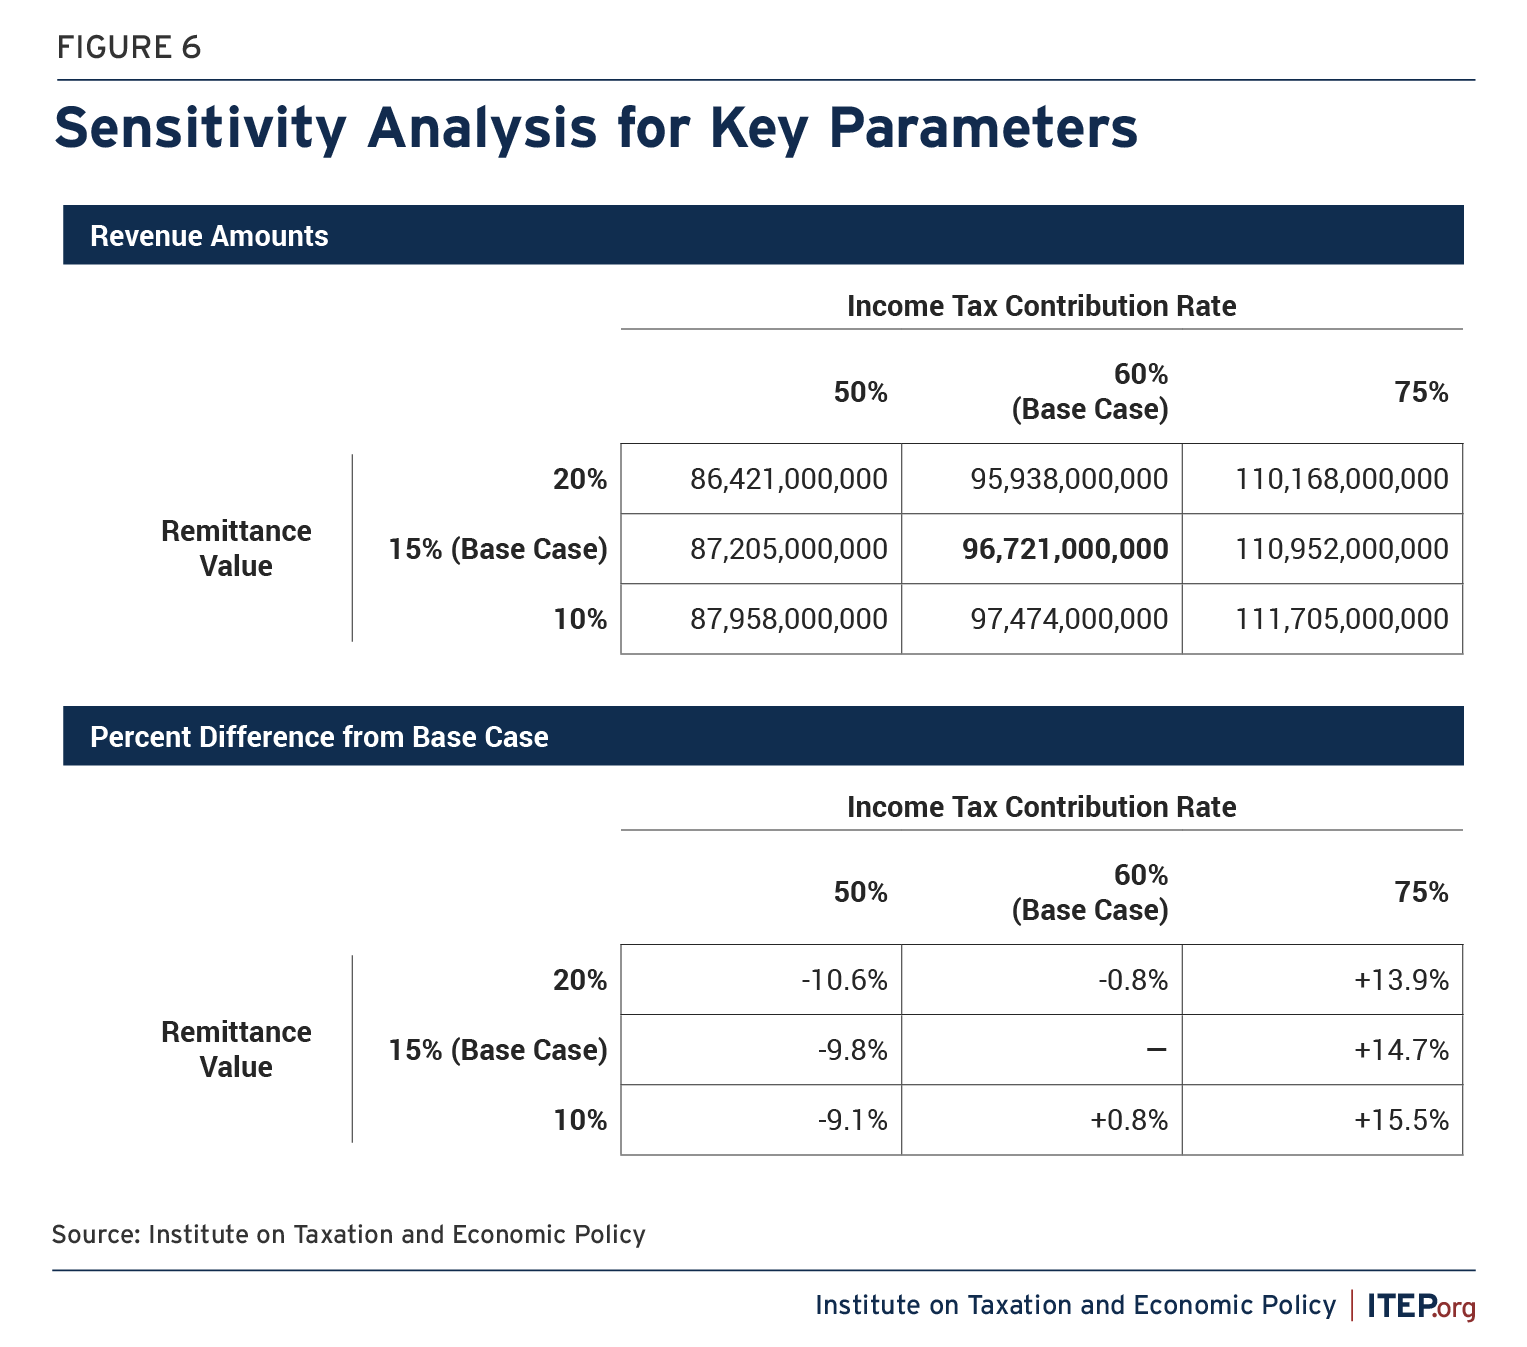
The base case presented in this study employs a 60 percent income tax contribution rate and 15 percent remittance value and yields a tax revenue estimate of $96.7 billion.
Under a more pessimistic set of alternative assumptions, with a 50 percent contribution rate (a value that we expect is likely too low) and a 20 percent remittance value (which we expect is likely too high), we instead see a revenue yield of $86.4 billion in 2022, or 10.6 percent less than in the base case.
On the other hand, if we apply a higher income tax contribution rate at 75 percent, and a lower remittance value at 20 percent, the resultant revenue figure is $111.7 billion, or 15.5 percent more than in the base case.
Figure 6 provides all nine pairs of possible assumptions for these two values.
Data and Tax Parameter Adjustments Used to Calculate Tax Contributions if Legal Status is Granted
This analysis examines both the current tax contribution of undocumented immigrants and this group’s likely tax contribution if it is granted legal status broadly as part of a comprehensive immigration reform. We modify four indicators in performing the latter calculation: earnings level, personal income tax compliance, eligibility for state Earned Income Tax Credits (EITC), and eligibility for Child Tax Credits (CTC).
Earnings boost: This study accounts for the fact that having the authority to work legally in the United States would increase undocumented immigrants’ wages and thus increase the taxes paid by those immigrants. A literature review by the Fiscal Policy Institute documented that legal immigrants are consistently found to have higher wages than undocumented immigrants and that gaining legal status is likely to boost the wages of affected workers by 6 to 15 percent (FPI 2013). A Congressional Budget Office report on the economic impact of immigration reform estimated the eventual wage boost to be 12 percent (CBO 2013).
This study applies a conservative estimate of a 10 percent wage increase from granting legal status to all undocumented immigrants. An increase in income would directly result in higher income tax payments from the currently undocumented population, and it would bring higher sales and property tax payments on the portion of that income directed toward consumption and housing.
In the face of uncertainty regarding the degree to which legal status would raise homeownership and vehicle ownership rates in the currently undocumented population, we do not apply any adjustments to these rates in calculating the additional tax contribution that would occur if legal status is granted. This suggests that our revenue figure in the full legal status scenario is likely to underestimate the increased tax contributions.
Personal income tax compliance: As explained above, our calculations apply an income tax contribution rate of 60 percent among undocumented immigrants. To calculate the anticipated income tax revenue gain from allowing undocumented immigrants to work in the U.S. legally, this analysis assumes that legal status would cause the formerly undocumented population to exhibit a state income tax compliance rate of 92 percent, a level on par with the contribution rate seen among people with an income profile that matches the one seen in the undocumented population.
Earned Income Tax Credit (EITC) eligibility: All members of a tax unit must have valid SSNs to receive the federal EITC and most state EITCs. This analysis assumes that undocumented immigrants do not claim state EITCs under current law in states where ITIN filers are disallowed from doing so, as documented in Davis and Butkus (2023a). The analysis also assumes that, under a scenario where legal status is granted, currently undocumented immigrants who otherwise meet the EITC eligibility requirements will begin to claim state EITCs for which they become eligible at the same rate observed in the rest of the population. That rate varies by state but, nationally, tends to hover between 75 and 80 percent (IRS 2024).
Child Tax Credit (CTC) eligibility: Most state CTCs are available to income tax filers broadly, without restrictions based on citizenship or immigration status. As documented in Davis and Butkus (2023b), however, some states with CTCs have rules mirroring the federal provision restricting CTC eligibility to children with valid SSNs. In these states, the calculations underlying this analysis only allow for a CTC for tax units with qualifying children. Granting these children legal status could therefore expand CTC claims in some states, which is reflected in this analysis.
Comparison to ITEP’s Prior Estimates of the State and Local Tax Contributions of Undocumented Immigrants
This report represents the first time that ITEP has quantified the federal tax contributions of undocumented immigrants. It is also the first time ITEP has measured the tax contributions that undocumented immigrants living in one state make (directly or indirectly) to the governments of other states. Prior ITEP research, however, has quantified the state and local tax contributions of undocumented immigrants to the states in which they reside (Gee et al. 2017). A brief discussion of the method and conclusions of ITEP’s prior research, relative to the comparable portions of this study, is provided below.
The analysis presented in this report finds that undocumented immigrants pay significantly more state and local taxes to their home states ($33.1 billion) than reported in ITEP’s prior research ($11.7 billion). The most important driver of this finding is an increase in our estimate of the amount of income earned by undocumented immigrants. Part of that increase is a result of wage growth that took place between 2014 (the base year of the previous study) and 2022 (the base year of this study). That wage growth is in large part a reflection of changes in the broader economy that increased wages for most workers in recent years. For undocumented immigrants specifically, wage growth may be bolstered further by the fact that the typical undocumented immigrant has deeper roots in the U.S. than was the case in 2014, as the median duration of U.S. residence among this population has increased during this time (Passel and Cohn 2019). In addition, we have also improved the technique, described above, that we use to estimate the amount of income earned by undocumented immigrants. Our new method is better suited to estimating the amount of income flowing to middle- and upper-income undocumented immigrants—income which we expect was understated in our prior estimates.
The analysis in this report also incorporates several changes to the calculations of tax amounts paid by undocumented immigrants. For instance, the tax calculations in this edition include tax policies enacted through the end of 2023, whereas the 2017 edition included changes enacted through 2014. This edition also includes estimates for some additional taxes—such as unemployment insurance taxes, motor vehicle property taxes, and taxes on business income and property—that were excluded from the 2017 edition. This edition uses a somewhat higher estimate for personal income tax compliance and somewhat lower estimate for sales and excise tax payments relative to income than the previous edition. The sales and excise tax change is the result of an upward revision in the amount of remittances sent to family members living in other countries.
Taken together, these improvements to our tax calculations have led to a modest increase in our estimate of the effective state and local tax rate facing undocumented immigrants. While our 2017 report found that undocumented immigrants paid an average rate of 8.0 percent to their home states, the comparable figure from this report is 8.9 percent.
Appendix B References
Azagba, Sunday, Lingpeng Shan, and Keely Latham (2019). “Assessing Trends and Healthy Migrant Paradox in Cigarette Smoking among US Immigrant Adults.” Prev. Med. (129): 105830.
Baker, Bryan (2021). “Estimates of the Unauthorized Immigrant Population Residing in the United States: January 2015-January 2018.” U.S. Department of Homeland Security, Office of Immigration Statistics: Population Estimates.
Baker, Bryan and Sarah Miller (2022). “Estimates of the Lawful Permanent Resident Population in the United States and the Subpopulation Eligible to Naturalize: 2022.” U.S. Department of Homeland Security, Office of Immigration Statistics: Population Estimates.
Black, David E. (1974). “The Incidence of Differential Property Taxes on Urban Housing: Some Further Evidence.” National Tax Journal 27 (2), 367-369.
Bosdriesz, Jizzo R., Nienke Lichthart, Margot I. Witvliet, Wim B. Busschers, Karien Stronks, and Anton E. Kunst (2013). “Smoking Prevalence among Migrants in the US Compared to the US-Born and the Population in Countries of Origin.” PLoS One 8 (3): e58654.
Brown, J. David, Misty L. Heggeness, Suzanne M. Dorinski, Lawrence Warren, and Moises Yi (2019). “Understanding the Quality of Alternative Citizenship Data Sources for the 2020 Census.” U.S. Census Bureau, Center for Economic Studies, Research Paper CES 18-38R.
CBO (2007). “The Impact of Unauthorized Immigrants on the Budgets of State and Local Governments.” Congressional Budget Office Pub. No. 2500. Washington, DC.
CBO (2013). “Economic Impact of S. 744, the Border Security, Economic Opportunity, and Immigration Modernization Act.” Congressional Budget Office. Washington, DC.
CBO (2023). “The Distribution of Household Income in 2020.” Congressional Budget Office Pub. No. 59509. Washington, DC.
Cho, Heepyung (2022). “Driver’s license reforms and job accessibility among undocumented immigrants.” Labour Economics 76 (C).
Cilke, James (1994). “The Treasury Individual Income Tax Simulation Model.” U.S. Department of the Treasury, Office of Tax Analysis.
Cilke, James (2014). “The Case of the Missing Strangers: What we Know and Don’t Know About Non-Filers.” Proceedings of the 107th Annual Conference of the National Tax Association in Santa Fe, NM.
Comptroller of Maryland (2021). “Tax Incidence Report: Tax Year 2017.” Comptroller of Maryland, Bureau of Revenue Estimates. Annapolis, MD.
Cornelius, Wayne A. and Jessica M. Lewis, eds. (2006). Impacts of Border Enforcement on Mexican Migration: The View from Sending Communities. Boulder, Col., Lynne Rienner Publishers and Center for Comparative Immigration Studies, UCSD.
Davis, Aidan and Neva Butkus (2023a). “Boosting Incomes, Improving Equity: State Earned Income Tax Credits in 2023.” Institute on Taxation and Economic Policy.
Davis, Aidan and Neva Butkus (2023b). “States are Boosting Economic Security with Child Tax Credits in 2023.” Institute on Taxation and Economic Policy.
Department of the Treasury (2021). “Treasury’s Distribution Methodology and Results.” U.S. Department of the Treasury, Office of Tax Analysis.
FPI (2013). “Three Ways Immigration Reform Would Make the Economy More Productive.” Fiscal Policy Institute.
Gelatt, Julia and Jie Zong (2018). “Settling In: A Profile of the Unauthorized Immigrant Population in the United States.” Migration Policy Institute.
Gee, Lisa Christensen, Matthew Gardner, Misha E. Hill, and Meg Wiehe (2017). “Undocumented Immigrants’ State and Local Tax Contributions.” Institute on Taxation and Economic Policy.
Gillette, Robert, Siva Anantham, Will Boning, Michael Cooper, Rachel Costello, Julie-Anne Cronin, Portia DeFilippes, John Eiler, Geoff Gee, Kye Lippold, Ithai Lurie, and Ankur Patel (2023). “U.S. Treasury Individual Income Tax Model.” U.S. Department of the Treasury, Office of Tax Analysis Technical Paper 12.
Gross, Stephen, Alice Wade, J. Patrick Skirvin, Michael Morris, K. Mark Bye, and Danielle Huston (2013). “Effects of Unauthorized Immigration on the Actuarial Status of the Social Security Trust Funds.” Social Security Administration: Office of the Chief Actuary, Baltimore, Maryland. Actuarial Note No. 151.
Hurst, Erik, Geng Li, and Benjamin Pugsley (2014). “Are Household Surveys Like Tax Forms: Evidence from Income Underreporting of the Self-Employed.” The Review of Economic Statistics 96 (1), 19-33.
Hyman, David N., and Ernest C. Pasour, Jr. (1973). “Property Tax Differentials and Residential Rents in North Carolina.” National Tax Journal 26 (2), 303-307.
ITEP (2024). “Who Pays? A Distributional Analysis of the Tax Systems in All 50 States. Seventh Edition.” Institute on Taxation and Economic Policy.
IRS (2024). “EITC Participation Rate by States Tax Years 2013 through 2020.” Internal Revenue Service. Accessed June 2024.
Krause et al. (2023). “Federal Tax Compliance Research: Tax Gap Projections for Tax Years 2020 and 2021.” Internal Revenue Service Publication 5869 (Rev. 10-2023).
JCT (2023). “Estimating Changes in the Federal Individual Income Tax: A Description of the Individual Tax Model for 2023.” Joint Committee on Taxation, JCX-48-23.
Johns, Andrew and Joel Slemrod (2010). “The Distribution of Income Tax Noncompliance.” National Tax Journal 63 (3), 397-418.
Lawrence, Joshua, Michael Udell, and Tiffany Young (2011). “The Income Tax Position of Persons Not Filing Returns for Tax Year 2005.” Select Paper Given at the 2011 IRS-TPC Research Conference: New Perspectives on Tax Administration in Washington, DC.
NCSL (2023). “States Offering Driver’s Licenses to Immigrants.” National Conference of State Legislatures, Brief.
North, David S. and Marion F. Houstoun (1976). “The Characteristics and Role of Illegal Aliens in the U.S. Labor Market: An Exploratory Study.” Linton and Co., Washington, D.C.
Orr, Larry L. (1970). “The Incidence of Differential Property Taxes: A Response.” National Tax Journal 23 (1), 99-101.
Passel, Jeffrey S., Rebecca L. Clark, and Michael Fix (1997). “Naturalization and Other Current Issues in U.S. Immigration: Intersections of Data and Policy.” Proceedings of the Social Statistics Section of the American Statistical Association in Alexandria, VA.
Passel, Jeffrey S. and D’Vera Cohn (2018). “U.S. Unauthorized Immigrant Total Dips to Lowest Level in a Decade.” Pew Research Center.
Passel, Jeffrey S. and D’Vera Cohn (2019). “Mexicans decline to less than half the U.S. unauthorized immigrant population for the first time.” Pew Research Center.
Phillips Andrew, and Muath Ibaid (2019). “The impact of imposing sales taxes on business inputs.” Ernst & Young LLP.
Rohaly, Jeffrey, Adam Carasso, and Mohammed Adeel Saleem (2005). “The Urban-Brookings Tax Policy Center Microsimulation Model: Documentation and Methodology for Version 0304.” Urban-Brookings Tax Policy Center.
Rothbaum, Jonathan L. (2015). “Comparing Income Aggregates: How do the CPS and ACS Match the National Income and Product Accounts, 2007-2012.” U.S. Census Bureau SEHSD Working Paper 2015-01.
United Nations (2019). “Remittances matter: 8 facts you don’t know about the money migrants send back home.” UN News: Global perspective on Human stories. Accessed April 30, 2024.
Van Hook, Jennifer and James D. Bachmeier (2013). “How Well Does the American Community Survey Count Naturalized Citizens?.” Demographic Research 29 (1), 1-32.
Van Hook, Jennifer, Julia Gelatt, and Ariel G. Ruiz Soto (2023). “A Turning Point for the Unauthorized Immigrant Population in the United States.” Migration Policy Institute.
Wamhoff, Steve (2024). “Who Pays Taxes in America 2024.” Institute on Taxation and Economic Policy.
Warren, Robert and John Robert Warren (2013). “Unauthorized Immigration to the United States: Annual Estimates and Components of Change, by State, 1990 to 2010.” International Migration Review 47 (2), 296-329.
Warren, Robert (2024). “After a Decade of Decline, the US Undocumented Population Increased by 650,000 in 2022.” Journal on Migration and Human Security.
Yang, Dean (2011). “Migrant Remittances.” Journal of Economic Perspectives, Vol. 25 (3), 129-152.
Endnotes
[1] Davis, Carl, et al. “Who Pays? A Distributional Analysis of the Tax Systems in All 50 States, 7th ed.,” Institute on Taxation and Economic Policy, January 2024. https://itep.org/whopays-7th-edition/.Wamhoff, Steve. “Who Pays Taxes in America in 2024.” Institute on Taxation and Economic Policy, April 2024. https://itep.org/who-pays-taxes-in-america-in-2024/.
[2] See methodology section for more information on the calculation of estimated tax payments by undocumented immigrants.
[3] See methodology section for more information about current personal income tax compliance.
[4] Clemens, Michael A. “The Economic and Fiscal Effects on the United States from Reducing Numbers of Refugees and Asylum Seekers,” Oxford Review of Economic Policy, Vol. 38 (3), 449-486.
[5] Wamhoff, Steve. “Who Pays Taxes in America in 2024.” Institute on Taxation and Economic Policy, April 2024. https://itep.org/who-pays-taxes-in-america-in-2024/.
[6] Goss, Stephen, et al. “Effects of Unauthorized Immigration on the Actuarial Status of Social Security Trust Funds,” Social Security Administration, April 2013. https://www.ssa.gov/oact/NOTES/pdf_notes/note151.pdf.
Ranker, Lynsie, et al. “Keeping Medicare Solvent: How Immigrants Subsidize Medicare’s Trust Fund for All U.S. Seniors,” New American Economy, April 2021. https://research.newamericaneconomy.org/wp-content/uploads/sites/2/2021/05/NAE_Medicare_Report.pdf.
[7] Broder, Tanya, and Gabrielle Lessard. “Overview of Immigrant Eligibility for Federal Programs,” National Immigration Law Center, October 2023. https://www.nilc.org/wp-content/uploads/2023/10/overview-immeligfedprograms-2023-10-01.pdf. [If you go to the landing page, you get the most current version, which is now May 2024: Overview of Immigrant Eligibility for Federal Programs – National Immigration Law Center (nilc.org)]
[8] Davis, Carl, et al. “Who Pays? A Distributional Analysis of the Tax Systems in All 50 States, 7th ed.”
[9] Guzman, Marco, and Emma Sifre. “Improving Refundable Tax Credits by Making them Immigrant-Inclusive,” Pittsburgh Tax Review, Vol. 21 (2), 205-223.
[10] Internal Revenue Service. “What You Need to Know about CTC, ACTC, and ODC,” March 14, 2024. https://www.eitc.irs.gov/other-refundable-credits-toolkit/what-you-need-to-know-about-ctc-and-actc/what-you-need-to-know.
[11] Davis, Aidan, and Neva Butkus. “Boosting Income, Improving Equity: State Earned Income Tax Credits in 2023,” Institute on Taxation and Economic Policy, September 12, 2023. https://itep.org/boosting-incomes-improving-equity-state-earned-income-tax-credits-in-2023/.
Davis, Aidan, and Neva Butkus. “States are Boosting Economic Security with Child Tax Credits in 2023,” Institute on Taxation and Economic Policy, September 12, 2023. https://itep.org/states-are-boosting-economic-security-with-child-tax-credits-in-2023/.
[12] Borjas, George. “The Earnings of Undocumented Immigrants,” National Bureau of Economic Research Working Paper 23236, March 2017. https://www.nber.org/system/files/working_papers/w23236/w23236.pdf.
[13] Census survey data tend to overestimate the number of naturalized citizens when compared to INS administrative data. This is true of most reported recent naturalizations and naturalizations from Central America (Passel et al. 1997). More recent research suggests this may be more limited to those whose country of origin is Mexico (Van Hook and Bachmeier 2013). For a broader discussion of this literature, see Brown et al. (2019).