Key Findings
- America’s tax system is just barely progressive, and not nearly as progressive as many suggest or as progressive as it could be. There is plenty of room for lawmakers to improve the progressivity of the tax code to combat economic, wealth, and racial inequality.
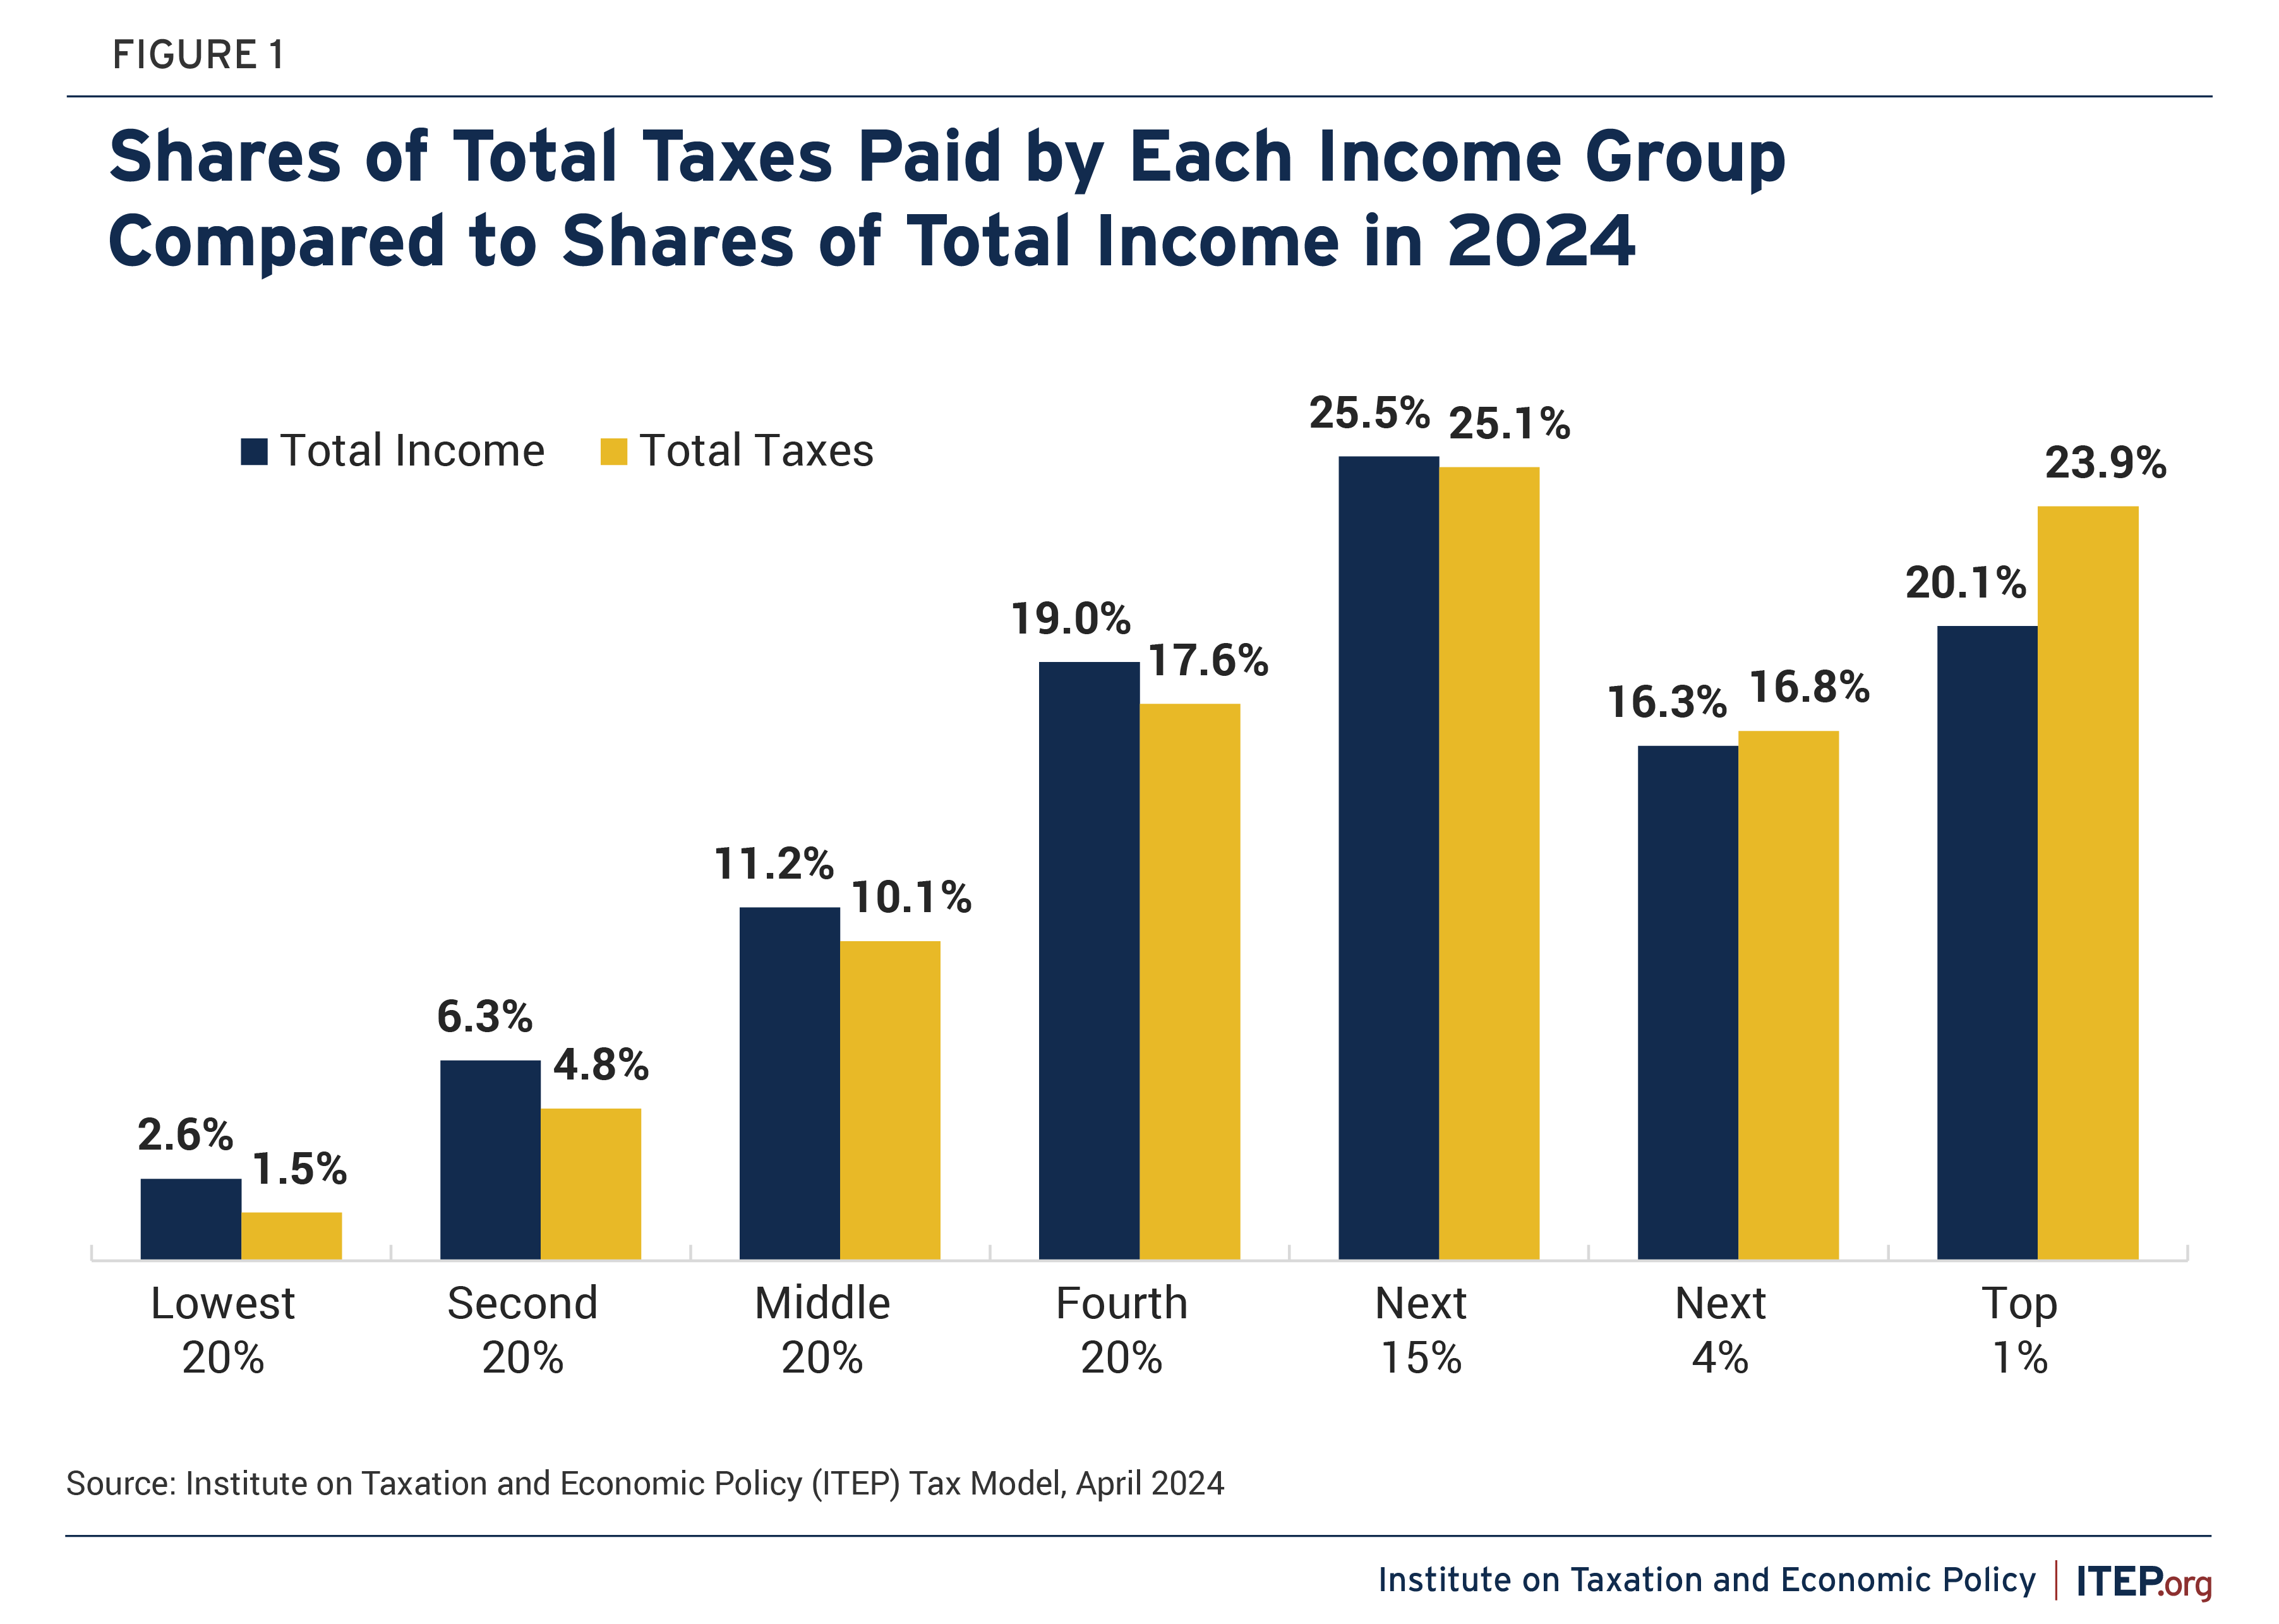
- The share of all taxes (including federal, state, and local taxes) paid by the rich only slightly exceeds the share of total income they receive. In 2024, the share of all taxes paid by the richest 1 percent of Americans (23.9 percent) will be slightly higher than the share of all income going to this group (20.1 percent).
- The share of all taxes paid by the poor is just slightly less than the share of income received by the poor. The poorest fifth of Americans will pay 1.5 percent of their income in taxes, a slightly lower share than their share of all income (2.6 percent).
- The tax system would appear even less progressive if this analysis included asset appreciation (unrealized capital gains), which mostly flows to the wealthy. Economists consider unrealized capital gains to be income, but the tax code does not.
ITEP generates these estimates using its tax model, which calculates different types of taxes using a dataset with a statistically valid sample of taxpayers from official government sources. ITEP’s model includes virtually all federal, state, and local taxes that are likely to be paid in 2024 in the United States.
These figures confirm that our tax system overall requires the richest 1 percent to pay, on average, more in taxes than others, relative to their income, but only slightly more. And many individuals within the richest 1 percent, especially the richest in the group, pay far less, thanks to certain special breaks and loopholes. Our tax system should require the richest Americans to pay much more in taxes than they do now, to support the public investments that make their fortunes possible. The best-off Americans acquired their position because their corporations use public roads to ship goods, their companies employ the workforce created by our public education system, their customers buy products derived from government-funded research, and their investments are possible because of the courts that define property rights and the public safety personnel who enforce those rights.
America’s federal tax system overall is relatively progressive, meaning it requires the rich to pay more relative to their income than others, while state and local taxes in most states are regressive, meaning they take a larger share of income from the poor than from the rich. The progressive aspects of the federal tax system offset the regressive aspects of the state and local tax system so that overall, taxes for each income group are roughly proportional to income.
The federal personal income tax is a progressive tax because it applies at higher marginal rates to higher levels of income and includes features such as the Earned Income Tax Credit (EITC), which benefits low-income working people, and the refundable portion of the Child Tax Credit (CTC), which is one of the few federal policies that directly addresses child poverty.
The federal corporate income tax is also progressive because it mostly affects corporate shareholders, who are disproportionately wealthy. The corporate income tax is paid directly by corporations, but the tax is ultimately mostly borne, albeit indirectly, by the owners of corporate stocks and bonds.
Another progressive federal tax is the federal estate tax. Less than 1 percent of Americans are sufficiently wealthy that their estate will be touched by the tax.[1]
A significant federal tax that is not particularly progressive is the payroll tax. The largest component of that, the Social Security tax, applies at a flat rate on earnings up to just $168,600.[2]
Of course, all these taxes have special breaks and loopholes that make them less progressive than they might otherwise be, even allowing some wealthy individuals and profitable corporations to avoid paying much of anything.[3] But taking these and other federal taxes together, the federal tax system is nonetheless progressive overall.
State and local taxes, on the other hand, are mostly regressive. Among the 50 states and the District of Columbia, 41 states tax high-income people less than everyone else.[4] This has an enormous impact because nearly everyone in the U.S. pays state and local taxes.
State and local sales taxes are a significant example of why so many states have regressive tax systems. Low-income families have little choice but to spend all their income to cover basic needs and middle-income families spend most of their money to maintain even a modest quality of life. Most of these purchases are subject to sales taxes. High-income families, however, can save and invest most of their income, avoiding sales taxes. As a result, lower-income families spend a much larger share of their income on sales taxes than high-income families.
Most Americans also pay property taxes, either directly as homeowners or indirectly as renters because landlords pass on a portion of the property tax as higher rents.
The estimates provided in this analysis take into account all the significant federal, state, and local taxes that Americans pay.[5]
Claims That America’s Tax System Is Overly Progressive Do Not Add Up
Some politicians and pundits claim America’s tax system is already too progressive, meaning it is overly burdensome for the rich, overly generous to the poor and middle class, or both. Often these claims focus on federal taxes and ignore state and local taxes.
For example, two years ago, Sen. Rick Scott released a proposal to raise taxes on low- and middle-income people, suggesting that many Americans lack “skin in the game” because they do not pay the federal personal income tax.[6] This probably was not a reference to wealthy people like Donald Trump who in some years avoided paying any federal personal income taxes.[7]
It seemed to refer instead to ordinary Americans who do not have enough income to owe any federal personal income tax. This includes people who worked their entire lives, paid federal income taxes and payroll taxes, and who now are retirees collecting Social Security, most of which is exempt from federal income taxes. It includes working childless people who earn less than the standard deduction (which is $29,200 this year for a married couple) but who pay federal payroll taxes, not to mention state and local taxes. This also includes working parents and very low-income parents of children receiving the refundable portion of the Child Tax Credit.
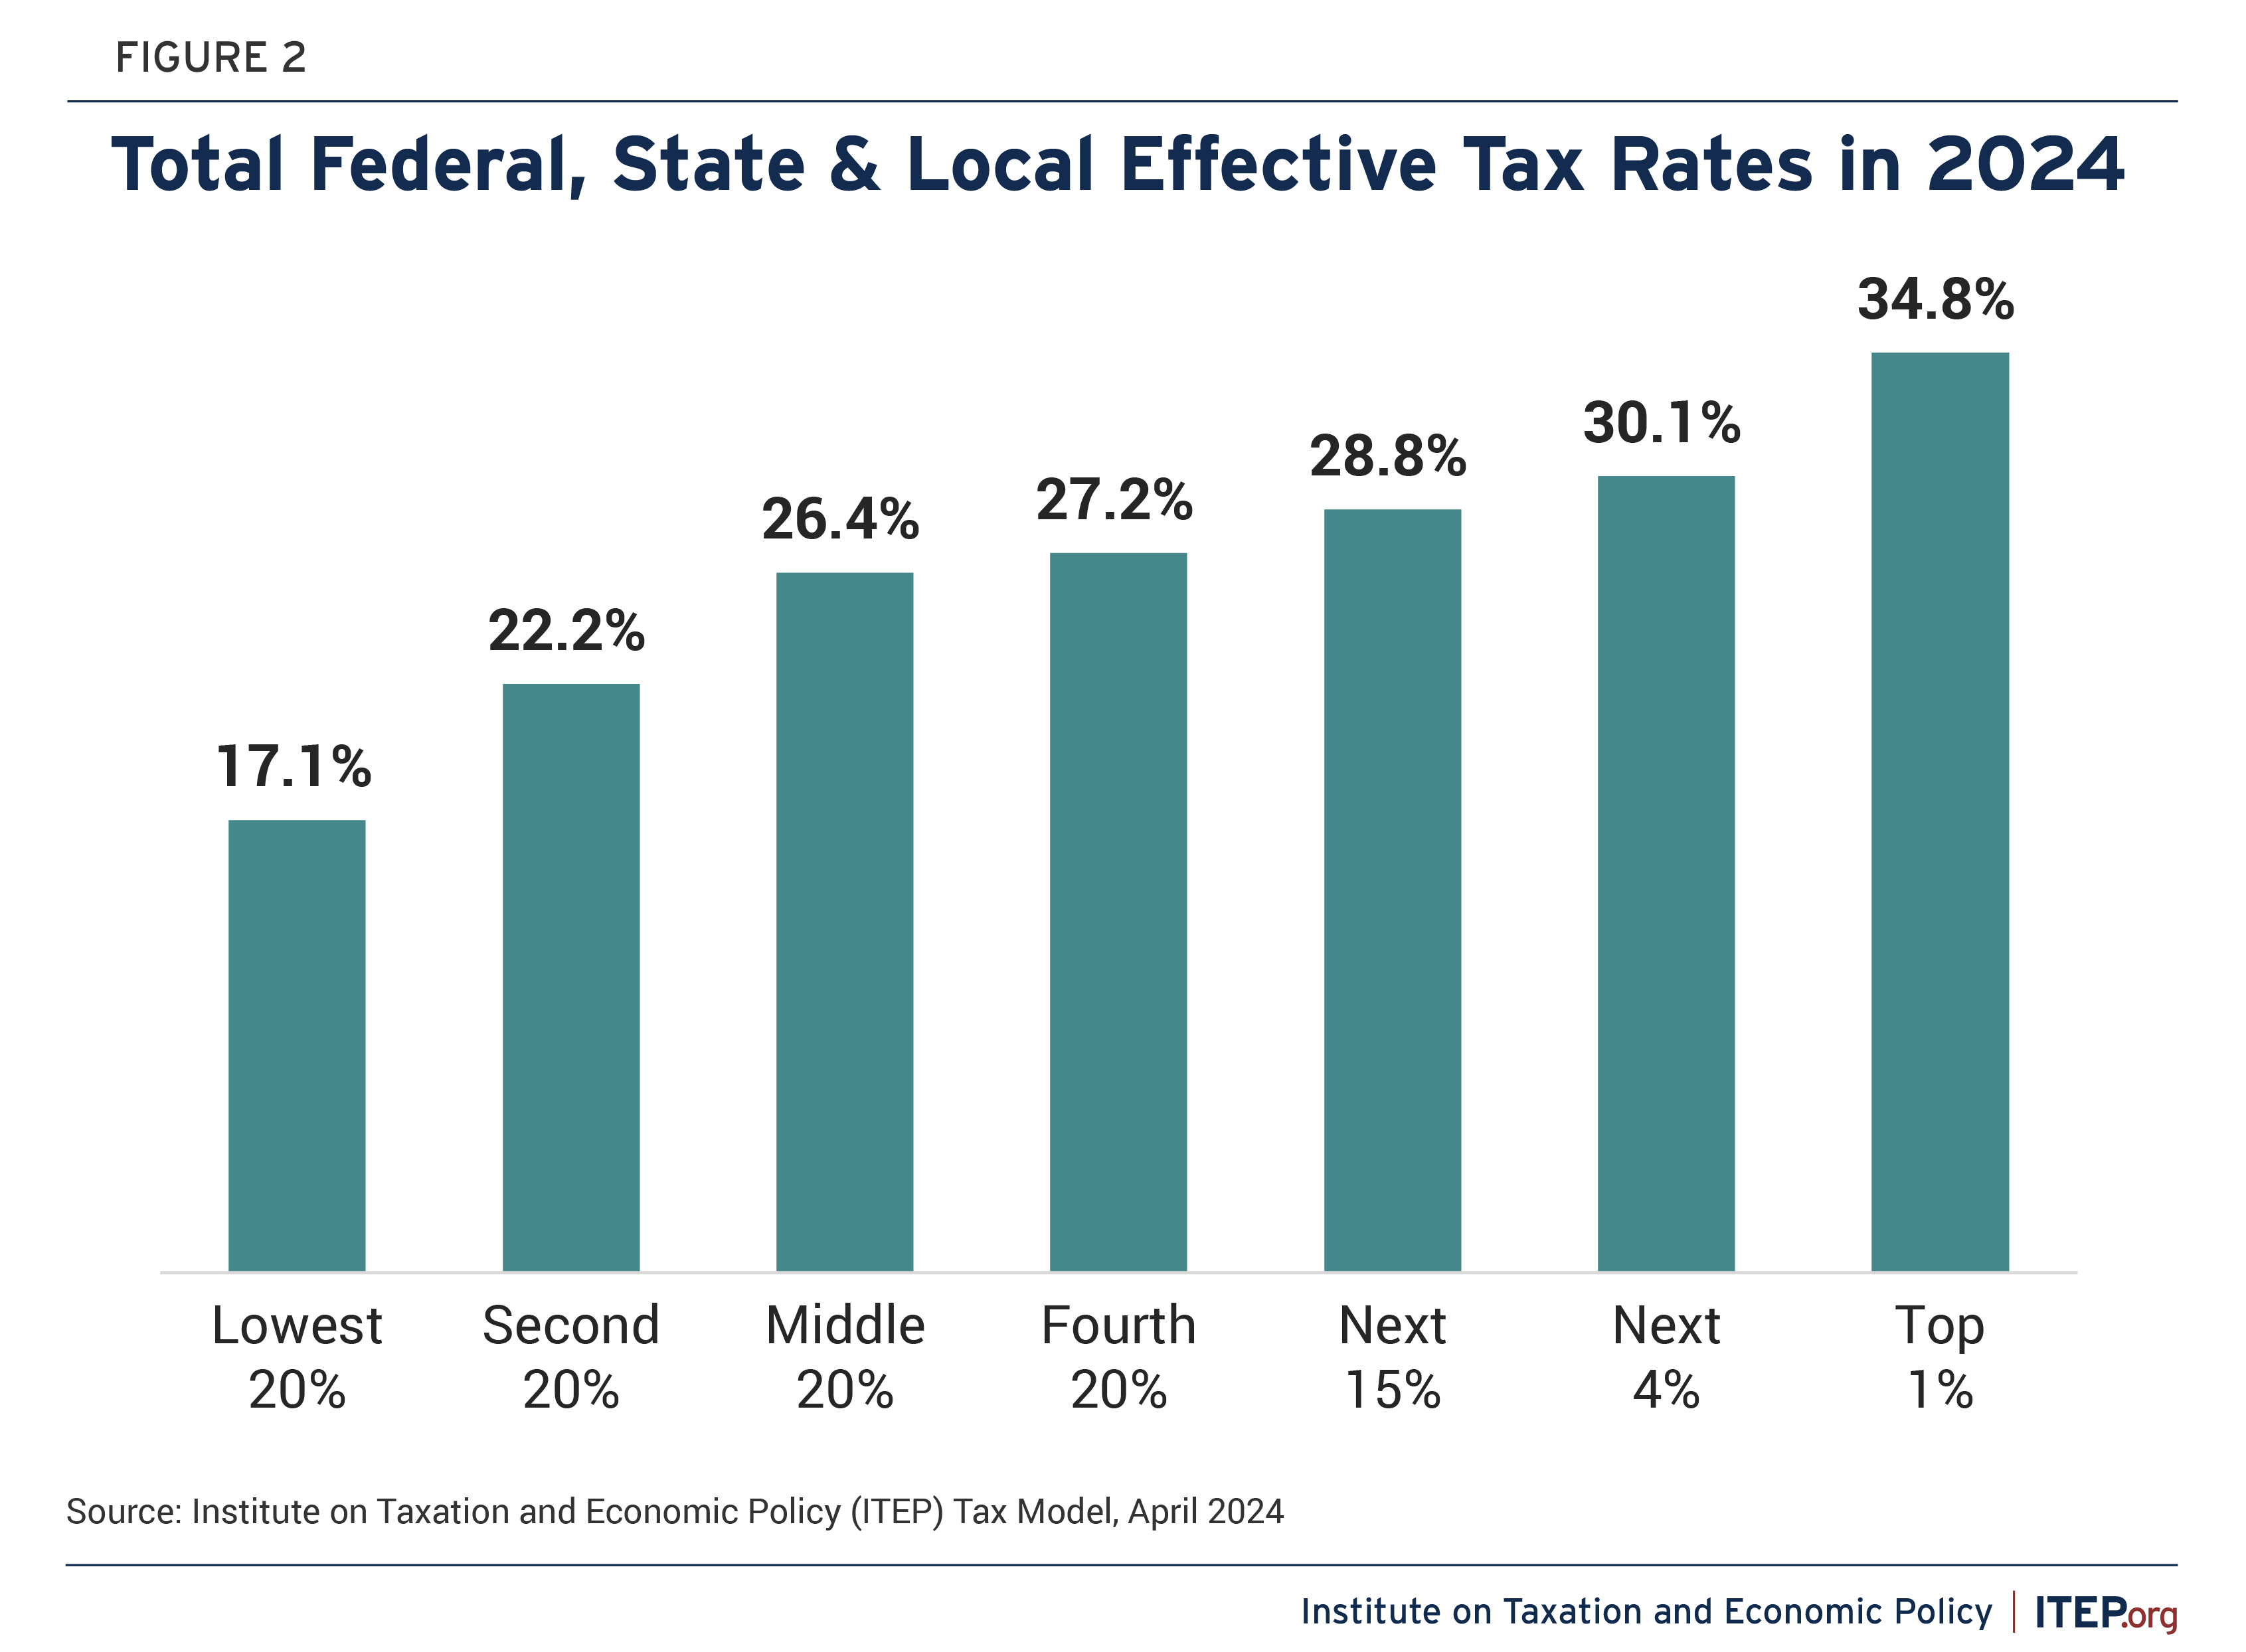
The truth is that America’s tax system overall is progressive, but not as progressive as lawmakers such as Sen. Scott claim. Those in the top 1 percent will pay a little over a third of their income in taxes this year on average, those in the middle will pay about 26 percent, while those among the poorest fifth of Americans will pay about 17 percent of their income in taxes on average.
Figure 3.
Incomes and Federal, State & Local Taxes in 2024
| Shares of total | Taxes as % of income | ||||||
| Income group |
Income range |
Average cash income |
Income | Taxes | Federal taxes |
State & local taxes |
Total taxes |
| Lowest 20% | Less than $27,100 | $15,400 | 2.6% | 1.5% | 3.6% | 13.5% | 17.1% |
| Second 20% | $27,100–$51,500 | $38,900 | 6.3% | 4.8% | 10.0% | 12.2% | 22.2% |
| Middle 20% | $51,500–$86,800 | $67,400 | 11.2% | 10.1% | 15.0% | 11.5% | 26.4% |
| Fourth 20% | $86,800–$147,300 | $115,200 | 19.0% | 17.6% | 16.1% | 11.1% | 27.2% |
| Next 15% | $147,300–$308,600 | $197,400 | 25.5% | 25.1% | 19.0% | 9.9% | 28.8% |
| Next 4% | $308,600–$771,100 | $454,400 | 16.3% | 16.8% | 21.5% | 8.6% | 30.1% |
| Top 1% | $771,100 and above | $2,502,100 | 20.1% | 23.9% | 25.5% | 9.2% | 34.8% |
| ALL | $118,100 | 100.0% | 100.0% | 19.0% | 10.3% | 29.2% | |
| Bottom 99% | Less than $771,100 | 80.8% | 76.0% | 17.1% | 10.4% | 27.5% | |
Notes:
a. Includes virtually all federal, state & local taxes (personal and corp. income, payroll, property, sales, excise, estate).
b. For calculations of income shares and taxes as a % of income, income includes employer-paid FICA taxes and corporate profits (net of taxable dividends and gains on corporate stock sales), neither of which is included in the average cash income figures.
Source: Institute on Taxation and Economic Policy (ITEP) Tax Model, April 2024
America’s Tax System Is Less Progressive Than It Appears
If anything, America’s tax system is less progressive than these figures would suggest. The income included in ITEP’s data is generally the income taxpayers are required to report to the IRS. This primarily includes funds that have changed hands – wages paid from an employer to an employee, profits paid from a corporation to a shareholder, profits received by investors when they sell assets, and the like. But there is another type of income that flows in vast amounts to the wealthy, which taxpayers are not required to report to the IRS. This income is unrealized capital gains, or the increase in value of assets that people have not yet sold.[8] If unrealized capital gains were included in ITEP’s data, this analysis would show that the tax system is even less progressive than illustrated here.
As described in an exposé from ProPublica, the wealthiest Americans have vast amounts of unrealized capital gains that are not subject to the personal income tax and therefore not included in these data.[9]
For example, Jeff Bezos’s net worth increased by $99 billion from 2014 through 2018 because the value of his stock climbed that much. But his income as defined by the tax code was just $4.2 billion. Economists consider Bezos’s $99 billion of asset appreciation (unrealized capital gains) to be income, but our current tax rules do not, so it goes untaxed.
The effective tax rates shown in Figure 2 are simply the total taxes paid divided by the total income received for each income group. If the analysis included unrealized capital gains income (which mostly flows to the rich) then the effective tax rate for the richest 1 percent would be much lower.
ProPublica provided calculations to demonstrate this point. Starting with the traditional definition of income used by ITEP in this analysis, they found that the 25 Americans with the highest net worth paid just 16 percent of their income in taxes during the period they examined, which included 2014 through 2018. But using a more realistic definition of income that includes unrealized capital gains, they found that the same 25 Americans paid just 3.4 percent of their income in taxes during that period. If unrealized capital gains were included in these estimates, ITEP, too, would calculate a much lower effective tax rate for the rich.[10]
America’s Tax System Can Be Better
Several tax laws enacted over the past 25 years have made our tax system less progressive than it would be otherwise.[11]
Most recently, the tax law enacted in 2017 under former President Donald Trump included permanent cuts in the federal corporate income tax and temporary cuts in other taxes. If Congress makes the temporary provisions permanent as Republicans propose, the poorest fifth of Americans would receive just 1 percent of the benefits while the richest fifth of Americans would receive nearly two-thirds.[12]
Donald Trump and his advisers have at various times suggested that they would, if returned to the White House, propose to further cut the federal corporate income tax rate, or cut taxes for other types of businesses that are likely to be owned primarily by the wealthy.[13]
These changes are in direct opposition to the policy preferences of most Americans. The public has supported higher taxes on the rich and on corporations for as long as pollsters have asked about the topic.[14]
Congress finally responded to the public’s preference for a more progressive tax system with the Inflation Reduction Act that President Biden signed into law in 2022. That law raised revenue from corporations and their shareholders by imposing a new minimum tax on corporations and taxing stock buybacks.
President Biden has proposed far more expansive tax reforms that would raise trillions in new revenue.[15] Some lawmakers even propose to apply the federal personal income tax to unrealized capital gains of the very wealthy, and a similar provision is included in the President’s budget plan.[16]
APPENDIX: How ITEP’s Analysis Compares to That of the Congressional Budget Office
The Congressional Budget Office (CBO) analyzes federal tax incidence, meaning the distribution of federal taxes across income groups. While CBO comes to similar conclusions about the federal tax system as ITEP, one can easily be confused by the differences between the two.
For example, CBO does not include in its analysis state and local taxes (which generally can only be found in ITEP’s Who Pays? reports as noted in the endnotes). Even ITEP’s estimated distribution of federal taxes differs somewhat from that of CBO.
Differences Affecting High-Income Groups
For example, CBO estimates that the effective federal tax rate (all federal taxes paid as a share of income) for the richest one percent was about 30 percent during the last three years for which data are available, 2018 through 2020.[17] There are several reasons why ITEP calculates a lower federal effective tax rate for the richest one percent, 25.5 percent, as shown in Figure 3.
Corporate Taxes and Profits
Corporations directly pay corporate income taxes, but all taxes are ultimately borne by people, which raises the thorny question of which people indirectly pay the corporate income tax. ITEP follows the approach of CBO in assuming that 75 percent of the corporate tax is ultimately paid by the owners of corporate stocks and corporate bonds (the owners of corporate capital), while the other 25 percent is ultimately paid by labor because higher corporate taxes can, in theory, affect U.S. wage levels by reducing the competitiveness of domestic production.[18] (This breakdown applies to the long-run effects of the corporate income tax, whereas the immediate impact of a change in the corporate income tax falls entirely on the owners of corporate capital.)
ITEP’s analysis accounts for the portion of the corporate tax that is paid by foreign investors, who own a large percentage of the total shares in American corporations. CBO makes no mention of any portion of the tax being paid by foreign investors.[19] Even if CBO did assume a portion is paid by foreign investors, it might assume that it is a small portion. Congress’s official revenue-estimator, the Joint Committee on Taxation (JCT), explained several years ago that it assigned 10.8 percent of the portion paid by the owners of capital to foreign investors because that is the portion of American corporate stocks that was foreign-owned at that time.[20]
Recent research suggests a much larger share of stock in corporations subject to the U.S. corporate income tax is owned by foreign investors, which in turn means that the portion of the corporate income tax ultimately paid by foreign investors is larger than JCT’s 10.8 percent. Steve Rosenthal and Livia Mucciolo of the Tax Policy Center recently concluded that the foreign-owned share of American corporate stocks is 42 percent.[21] ITEP therefore concludes that, of the 75 percent of the corporate tax paid by the owners of capital, 42 percent is paid by foreign investors and the remaining 58 percent is paid by American owners of corporate capital. Because the corporate tax mainly affects the rich, this can result in a noticeably smaller effective federal tax rate for the richest one percent.
Another difference between ITEP and CBO involves the income received by corporations. ITEP and CBO both assume that the corporate income tax is ultimately paid by individuals. In ITEP’s view, it is therefore logical to assume that all corporate income (meaning corporate profits) ultimately flows to individuals. Otherwise, our analysis would assume that individuals pay a tax without receiving or benefiting from the income being taxed.
CBO, however, only counts corporate profits as income to individuals when they are received as stock dividends or realized as capital gains on stock sales, or when they are used to pay corporate income taxes.[22] This means that the considerable profits that corporations do not pass on to shareholders through stock dividends or stock buybacks mostly disappear from the analysis. Patrick Driessen, an analyst formerly with JCT, has written that this approach provides an incomplete picture of income.[23] ITEP agrees.
ITEP estimates that the effective federal tax rate for the richest one percent is 25.5 percent, compared with CBO’s 30 percent. If we reduce the amount of the “capital” portion of the corporate tax flowing to foreign investors from 42 percent to the 10.8 percent that JCT (and possibly CBO) have used, and we remove the assumption that all corporate profits ultimately are received by individuals, our effective federal tax rate for the richest one percent rises to from 25.5 percent to 26.7 percent, closing some of the difference between ITEP and CBO.
Unreported Income
ITEP’s treatment of underreported or unreported income is another potential reason why the tax rates presented in this analysis differ slightly from other, similar studies. ITEP’s definition of income includes both reported income and unreported income, while CBO’s includes only reported income. CBO’s decision to exclude unreported income causes it to calculate higher effective tax rates than are found in this report (because effective tax rates are simply taxes paid divided by total income).
One notable difference between our analysis and the CBO analysis is that, because CBO only analyzes federal taxes, the bulk of the levies it examines are imposed on income of some sort (personal income, corporate income, or wages). Our analysis, however, is much broader in scope as it includes a wide array of state and local taxes, the bulk of which are levied on consumption and property. Including unreported income is especially important in the context of state and local tax analysis as the spending that gives rise to consumption and property tax liability is sometimes financed, in part, with unreported income. Ultimately, including income hidden from tax authorities in our broad measure of income strengthens our measurement of families’ ability to pay.
The IRS has documented that hundreds of billions of federal taxes that are owed each year go unpaid because Americans underreport their income by 17 to 18 percent.[24] The rate of underreporting varies greatly by source of income. For example, the most recent IRS studies of the “tax gap” find that 1 percent of wages, salaries and tips are not reported to the IRS, whereas 12 percent of business income, 18 percent of capital gains and 53 percent of rents and royalties are not reported. In other words, the types of income that are more likely to flow to well-off households are more likely to be underreported to the IRS because there is less third-party information reporting. This is consistent with other research by Andrew Johns and Joel Slemrod, among others, finding that the rate of income underreporting overall generally rises with income.[25] The ITEP model’s income definition reflects rates of income underreporting consistent with this research.
As stated earlier, CBO found that the effective federal tax rate for the richest one percent is 30 percent, whereas ITEP finds their effective rate to be 25.5 percent, or 26.7 percent if we adopt CBO’s approach to corporate taxes and corporate profits. If we adopt CBO’s approach to corporate taxes and corporate profits and CBO’s approach of defining income to include only reported income, our effective federal tax rate for the richest one percent would be 31.2 percent. These differences in approaches between ITEP and CBO therefore explain the different estimates of effective federal tax rates for the richest one percent.
Differences Affecting Low- and Middle-Income Groups
Some differences mainly affect estimates of low- and middle-income groups. For example, the definition of income used by CBO includes the amount employers pay for employees’ health insurance coverage, which is not included in ITEP’s definition of income. Because effective federal tax rates are calculated by dividing federal taxes paid by income received, federal effective tax rates in CBO’s analyses can appear lower because they include this income that ITEP does not include.
Another difference is that CBO creates its income groups by “ranking households by their size-adjusted income” whereas ITEP ranks tax units (which are slightly different from households) by income without making any adjustment for size of the tax unit. For example, this ITEP analysis places a tax unit (which consists of someone who files taxes or could file, who is not a dependent of others, and the filer’s dependents) in the poorest 20 percent if its income is less than $27,100 in 2024. This is true regardless of the size of the tax unit. It could consist of a single adult, or it could consist of a married couple with four children.
CBO, on the other hand, “calculates adjusted household income by dividing household income by the square root of the number of people in the household.”[26] This may mean, for example, that some working single adults would be counted among the poorest 20 percent in ITEP’s analysis but counted among the second 20 percent in CBO’s analysis.[27]
While CBO’s approach is helpful in certain ways, ITEP takes the view that tables and graphs illustrating the distribution of taxes are most helpful when the reader can identify what income group they fall in. For example, someone whose cash income is less than $27,100 in 2024 can be sure they are part of the bottom 20 percent in ITEP’s analysis regardless of whether they are married and regardless of how many children they have. Looking at CBO’s analysis, they would not be certain what income group they fall into because they may not know exactly how CBO’s adjustment for household size works. If they receive employer-provided health insurance, they may not know the dollar value of that benefit, which CBO includes in its definition of income.
Endnotes
[1] Steve Wamhoff, “The Estate Tax is Irrelevant to More Than 99 Percent of Americans,” December 7, 2023, Institute on Taxation and Economic Policy. https://itep.org/federal-estate-tax-historic-lows-2023/
[2] Senator Sheldon Whitehouse introduced a bill earlier this year that would transform the taxes that finance Social Security and Medicare into progressive taxes. Steve Wamhoff and Joe Hughes, “’FairShare Act‘ Would Strength Medicare and Social Security,“ July 11, 2023, Institute on Taxation and Economic Policy. https://itep.org/fair-share-act-would-strengthen-medicare-and-social-security-taxes/
[3] Matthew Gardner and Steve Wamhoff, “Corporate Tax Avoidance in the First Five Years of the Trump Tax Law,” February 29, 2024, Institute on Taxation and Economic Policy. https://itep.org/corporate-tax-avoidance-trump-tax-law/
[4] ITEP’s comprehensive analysis of state and local tax systems finds that the vast majority of them are regressive. See “Who Pays? 7th Edition,” Institute on Taxation and Economic Policy, January 8, 2024. https://itep.org/whopays-7th-edition/
[5] The federal taxes included in this analysis are the federal personal income tax, FICA and SECA taxes that go towards Social Security and Medicare, the additional Medicare tax paid by high-earners, the Net Investment Income Tax, and unemployment insurance taxes, which are all estimated using the model. It also includes federal excise taxes and customs duties and estate and gift taxes which are estimated off-model using the revenue estimates provided by the Congressional Budget Office. The federal corporate income tax is calculated starting with the projected revenue raised by the tax according to the Congressional Budget Office and then the model is used to distribute a portion of the tax to owners of capital and another portion to labor, following the approach used by Congress’s official revenue-estimator, the Joint Committee on Taxation. (See endnote 18.)
Effective state and local tax rates are taken from Figure D on page 92 of “Who Pays?” (noted above), which include the SALT that Americans pay to the state they reside as well as to other states. The effective rates used in this study are slightly different because in order to understand the tax system as a whole, this analysis uses a broader definition of income that includes employer-paid payroll taxes and undistributed corporate profits, as explained in the appendix to this study.
[6] Steve Wamhoff, “State-by-State Estimates of Sen. Rick Scott’s “Skin in the Game” Proposal,” March 7, 2022, Institute on Taxation and Economic Policy. https://itep.org/state-by-state-estimates-of-sen-rick-scotts-skin-in-the-game-proposal/
[7]Russ Buettner, Susanne Craig and Mike McIntire, “Long-Concealed Records Show Trump’s Chronic Losses and Years of Tax Avoidance,” September 27, 2020, New York Times. https://www.nytimes.com/interactive/2020/09/27/us/donald-trump-taxes.html?smid=tw-nytimes&smtyp=cur
[8] Jesse Eisinger, Jeff Ernsthausen and Paul Kiel, “The Secret IRS Files: Trove of Never-Before-Seen Records Reveal How the Wealthiest Avoid Income Tax,” June 8, 2021, ProPublica. https://www.propublica.org/article/the-secret-irs-files-trove-of-never-before-seen-records-reveal-how-the-wealthiest-avoid-income-tax
[9] Jesse Eisinger, Jeff Ernsthausen and Paul Kiel, “The Secret IRS Files: Trove of Never-Before-Seen Records Reveal How the Wealthiest Avoid Income Tax,” June 8, 2021, ProPublica. https://www.propublica.org/article/the-secret-irs-files-trove-of-never-before-seen-records-reveal-how-the-wealthiest-avoid-income-tax
[10] Other approaches could also lead to lower estimated effective tax rates for the richest Americans. For example, research by Emmanuel Saez and Gabriel Zucman included estimated unrealized capital gains as income and also split the richest one percent into much smaller groups. They found that the very richest 400 taxpayers in the United States pay a lower effective tax rate than other groups. See Steve Wamhoff, “Emmanuel Saez and Gabriel Zucman’s New Book Reminds Us that Tax Injustice Is a Choice,” Institute on Taxation and Economic Policy, October 15, 2019. https://itep.org/emmanuel-saez-and-gabriel-zucmans-new-book-reminds-us-that-tax-injustice-is-a-choice/
[11] Steve Wamhoff and Matthew Gardner, “Federal Tax Cuts in the Bush, Obama, and Trump Years,“ July 11, 2018, Institute on Taxation and Economic Policy. https://itep.org/federal-tax-cuts-in-the-bush-obama-and-trump-years/
[12] Steve Wamhoff, Joe Hughes, Matthew Gardner, “Extending Temporary Provisions of the 2017 Trump Tax Law: National and State-by-State Estimates,” May 4, 2023, Institute on Taxation and Economic Policy. https://itep.org/extending-temporary-provisions-of-the-2017-trump-tax-law-national-and-state-by-state-estimates/
[13] Jeff Stein, Behind Closed Doors, “Trump Eyes Second Round of Corporate Tax Cuts,” January 12, 2024, Washington Post. https://www.washingtonpost.com/business/2024/01/12/trump-tax-cuts-2024/
[14] Gallup, ”In Depth: Topics A to Z: Taxes“ https://news.gallup.com/poll/1714/taxes.aspx
[15] Steve Wamhoff, “Revenue-Raising Proposals in President Biden’s Fiscal Year 2025 Budget Plan,” March 12, 2024, Institute on Taxation and Economic Policy. https://itep.org/revenue-raising-proposals-biden-fiscal-year-2025-budget/
[16] Steve Wamhoff, “Everything You Need to Know About Proposals to Better Tax Billionaires,” December 21, 2023, Institute on Taxation and Economic Policy. https://itep.org/everything-you-need-to-know-about-billionaire-tax-proposals/
[17] CBO estimates that the effective federal tax rate for the richest one percent was 30.3 percent, 29.9 percent, and 30.0 percent in 2018, 2019 and 2020, respectively. Congressional Budget Office, “The Distribution of Household Income in 2020,” November 14, 2023. https://www.cbo.gov/publication/59509
[18] Joint Committee on Taxation, ”Modeling the Distribution of Taxes on Business Income,” October 16, 2013, JCX-14-13. https://www.jct.gov/publications/2013/jcx-14-13/
[19] Congressional Budget Office, “The Distribution of Household Income in 2020,” November 14, 2023. https://www.cbo.gov/publication/59509. CBO has in the past provided more detailed explanations of how it distributes corporate taxes, which also do not mention foreign investors. Congressional Budget Office, “Projected Changes in the Distribution of Household Income,” 2016 to 2021, December 19, 2019, Box 2: CBO’s Allocation of Corporate Taxes. https://www.cbo.gov/publication/55941
[20] Joint Committee on Taxation, ”Modeling the Distribution of Taxes on Business Income,” October 16, 2013, JCX-14-13, pages 13-14. https://www.jct.gov/publications/2013/jcx-14-13/
[21] Steven Rosenthal and Livia Mucciolo, “Who’s Left to Tax? Grappling With a Dwindling Shareholder Tax Base,” April 1, 2024, Tax Notes. https://www.taxnotes.com/tax-notes-federal/corporate-taxation/whos-left-tax-grappling-dwindling-shareholder-tax-base/2024/04/01/7j9cr
[22] Congressional Budget Office, “The Distribution of Household Income in 2020,” November 14, 2023, Appendix D. https://www.cbo.gov/publication/59509
[23] Patrick Driessen, Vanishing Corporate Income and Government Spending in Distribution Models, revised November 19, 2014. https://papers.ssrn.com/sol3/papers.cfm?abstract_id=2506899
[24] In 2019, the IRS estimated that individual income overall had been underreported by 18 percent from 2011 through 2013. Barry W. Johnson and Peter J. Rose, Federal Tax Compliance Research: Tax Gap Estimates for Tax Years 2011–2013, September 26, 2019, Internal Revenue Service. https://www.irs.gov/pub/irs-prior/p1415–2019.pdf. In 2022, the IRS estimated that it had been underreported by 17 percent from 2014 through 2016. Melanie R. Krause, Barry W. Johnson, Peter J. Rose, and Mary-Helen Risler, “Federal Tax Compliance Research: Tax Gap Estimates for Tax Years 2014-2016,” August 2022, Internal Revenue Service. https://www.irs.gov/pub/irs-pdf/p1415.pdf. The IRS has not updated its estimate of income underreporting since then, although it has used its existing estimates to calculate updated tax gap totals. Melanie R. Krause, Barry W. Johnson, Peter J. Rose and Dan Rosenbaum, “Federal Tax Compliance Research: Tax Gap Estimates for Tax Years 2020 and 2021.” October 2023, Internal Revenue Service. https://www.irs.gov/pub/irs-pdf/p5869.pdf
[25] Johns, Andrew and Joel Slemrod (2010). “The Distribution of Income Tax Noncompliance.” National Tax Journal 63 (3), 397-418. https://webuser.bus.umich.edu/jslemrod/Article%2001-Slemrod.pdf
[26] Congressional Budget Office, “The Distribution of Household Income in 2020,” November 14, 2023. https://www.cbo.gov/publication/59509
[27] In fact, an earlier CBO report, published in 1998, found the type of family size adjustment used in distributional tax analyses had a significant impact on the results for the poorest 20 percent. This happened, the report explained, because the EITC was particularly beneficial to families with children, meaning the placement of these families in the income distribution noticeably affects the results. Roberton Williams, David Weiner, Frank Sammartino, ”Equivalence Scales, the Income Distribution, and Federal Taxes,” October 1998, Congressional Budget Office. https://www.cbo.gov/sites/default/files/105th-congress-1997-1998/workingpaper/19992-entire_0.pdf