Anti-tax activists’ convoluted claims that the rich pay too much in taxes broke new ground with an op-ed published last week in the Wall Street Journal. Penned by former Texas Sen. Phil Gramm and John Early, a former official of the Bureau of Labor Statistics, the piece is particularly misleading.
They present what they claim is the average effective tax rate, which is taxes paid divided by income, for Americans in different income groups. Their bar graph seems to show that the richest households are paying effective rates that are far higher than those paid by everyone else.
This so-called evidence in support of their argument against raising taxes on the rich fails to correctly calculate effective tax rates.
Gramm and Early define the effective tax rate as “taxes actually paid, as a percentage of income earned and received in transfer payments.” You might have to read that twice to notice what’s missing. Unearned income like capital gains, stock dividends and interest, which mostly goes to the rich, is not included. Of course, if you leave out a lot of income that goes to the rich, that makes their effective tax rate (their taxes divided by their income) look bigger in a way that serves no purpose but to mislead.
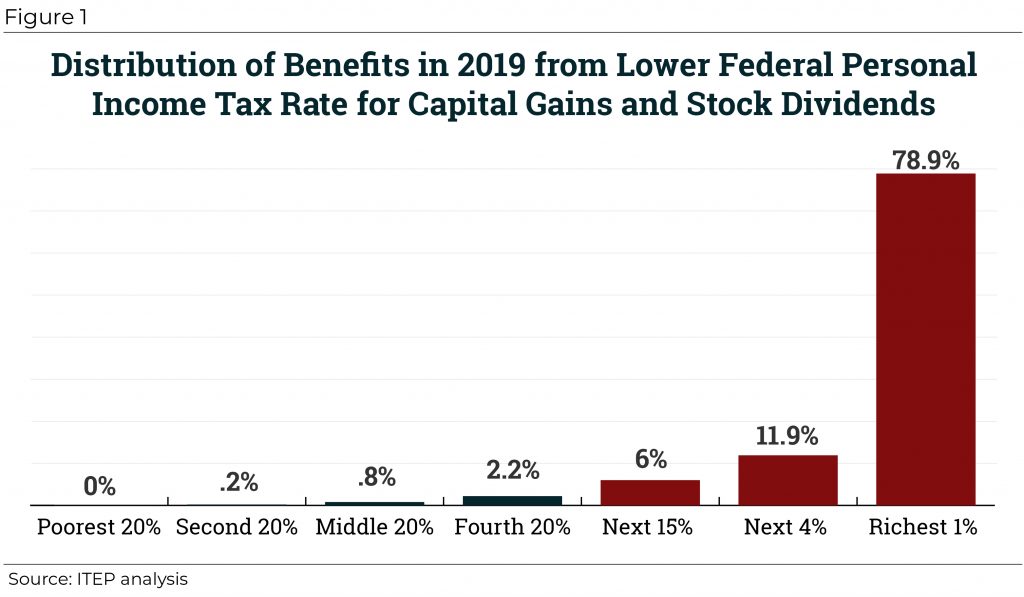
Let’s look at some major types of investment income, including net capital gains, stock dividends, and interest (both taxable and non-taxable). The bar graph below is generated with data from the ITEP tax model, which is partly based on IRS data, and focuses on 2017, the same year Gramm and Early are talking about. It shows that for most Americans, capital gains, dividends and interest account for a very small fraction of their adjusted gross income (AGI). But for the richest 1 percent, these types of income account for more than a third of their AGI.
This is the type of income that Gramm and Early decided to exclude from their bogus analysis. Take a moment to consider how bizarre and dishonest this is. They are leaving out income that mostly goes the rich, as illustrated in the graph below, from their argument that taxes paid by the rich are high as a percentage of their income.
And capital gains, dividends and interest are not the only types of unearned income. Other types include royalties and profits from different types of pass-through businesses, which also disproportionately flow to the rich, and which Gramm and Early also decided to exclude.
So, what do effective tax rates really look like across different income groups? ITEP’s most recent estimates, which are for 2019, are illustrated below. The average effective tax rates do go up a bit as you move up the income ladder, but not by nearly as much as Gramm and Early would have you believe. And the way our tax system treats low-income families is different from the story Gramm and Early tell. We find that the poorest 20 percent of households pay a total effective tax rate of about 20 percent and the richest 1 percent of households pay a total effective tax rate of about 34 percent, on average.
ITEP’s analyses have not yet split the richest 1 percent into smaller groups like the richest 0.1 percent or the richest 400 taxpayers, as have University of California Berkley economists Emmanuel Saez and Gabriel Zucman. They found that the richest 400 pay a lower effective rate than the average American, which is believable given that most capital gains and stock dividends that flow to this group are taxed at lower rates than other types of income, among other reasons.
You can read our report to learn about how we define income and how we calculate the total federal, state and local taxes paid by each income group.
We include everything most people think of as income, which for most of us is mainly wages and salaries. It also includes Social Security payments and government benefits that take the form of cash. We also include the unearned income that Gramm and Early leave out, including corporate profits whether they are paid as dividends or retained by the company. (The corporate tax is ultimately paid by people, so it’s logical to assume that all corporate profits ultimately go to people.)
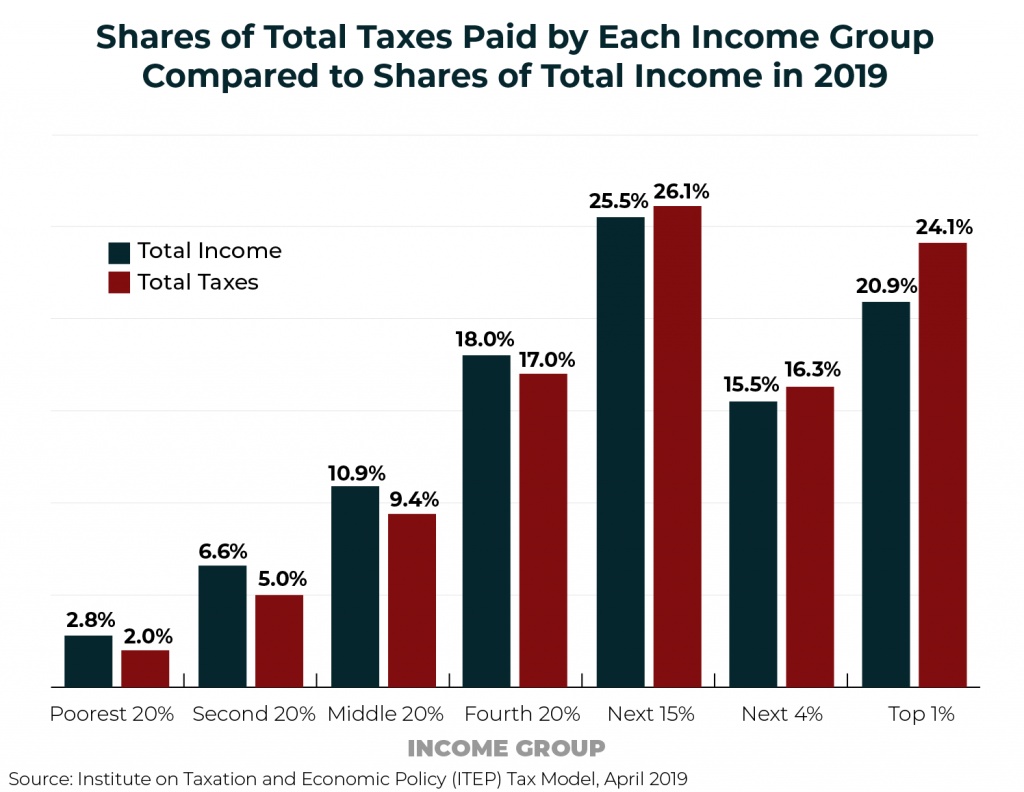
Here’s another way of looking at our findings. The share of total taxes paid by the richest 1 percent is just a little higher than the share of total income received by that group, 24 percent vs 21 percent, as illustrated in the graph below. From this perspective, the tax system is progressive, but just barely so.
The absurdities of the Gramm and Early op-ed continue as they move on from their cherry-picked data. They note that Bill and Melinda Gates have “given $45 billion to charity” and argue that “it isn’t clear that the public interest would be served by taxing Mr. Gates more and leaving less for him to donate to private charities.”
This is interesting because Gates himself has said, “If Melinda and I signed over our foundation’s entire endowment to the state of California, it wouldn’t be enough to fund their public schools for even one year.” Gates has also noted that tax rates had no effect on his incentive to create his fortune. “In the 1970s, when Paul Allen and I were starting Microsoft, marginal tax rates were almost twice the top rate today. It didn’t hurt our incentive to build a great company.”
Gramm and Early’s argument boils down to claiming the rich are already paying far more than everyone else, and anyway we would not want to tax the rich more because that would end all the wonderful things they do for society. It turns out that neither of those claims is true.