Recent Work
2178 items
Congress Could — But Won’t — Pass a Tax Package That Pays for Itself
January 17, 2025 • By Joe Hughes

If Republican lawmakers were serious about deficit-neutral tax reform, they would focus on increasing taxes for the ultra-wealthy and large corporations. The absence of such proposals in their plan reveals their true priority: delivering enormous tax cuts to the wealthiest Americans while average working families receive crumbs.
State Rundown 1/15: Tax Debates Heat Up Despite Winter Weather
January 15, 2025 • By ITEP Staff
While frigid temperatures expected across a large swath of the country, major tax proposals are heating up in the states. Governors are giving their State of the State addresses and state lawmakers have begun to convene for 2025. New York Gov. Kathy Hochul announced plans to expand the state’s Child Tax Credit earlier this year and has since announced nearly $1 billion in income tax cuts. Maryland Gov. Wes Moore unveiled a new tax proposal aimed at helping close the state’s looming revenue shortfall. The plan would increase taxes on the wealthy and cut taxes for many low- and middle-income…
Policymakers Unwisely Propose Cutting Property Taxes in Favor of Sales Taxes
January 14, 2025 • By Rita Jefferson

Lawmakers across the country are taking aim at property taxes with a new strategy: raising sales taxes instead. Doing so would create a regressive tax shift that puts unfair burdens on renters and reduces the strength of local government revenues.
It’s a new year, and state legislatures across the country are resolved to write new tax policy. Tax debates are heating up nearly everywhere in the early days of 2025, but states’ fiscal situations vary dramatically. New York is considering expanding the state’s Child Tax Credit following Gov. Hochul’s proposed expansion. On the other side […]
Trump’s Plan to Extend His 2017 Tax Provisions: Updated National and State-by-State Estimates
January 8, 2025 • By Steve Wamhoff
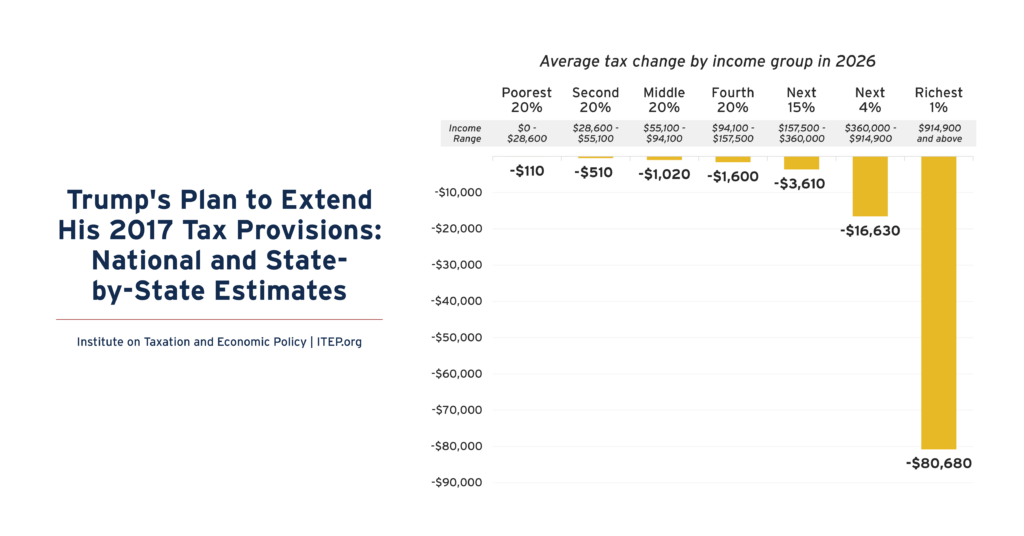
Trump’s plan to make most of the temporary provisions of his 2017 tax law permanent would disproportionately benefit the richest Americans. This includes all major provisions except the $10,000 cap on deductions for state and local taxes (SALT) paid.
Undocumented Immigrants Pay More Than Their Fair Share of Taxes
January 6, 2025 • By ITEP Staff

Undocumented immigrants help fund teacher salaries, road and bridge repairs and other local quality-of-life improvements. They also pay into vital programs that make up our social safety net (including Social Security, Medicare and unemployment insurance) even though they will likely never see any benefits from these programs — because, in most circumstances, they are legally prohibited from accessing them.
While most states have a graduated rate income tax, some state lawmakers have recently become enamored with the idea of moving toward flat rate taxes instead. What’s the difference? And are states well served by the transition? In short: A flat tax is one where each taxpayer pays the same percentage of their income whereas […]
The anti-tax playbook has been on full display in recent weeks as state policymakers run their offenses against public services and shared priorities. As the playbook dictates, if you have a little breathing room in your budget, propose cuts to the one major tax (personal income tax) that tends to ask more of those who […]

As we close out 2024, we want to lift up the tax charts we published this year that received the most engagement from readers. Covering federal, state, and local tax work, here are our top charts of 2024.
As Congress negotiates a bill for federal funding during the lame-duck session, lawmakers would be wise to remember that stripping funds from the IRS costs more than it saves. On the table in the appropriations bill is a $20 billion recission of funds to the nation’s tax administration. While this may look like a spending cut, it will increase deficits by $46 billion due to a drop in the agency’s capacity to enforce taxes on wealthy individuals owed under existing federal law.
How Local Governments Raise Revenue — and What it Means for Tax Equity
December 5, 2024 • By Galen Hendricks, Rita Jefferson
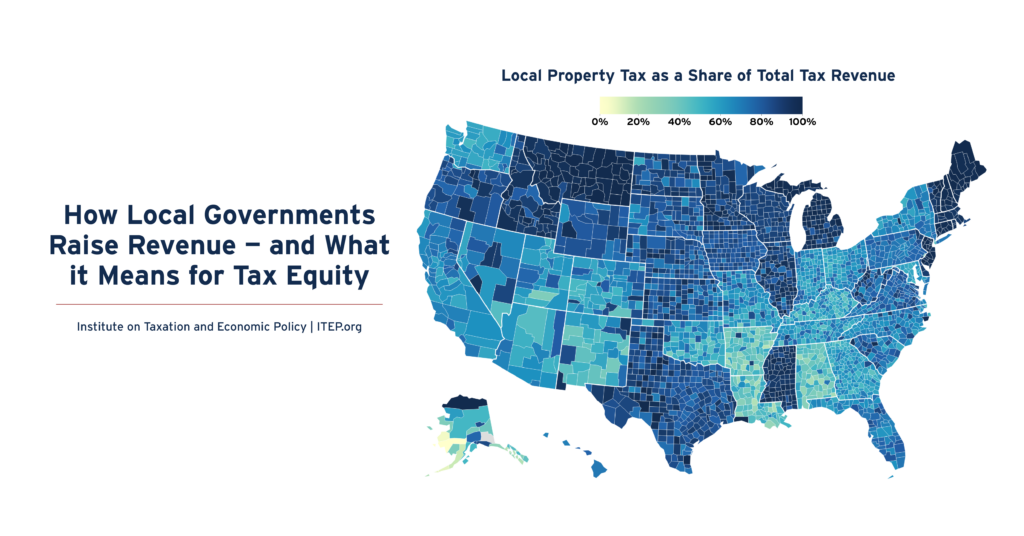
Local taxes are key to thriving communities. One in seven tax dollars in the U.S.—about $886 billion annually—is levied by local governments in support of education, infrastructure, public health, and other priorities. Three fourths of this funding comes from property taxes, 18 percent comes from sales and excise taxes, and six percent comes from income taxes.
State Rundown 12/3: Some States Cast Away Fiscal Responsibility as They Plan for 2025
December 3, 2024 • By ITEP Staff
The 2025 legislative season will be here before we know it, and state lawmakers have begun unveiling their priorities and proposals. Unfortunately, despite stagnating revenue growth, many lawmakers continue to push for deep, regressive tax cuts - often before the full impact of previous tax cuts is felt.

Louisiana Gov. Jeff Landry called the legislature back to the capitol the day after the national election to take up his plan to overhaul the state’s tax system during a 20-day special session. Our analysis shows the tax overhaul would worsen the inequity already rampant in Louisiana’s tax system while potentially shortchanging essential services for families across the state.
Average Louisianans Will Pay for Gov. Landry’s Tax Break for the Rich
November 26, 2024 • By Neva Butkus
Tax cuts for the wealthy and corporations will not make Louisiana more competitive. Rather, they will blow a hole in the state budget while asking low- and middle-income working families to make up the difference. Gov. Landry and the Louisiana legislature would make much better use of their time looking for ways to make Louisiana’s tax structure fairer and more capable of adequately funding important priorities.
State Rundown 11/20: Some Budgets and Tax Proposals Fail to Defy Gravity, Fall Short
November 20, 2024 • By ITEP Staff
This week, there are high-profile budget and tax debates at both the state and local levels. The Louisiana legislature continues to debate Gov. Jeff Landry’s deeply regressive tax package in a special session focused on replacing corporate and personal income tax revenue with additional sales taxes, but some efforts to find offsets for the cuts […]

Institute on Taxation
and Economic Policy
ITEP is a non-profit, non-partisan tax policy organization. We conduct rigorous analyses of tax and economic proposals and provide data-driven recommendations to shape equitable and sustainable tax systems.
Subscribe to ITEP Emails
Tax research and policy news in your inbox.
Promote Fair Tax Policy
Your gift to ITEP promotes tax justice. With your help, we do research that supports taxing millionaires and billionaires, taxing big corporations and raising revenue for the things our people, our communities and our planet need.
Together, we can create a country with more economic justice, more racial justice, more climate justice… and more tax justice.