Executive Summary
Historical and current injustices, both in public policy and in broader society, have resulted in vast disparities in income and wealth across race and ethnicity. Employment discrimination has denied good job opportunities to people of color. An uneven system of public education funding advantages wealthier white people and produces unequal educational outcomes. Racist policies such as redlining and discrimination in lending have denied countless Black families the opportunity to become homeowners or business owners, creating vast differences in intergenerational wealth. The lasting effects of these inequities compound over time.
Fully addressing these disparities will require a concerted effort across policy areas at all levels of government. This report focuses on one of many areas where state governments can advance racial equity: personal income tax reform. Specifically, this report recommends reforming the tax treatment of investment, business, and retirement income as well as homeownership and various tax credits for families.
Tax revenues make possible investments in education, health, housing, and other areas essential to broadly shared prosperity. But raising adequate personal income tax revenue to meet these priorities is a racial justice issue that goes beyond dollars raised. Robust, progressive taxes on income can directly counteract racial income inequality and indirectly reduce racial wealth inequality as well. With that in mind, this report outlines 10 options that can advance racial equity through better designed income tax laws.
The starting point of a racially equitable personal income tax code is a system of graduated tax rates that asks more of high-income families. Centuries of policy advantage and privilege have led to a significant overconcentration of white families among the nation’s top earners. Taxing top incomes is among the most direct ways of lessening income inequality along both racial and socioeconomic lines, while also raising substantial revenue with which to fund public investments that combat inequality.
But ensuring racial equity in state income tax laws requires looking beyond tax rates and paying close attention to the tax base: that is, the types of income being taxed, and the types of tax preferences being offered.
Given the severity of the racial wealth gap, equitable taxation of investment income, meaning income generated from wealth holdings, is at the heart of racial equity in state income tax law. The same is true of taxes on business income generated by partnerships and other pass-through businesses, as this form of income overwhelmingly flows to white families who are more likely to have access to the start-up capital needed to launch a successful business.
Tax subsidies for retirees and homeowners undermine the potential of state personal income taxes to advance racial equity and should be subject to scrutiny. Discrimination in the labor and housing markets, among other areas, has created severe racial disparities in income and homeownership rates that are exacerbated when states provide income or property tax subsidies to retirees because white people are more likely to have higher retirement income and homeownership rates.
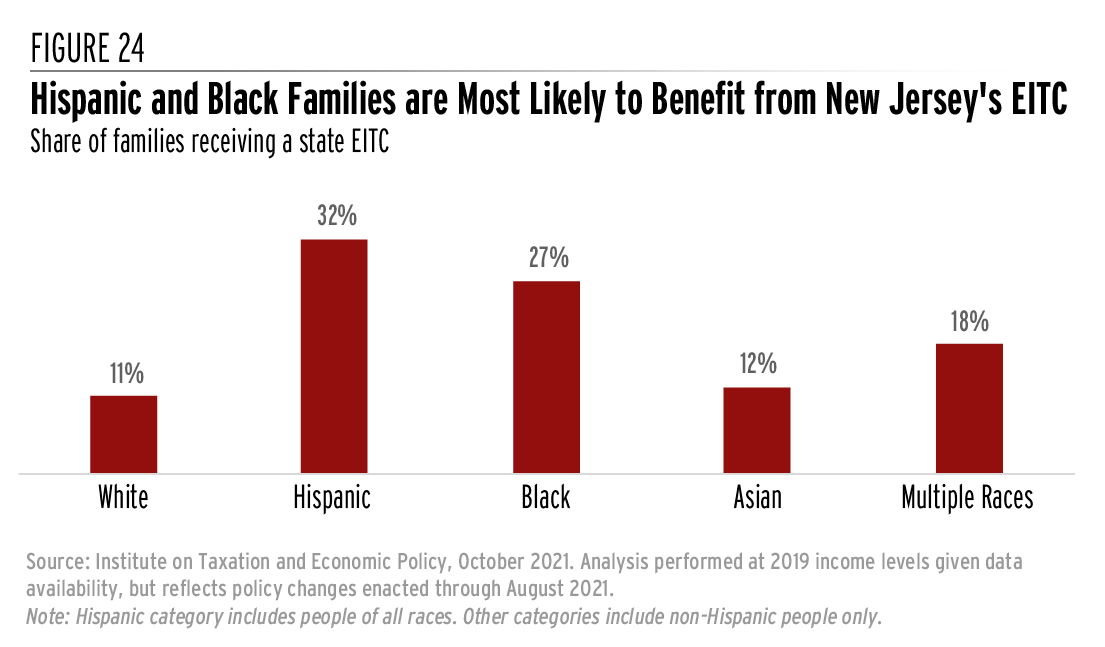
Other tax policies have the potential to advance racial equity through the tax code. Means tested and refundable Child Tax Credits (CTC), for example, boost the after-tax incomes of a large swath of families but can be particularly important to lower- and moderate-income families. Dependent care tax credits can also offer a critical boost to families most likely to struggle to afford the high cost of childcare. EITCs can bolster the incomes of low-wage workers, helping families move closer to meaningful economic security. All these credits advance the economic security of a diverse group of families of many different races or ethnicities, but they can be particularly powerful for Black, Hispanic, Indigenous, and other people of color confronting economic hardship created by systemic racism.
Tax credits directed toward low- and moderate-income renters are an especially promising option for narrowing racial disparities through state income tax law as an outsized share of this group is comprised of Black, Hispanic, and Indigenous households. In fact, this report offers evidence that a tax credit targeted to low-income renters will be even more efficient in reaching historically marginalized communities than one made available to all low-income individuals.
Other income tax reform options with an important racial justice component include extending tax benefits to single parents in the handful of states that do not already do so, and empowering local governments to reshape their tax bases in a more progressive fashion through laws allowing local-level income taxation.
Racism and discrimination have created highly unequal distributions of income and wealth across race and ethnicity. While personal income tax laws on their own will not solve these problems, a well-designed income tax that adheres to the recommendations made in this report offers one of the most promising routes to begin addressing racial income and wealth inequality through the tax code.
Introduction
Under a progressive personal income tax, families and groups with higher incomes pay higher effective tax rates than either middle- or low-income families. This basic design is understood as fair by most people because it asks more of those most able to pay, without adding to the financial hardship of families with lower incomes.[1] The core purpose of progressive income taxes is to raise revenue for public investments. But these taxes are also an effective way of lessening income inequality, including the vast racial income gap created through current and historical racism and discrimination. Well-designed income taxes can also mitigate racial wealth inequality, albeit indirectly.
The impact of income taxes on families at different income levels has been extensively researched and discussed. By comparison, the effect of these taxes on families of different races and ethnicities has received much less attention, though it has been a subject of legal scholarship since at least the mid 1990s.[2] This report builds on that work by bringing together both new and existing data to illustrate how personal income tax reform can narrow racial economic disparities. While the focus here is on state-level income taxes, many of these findings are applicable to the federal personal income tax as well.
Personal income taxes will not close racial wealth or income gaps on their own. But they can be part of the solution. At the state and local levels these taxes are particularly important because so many other revenue sources on which these governments rely—including sales taxes, excise taxes, fines, and fees—disproportionately impact lower- and middle-income families and worsen racial disparities.[3] Income taxes offer one of the best options for advancing, rather than hindering, racial equity through state and local taxes.
Addressing racial economic disparities through the tax code will not only help people in historically marginalized communities but will also allow society as a whole to benefit from the inclusive growth that occurs when communities prioritize shared investments. This report keeps this core goal in mind in discussing policy options for more racially equitable income taxes.
A note on the terminology used in this reportIn discussing race and ethnicity, it is necessary to apply labels to groups but also important to acknowledge that those labels can be limiting, imprecise, or even rejected by many of the people they are meant to describe. For instance, we use the term Hispanic in this report to describe people tracing their roots to Spanish- speaking countries in Latin America or to Spain because it is currently the most widely accepted term among the group it describes. In the Census surveys we rely on in our analysis, this group includes anyone who personally identifies as being of “Hispanic, Latino, or Spanish origin.” Although we use the term Hispanic in this report, we also acknowledge that it is Eurocentric, arguably excludes people with roots in areas of Latin America that do not speak Spanish, and that many members of this group would prefer to be called Latino or Latinx (a gender-neutral alternative to Latino). Similarly, we use the term Black to refer to people who describe themselves as Black or African American. In public opinion polling of Black individuals, these two terms are roughly equally preferred, with a significant majority of Black people stating that the two terms are equally acceptable. This report generally refers to people of Native American descent as Indigenous peoples. We use the term “American Indian” in our table labels and methodology documents as it seems to have reasonably wide acceptance among the population it describes. It is the term used in the Census surveys on which we relied in building our model databases, and it is found frequently in statute. Throughout this report, the term “white” is generally meant to refer only to non-Hispanic white people. The phrase “people of color” is an inexact term used to describe people who have been marginalized because of their race or ethnicity. In the context of this report, it is typically meant to refer to groups facing discrimination that has resulted in below-average incomes or wealth such as Black, Hispanic, and Indigenous people as well as Native Hawaiians, Pacific Islanders, and some segments of the Asian community. |
Systemic Racism Has Created Vast Racial Inequities
A long history of racism and discrimination, continuing through the present day, has created enormous racial disparities. The roots of racial inequities are both deep and broad, from national public policies and the shortcomings of our economic system down to countless individual acts of racism.
Economic disparities across race and ethnicity manifest in health, education, housing, income, wealth, and many other measures of well-being. Any of these can be relevant for tax purposes, though income and wealth are typically the two most important. Income is usually measured as the resources generated or received in the span of a single year, whereas wealth is the store of resources inherited or accumulated throughout one’s lifetime.
Racial income gaps are driven by discrimination in pay and hiring, disparities in geographic access to employment opportunities, and educational achievement gaps created through an inequitable system of education funding, among other factors.[4] The median income for white households in 2019 was $72,000, compared to $53,000 for Hispanic households, $44,000 for Indigenous households, and $44,000 for Black households. Asian households’ median income was $95,000, though it is important to note that a disproportionate share of Asian households live in high-cost areas such as California, Hawaii, and New York, and that some segments of the Asian community have median incomes far below this level.[5] Income taxes offer a straightforward way to lessen income inequality both across race and in general.
Systemic racism is even more apparent in our nation’s racial wealth gap, which is far larger than the gap in annual income. Today the median Black household has just 13 cents in wealth for every dollar held by the median white household while the median Hispanic household has 16 cents.[6] These gaps cannot be explained by the individual achievements of these households and are largely driven by a lack of intergenerational wealth mobility. The median household headed by a Black college graduate, for example, has less wealth than the median white household headed by a person without a high school diploma.[7] Far too often, “studying and working hard isn’t enough for Black Americans.”[8]

The effects of the racial wealth gap, created through centuries of racism and enduring advantages for white wealth-building, carry through across generations in countless ways. President Roosevelt’s New Deal and other policies in the middle of the last century helped build the American middle-class. But often, those policies excluded people of color. The GI Bill, VA loans, and FHA loans, for example, provided a pathway to college education and homeownership for millions of veterans and civilians. But the programs were either racist in policy or administration and generally excluded Black people. The effects of these policies compounded over time, allowing white families the upward job mobility that higher education enables and the generational wealth building that home ownership facilitates.
Wealth begets wealth. Lack of wealth can beget the same. So, without adequate start-up capital or access to credit, people of color are less likely to start a business and more likely to work for someone else, often for lower pay than their white colleagues.[9]
Student loan debt is a universal problem, but people of color are more likely to be weighed down by it. Instead of buying a house, young college graduates of color are more likely to have student loan debt because their parents lack the income or wealth to finance the high cost of college education.[10]
Residential segregation persists, in part due to the legacy of government redlining and white homebuyers’ aversion to living in areas with significant nonwhite populations.[11] Instead of enjoying robust growth in their home equity over time, many people of color have seen their home values stagnate or even decline.
Instead of building a nest egg for retirement, people of color are often confronted with having to make a hardship withdrawal from their retirement accounts because of a financial difficulty that cannot be resolved by drawing on family wealth.[12]
And instead of receiving an inheritance, intergenerational transfers often flow in the other direction, with working-age people of color often financially supporting the basic needs of their parents and other family members.[13]
The racial wealth gap did not occur in a vacuum: public policy contributed. The gap has swollen to such a point that it cannot close without a robust policy intervention. One recent analysis concluded that if current trends continue, it will take Hispanic families more than 2,000 years to reach white households’ current wealth levels while Black households are estimated to never “catch up” to white households.[14] It is against this backdrop that we consider tax policy in general, and state personal income taxes in particular, as components of an approach to narrowing racial disparities in both wealth and income.
State and Local Tax Policy Can Lessen, or Worsen, Racial Inequities
State and local revenue policy intersects with our nation’s racial disparities in myriad ways.
Inadequate property tax bases can lead to underfunded schools that hinder educational achievement for students of color. Local governments’ heavy reliance on fees and fines can lead to over-policing and criminalization of communities of color. And an overreliance on regressive consumption taxes tends to worsen income inequality along both racial and socioeconomic lines by requiring families with the lowest incomes to pay a higher percentage of their earnings in tax.[15]
State and local tax revenue can, however, be a powerful tool for addressing racial disparities through the investments they make possible in education, health, housing, and other areas essential to broadly shared prosperity.
Moreover, taxes on income or wealth can counteract racial and economic disparities. Estate and inheritance taxes, for instance, can curb the concentration of extreme wealth in the hands of a small number of families. Personal income taxes, which are the focus of this report, have the potential to directly counteract racial income inequality and indirectly reduce racial wealth inequality.
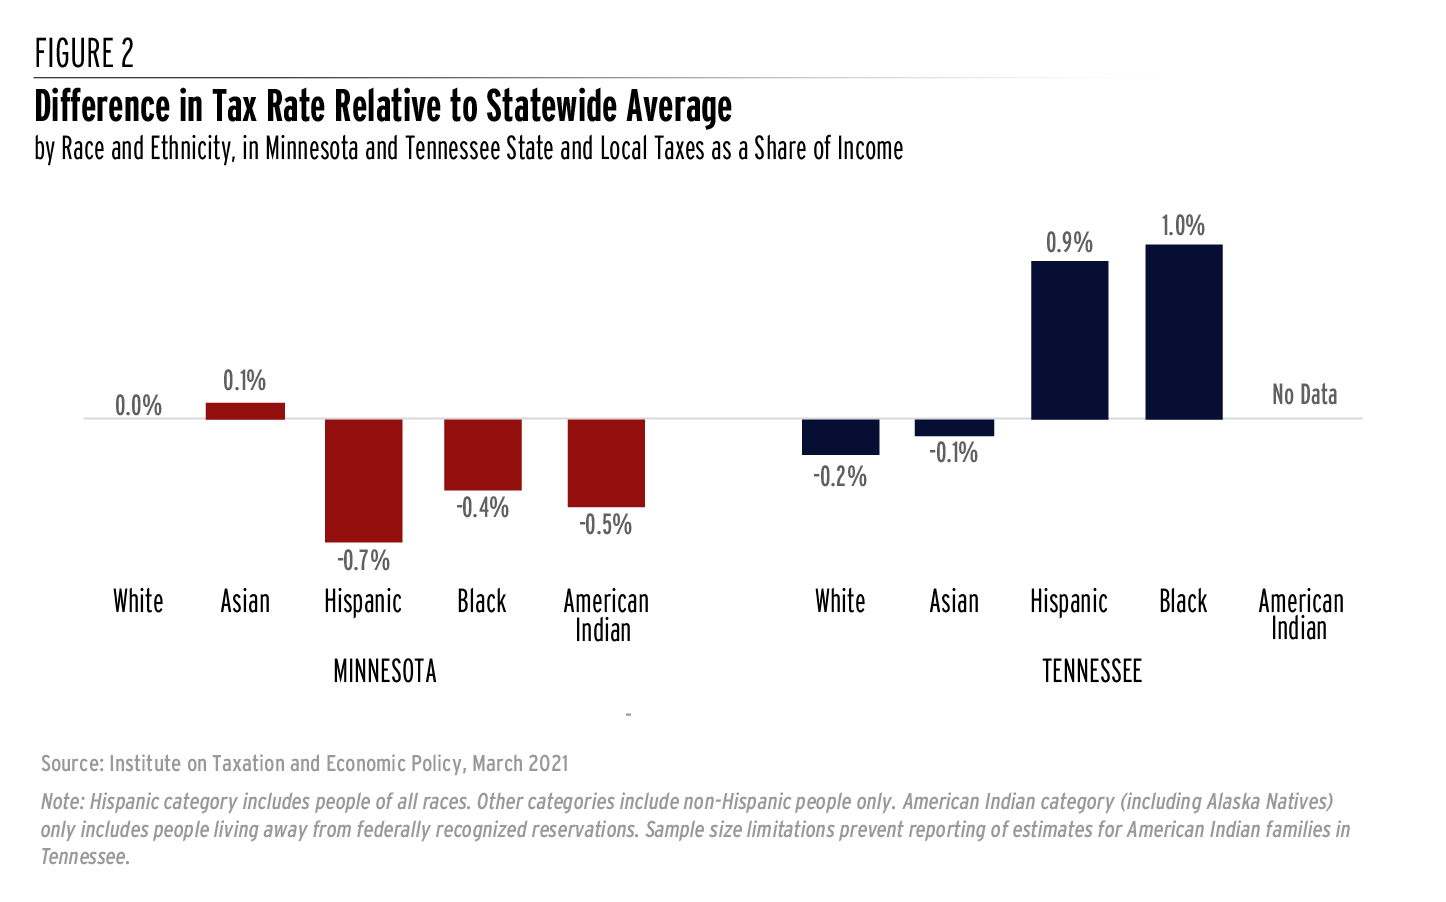
ITEP’s recent analysis of Minnesota’s tax system, which includes a personal income tax, helps demonstrate this fact.[16] Black, Indigenous, and Hispanic households in Minnesota pay an average overall tax rate slightly below the statewide average largely because of the state’s progressive personal income tax structure. White and Asian households, by contrast, pay average rates at, or slightly above, the statewide average.[17] The result is a system that narrows the average income gap between white and Asian residents, who tend to have higher average incomes, compared to Black, Indigenous, and Hispanic residents—albeit only slightly.
Tennessee’s state and local tax system, which lacks a personal income tax and relies heavily on sales and excise tax dollars, produces the opposite effect. Sales taxes take a larger share of income from low- and middle-income families than from well-off families because lower-income families spend much more of what they earn on basic expenses. This regressive distribution across income levels shows up in the distribution of taxes across race and ethnicity as well. In Tennessee, Black and Hispanic families on average are taxed at overall rates above the statewide average, while white and Asian families are taxed at below-average rates. Racial income inequality is worsened by the steeply regressive nature of Tennessee’s tax code.
These findings point toward personal income taxes being an essential element of a racially equitable tax code. But what does a racially equitable personal income tax look like?
At a basic level, more progressive income taxes with higher rates on top earners are typically more effective in advancing racial equity. Extreme disparities in income across groups are reduced when groups with higher average incomes face higher average tax rates. Such a system also lessens racial wealth inequality because income is a component of building wealth for the long-term, and a progressive system bolsters lower-income families’ opportunities for building wealth relative to a regressive system requiring them to set aside more of their earnings for paying tax.
But it is vital to look beyond tax rates when assessing the racial equity of personal income tax codes. The tax base matters as well: that is, the kinds of income that are taxed and the kinds of tax subsidies that are offered. All too often, the race equity potential of state income tax codes is undercut by preferences for the wealthy. Two households with the same annual income can be treated differently under state income tax law. The one with more wealth, more income from wealth, and more ways to generate wealth – who is more likely to be white – often ends up paying less tax. This reality informs many of the recommendations made in this report.
A Case Study: Comparing Personal Income Taxes in California and Virginia
The choices state lawmakers make in setting up their personal income tax codes determine the distribution of the tax by both income level and race. While most state personal income taxes chip away at the racial income divide, the extent to which they do so varies. The analysis in this section helps illustrate this point by looking at the overall racial and economic distribution of personal income taxes in two states with dramatically different income tax structures: California and Virginia.
Subsequent sections of this report discuss in more detail many of the income tax policies that differ between these two states and outline options for racially equitable income tax reform. In general, the choices California lawmakers have made in setting up their personal income tax code have done more to advance racial equity than the choices made by Virginia lawmakers. In both states, however, vast racial disparities persist even after state income taxes are applied—a fact that will require lawmakers to do far more, through the tax code and other means, to advance racial equity.
The most pronounced difference between California and Virginia’s income taxes is the tax bracket structure, especially at the high end of the income scale. California levies marginal tax rates ranging from 1 percent to 13.3 percent, with that top bracket only applying to taxable incomes over $1 million (or $1.2 million for married couples). In Virginia, the bracket structure is much narrower and the rates much flatter, ranging from 2 percent to just 5.75 percent. Virginia’s top bracket was written into law decades ago and is now extremely outdated. It applies to taxable income in excess of just $17,000. Unlike in California, most Virginians are subject to the state’s top income tax rate on a portion of their income.
There are also major differences between these two tax codes for families with low- and moderate incomes. California has a refundable Earned Income Tax Credit (EITC) and Young Child Tax Credit, as well as a nonrefundable low-income renters’ credit. Virginia, by contrast, does not have any refundable tax credits (meaning credits in excess of personal income tax liability) aimed at helping families, though it does have a nonrefundable EITC and another nonrefundable low-income credit.
For families in the middle of the income distribution, California offers more generous personal and dependent credits, and standard deductions, than Virginia.[18] It also offers a Child and Dependent Care Tax Credit to help mitigate the high cost of childcare, while Virginia offers a more modest deduction for those expenses. California’s tax code is also more equitable for single parents, who are more likely to be people of color, with more favorable tax brackets and deductions for head of household filers. Virginia, by contrast, requires single parents to claim the same standard deduction as other single individuals and does not vary its tax brackets based on filing status.
Taken together, Figure 3 shows that these changes result in a much more progressive income tax distribution in California across the income spectrum. It also indicates that for many low- and middle-income families, California’s personal income tax results in a lower tax rate than Virginia’s, even though California’s tax raises more revenue overall (calculated per person or as a share of statewide income) as a result of higher tax rates on extremely affluent households. This revenue can be used to address the needs of all communities and to provide targeted services to historically marginalized groups.

These stark differences in the distribution of personal income taxes by income level also show up in the distribution of taxes by race. Racism and discrimination have held down Black and Hispanic average incomes in California to levels 35 to 40 percent below white average incomes. As a result, California’s progressive income tax asks somewhat less of the average Black family (4.0 percent of income) or Hispanic family (3.6 percent) than it does of the average white family (5.0 percent). Because California’s income tax is more sensitive than Virginia’s to differences in ability to pay across income levels, it also better accounts for differences in ability to pay across race and ethnic groups. This makes the tax valuable in reducing racial and economic inequities.
But while California’s income tax is narrowing the state’s racial income gap, it is important to emphasize that there is still significant room for improvement in California’s tax code.
The equity of California’s income tax, for example, is partly undercut by the fact that the largest income tax subsidies offered in the state tend to benefit higher-income households and profitable businesses.[19] Moreover, personal income taxes are just one component of California’s overall revenue structure that also includes regressive levies such as sales taxes, excise taxes, fees, and fines that worsen racial inequity.[20] Overall, California continues to confront immense racial and economic disparities even after personal income taxes are collected and could be doing more to advance equity through its tax code.
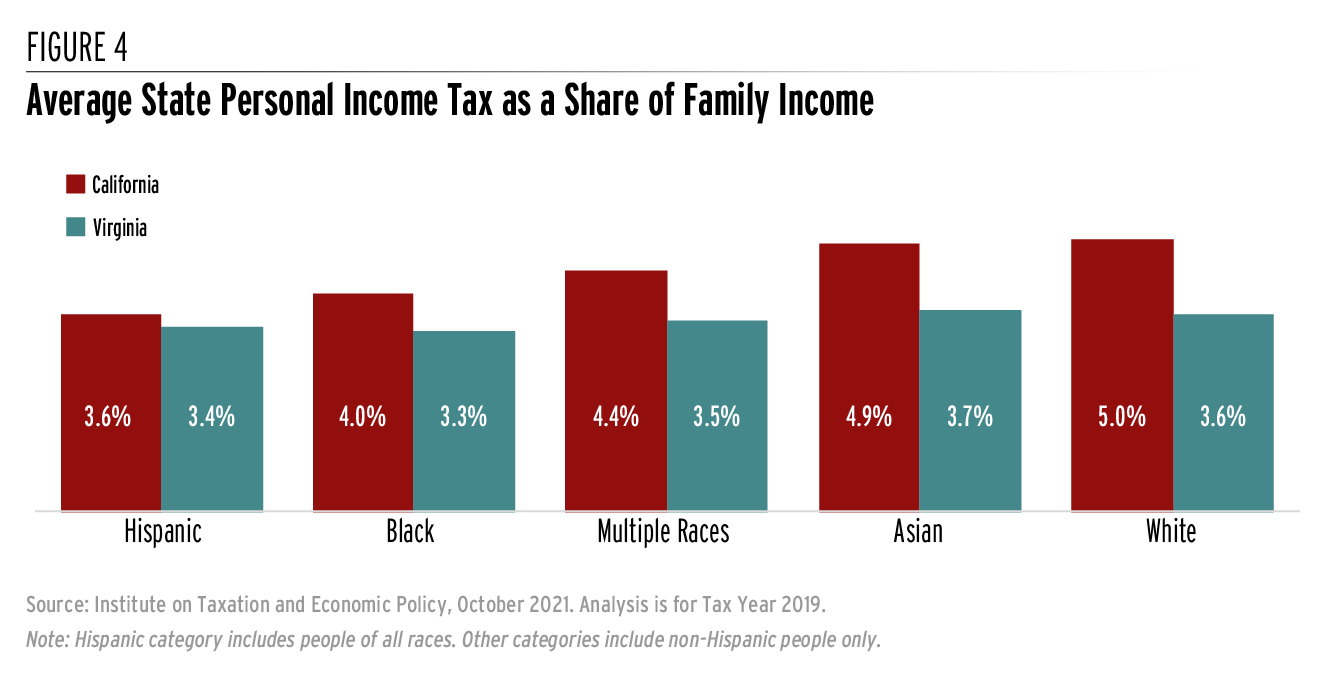
Virginia’s personal income tax follows a pattern that is broadly similar to California’s, but its flatter structure makes it much less effective at narrowing racial disparities. In Virginia, Black families’ average income is 36 percent lower than white families’ average income while Hispanic families’ average income is 31 percent lower. Despite these large differences in economic circumstances, however, effective personal income tax rates relative to income show little variation across race and ethnicity in Virginia, ranging from a low of 3.3 percent for the average Black family to a high of 3.7 percent for the average Asian family. As a result, Virginia’s income tax does less than California’s to address racial and economic inequality.
Implementing the types of reforms identified in this report could make Virginia’s tax system, and those of every other state, far more effective at combatting racial income inequality.
Recommendations for Race-Forward State Personal Income Tax Reform
The following discussion outlines 10 reforms that can narrow racial gaps in both income and wealth. Most of these reforms make personal income taxes more progressive in some way, but they largely emphasize tax base design rather than focusing solely on tax rates.
While income level is usually the most important factor in determining income tax liability, a range of other factors such as wealth, homeownership, age, and family structure are also relevant. These characteristics vary across race and ethnicity and, in many cases, are shaped by past and ongoing racism.
The following sections emphasize the importance of levying a broad, progressive income tax free of carveouts for the high-income and high-wealth families who don’t need them.
Specifically, they explore the impacts of repealing tax subsidies or otherwise asking more of high-income investors, business owners, employees, retirees, and homeowners. And they examine how state income tax codes can be used to lift lower-income workers, renters, and families with children.
Some of these reforms, such as paring back tax subsidies for investors, homeowners, and retirees have been recommended by scholars studying the intersection of taxes and race for decades.[21] We build on their work here by focusing on state-level income taxes rather than the federal income tax, which has received more attention. We also bring in new and updated data, including analyses performed through a novel merging of tax and survey data in our proprietary microsimulation tax model.[22] Finally, a table in Appendix A indicates which options for income tax reform are relevant in each state.
Levy Higher Tax Rates on Top Earners
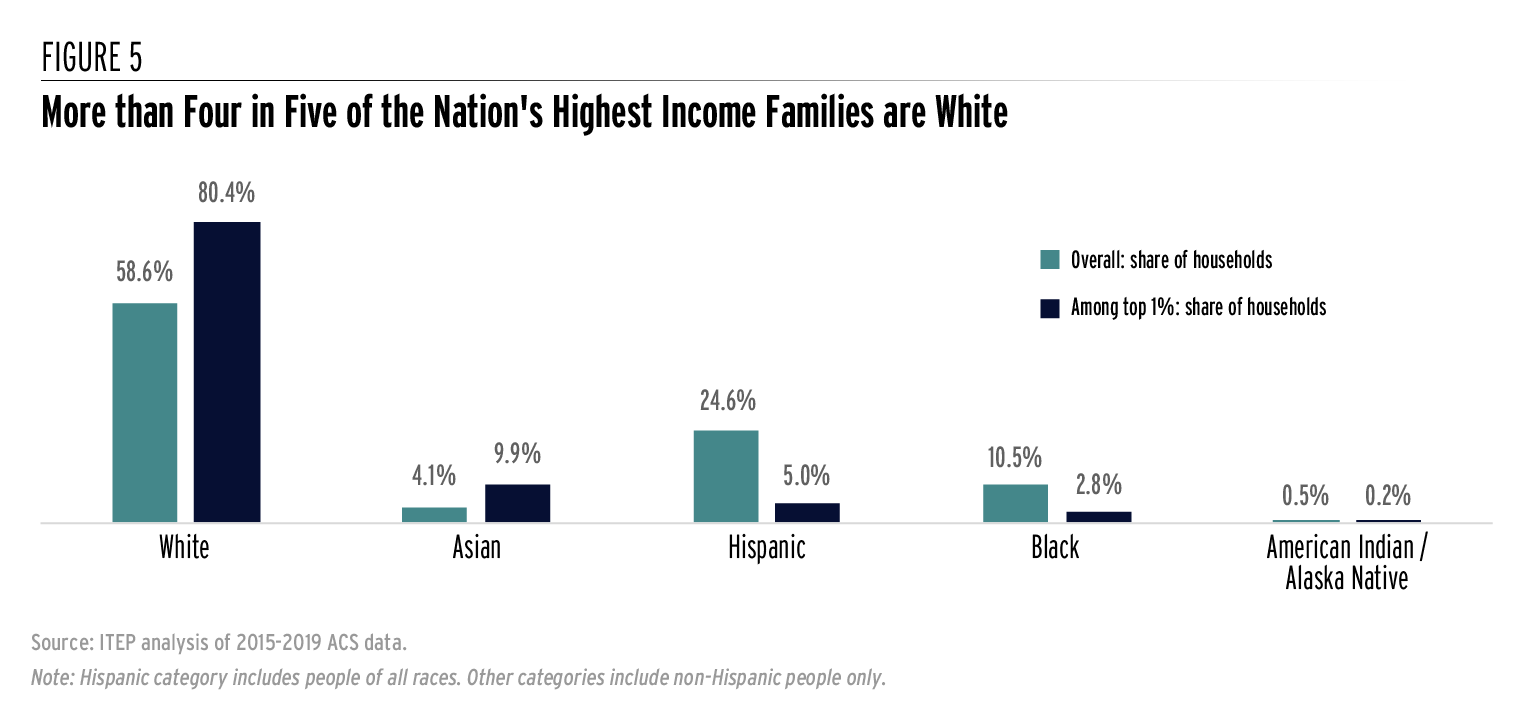
America is highly unequal and has higher levels of poverty for people of all races than most other wealthy democracies. Centuries of racism and discrimination in the labor market, education systems, and society broadly have denied opportunities to many people of color. One result of this systemic racism is that a disproportionate share of high-income families are white. Fifty-nine percent of tax units in the United States are white, but white families account for roughly 80 percent of very high-income families, meaning those falling among the top 1 percent of earners. Hispanic, Black, and Indigenous families are all much less likely than average to be among the nation’s top 1 percent of families by income level. Just 5 percent of the nation’s highest-income families are Hispanic, less than 3 percent are Black, and only 0.2 percent are Indigenous families.
The racial wealth gap is a key contributor to the underrepresentation of families of color among the nation’s highest-income families. For the small group of families at the very top of the economic spectrum, income is more likely to be derived from returns on investments in the stock market and privately owned businesses. More than half of all corporate equities, mutual fund shares, and private business wealth is held by just 1 percent of the nation’s wealthiest families.[23]
Raising taxes on top earners is widely understood to be a powerful tool for building economic equity. It is also a powerful tool for advancing racial equity both because an outsized share of top earners’ income flows to white families and because doing so can raise substantial revenue with which to fund public investments that directly combat inequality. Several states have implemented this policy option in the last several years including Arizona, California, Connecticut, Hawaii, Maryland, New Jersey, New York, and New Mexico.
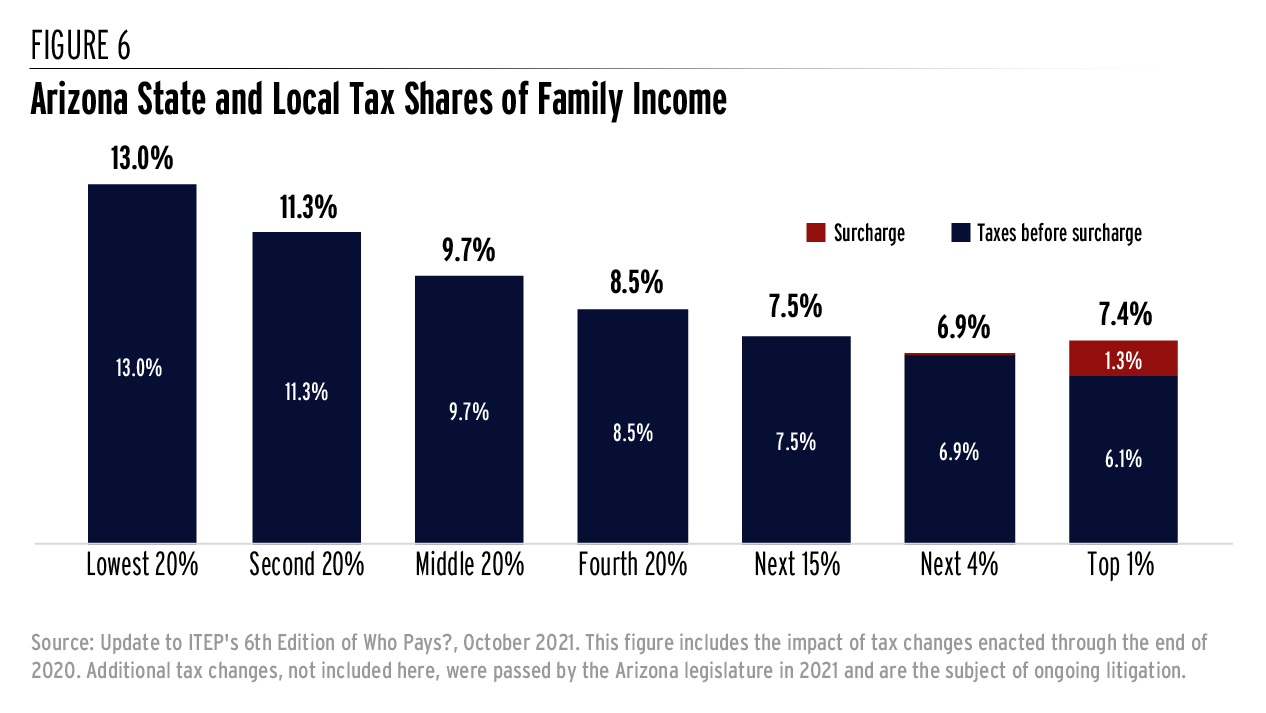
The most recent reform of this type was approved by Arizona voters in November 2020 through a 3.5 percent tax surcharge on income over $250,000 for individuals or $500,000 for married couples.[24] If the reform is allowed to stay in effect as voters intended, the result will be to narrow inequality in the state across both income and race.
Figure 6 shows how the surcharge improves the overall distribution of Arizona taxes across incomes by boosting the very low effective tax rates paid by the top 1 percent of earners. This figure includes the impact of personal income taxes as well as sales taxes, property taxes, excise taxes, and other levies.[25]
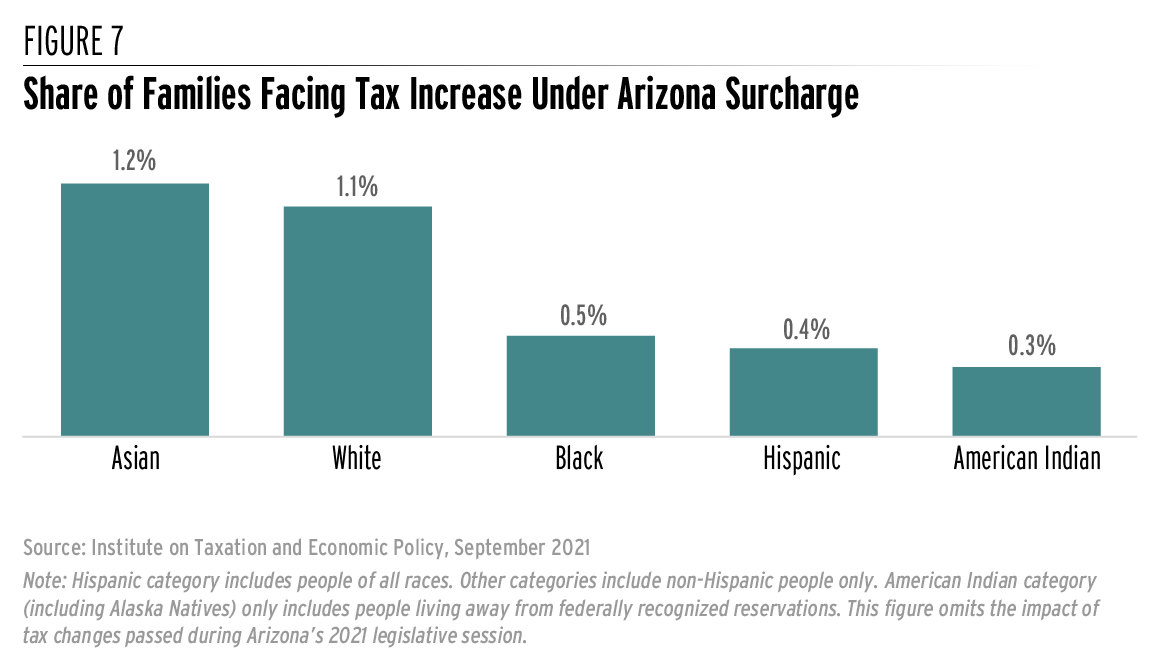
Looking across race and ethnicity, more than four in five dollars raised through the surcharge will come from non-Hispanic white households, as they are significantly overrepresented among families at that very high-income level. Figure 7 shows that a very small share of people of all races are affected by the Arizona surcharge, but also that white and Asian families are about twice as likely to be affected as Black or Hispanic families, and more than three times as likely to be affected as Indigenous families.
Shortly after voters approved the surcharge, the Arizona legislature sent Gov. Doug Ducey a package of bills that effectively negate the levy, albeit in a roundabout fashion.[26] The governor promptly signed those bills, but voters are already working to block that legislation and reaffirm the surcharge they approved last year.[27] The legislation is also likely to be challenged in court on the grounds that it violates the state constitution.[28] As of this writing, the fate of Arizona’s surcharge remains uncertain. But the potential of this policy to advance racial equity is clear.
Looking around the country, states have significant room for improvement in their taxation of top earners. Among states with personal income taxes, the median state has set its top rate to kick in at taxable income levels of just $60,000 for married couples. Even more problematic are the eighteen states that apply their top tax rates starting at taxable incomes below $20,000—including nine states applying a single, flat tax rate to all taxable income. A full summary of top income tax rates, and the income levels at which those rates apply, is available in Appendix B.
When state and local tax systems are viewed on the whole—including not just income taxes but also sales, excise, property taxes and other levies—the picture becomes even bleaker. Most states tax top earners at a lower overall rate than low-income families.[29]
Unfortunately, constitutional barriers in some states make addressing this more difficult. Colorado, Illinois, Massachusetts, Michigan, and Pennsylvania have constitutionally mandated flat taxes, meaning that they cannot enact targeted rate increases on top earners unless they first amend their constitutions (Massachusetts voters will have the chance to do so at the ballot box in November 2022). Additionally, Georgia and North Carolina’s constitutions specify a maximum top income tax rate, which limits state lawmakers’ ability to raise rates on top earners. These kinds of constitutional prohibitions work to solidify racial inequity by making it more difficult to address racial disparities through equitable income taxation.
While higher income tax rates on top earners will not bring an end to racial and economic disparities, such a reform should be a cornerstone policy in any agenda to advance race equity through the tax code. Asking more of those families with the greatest ability to pay is an essential characteristic of equitable tax codes. As the following sections of this report show, lawmakers should also be sure not to lose sight of the tax base. The ways in which different kinds of income are taxed matters just as much, if not more, than the headline tax rate.
Tax Investment Income Equitably
Broad-based income taxes apply not just to workers’ wages and salaries, but also to profits investors receive through capital gains or dividends. Unfortunately, the federal tax system and every state system disadvantages workers by offering preferential tax treatment to high-income investors—a group that is predominately white. Ideally, states should pursue the opposite course by asking more of high-income investors. Doing so can directly counteract racial economic disparities.
According to the Internal Revenue Service (IRS), less than 9 percent of households reported net capital gains income on their federal tax returns in 2018—meaning profits from the sale of assets such as stocks, bonds, real estate, and antiques.[30] Most of these gains were realized by high-income families. Households with federal adjusted gross incomes (AGI) in excess of $200,000 reported 85 percent of taxable capital gains, even though they accounted for less than 6 percent of all returns filed. The very wealthiest 0.1 percent of Americans— those with AGI over $2 million—received more than half, or 53 percent, of all capital gains income. Households with AGI of less than $100,000—a group that includes 4 out of 5 filers— collectively received just 7 percent of all capital gains income.
Because capital gains overwhelmingly flow to high-income households, they also tend to flow mostly to white households. But gaps in asset ownership levels across race and ethnicity are even larger than the racial income gap, and capital gains income is therefore likely to be even more skewed in favor of white households than the distribution of income overall.[31]
The reasons behind the racially inequitable distribution of asset ownership, and capital gains income, are numerous and systemic. Racist housing policies that prevented people of color from becoming homeowners are one contributing factor, as homeownership is a proven path toward building wealth over time. More generally, with vast differences in intergenerational wealth across race and ethnicity, people of color are much less likely than white families to receive a significant inheritance that they can invest and use to generate capital gains income. Making matters worse, there is also evidence that centuries of racism, discrimination, and false promises have created a wariness among many people of color to participate in the stock market.[32] And perhaps more importantly, investment firms have been slow to diversify their workforces and to market their products to people of color— particularly when compared to the real estate or insurance industries.[33] As Dorothy Brown of Emory University explains, for too long the financial industry “hasn’t seen black Americans as potential customers.”[34]
Taken together, the result of this long and ongoing history of racism and discrimination is that investment income is incredibly concentrated in the hands of white families. Approximately 8.1 percent of Black households and 7.3 percent of Hispanic households own stocks or mutual fund shares outside of a retirement savings account. Among non-Hispanic white households, by contrast, the comparable figure is 27.9 percent.[35] Even among asset owners, the gaps in the asset value are staggering. The median white household owning stocks or mutual fund shares owns $45,100 in such assets compared to just $20,000 for Hispanic households and $8,500 for Black households.[36]
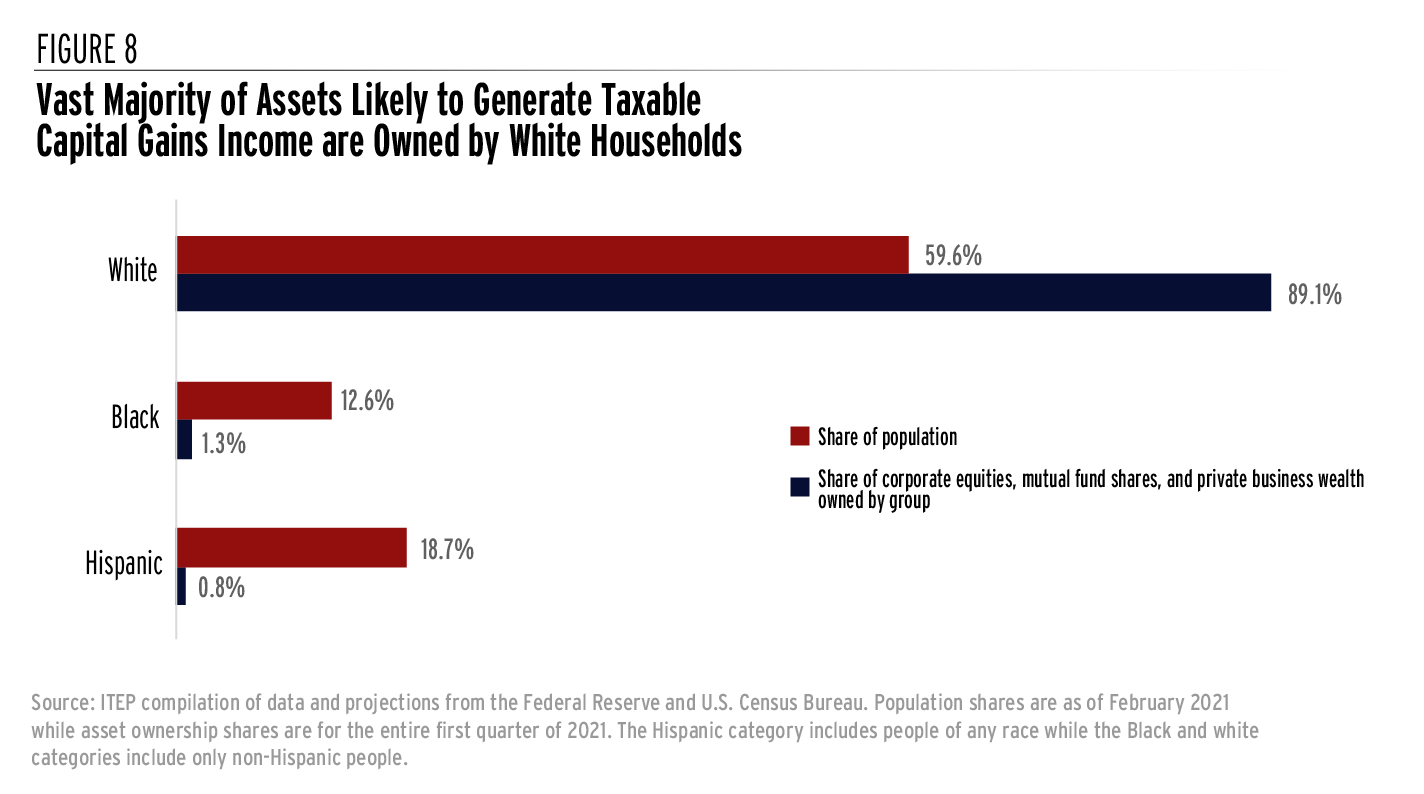
In total, close to 90 percent of the types of assets most likely to generate taxable capital gains income —private business wealth and corporate equities and mutual fund shares held outside of retirement accounts—are owned by white families. Just 1.3 percent are owned by Black families and less than 1 percent are owned by Hispanic families.[37]
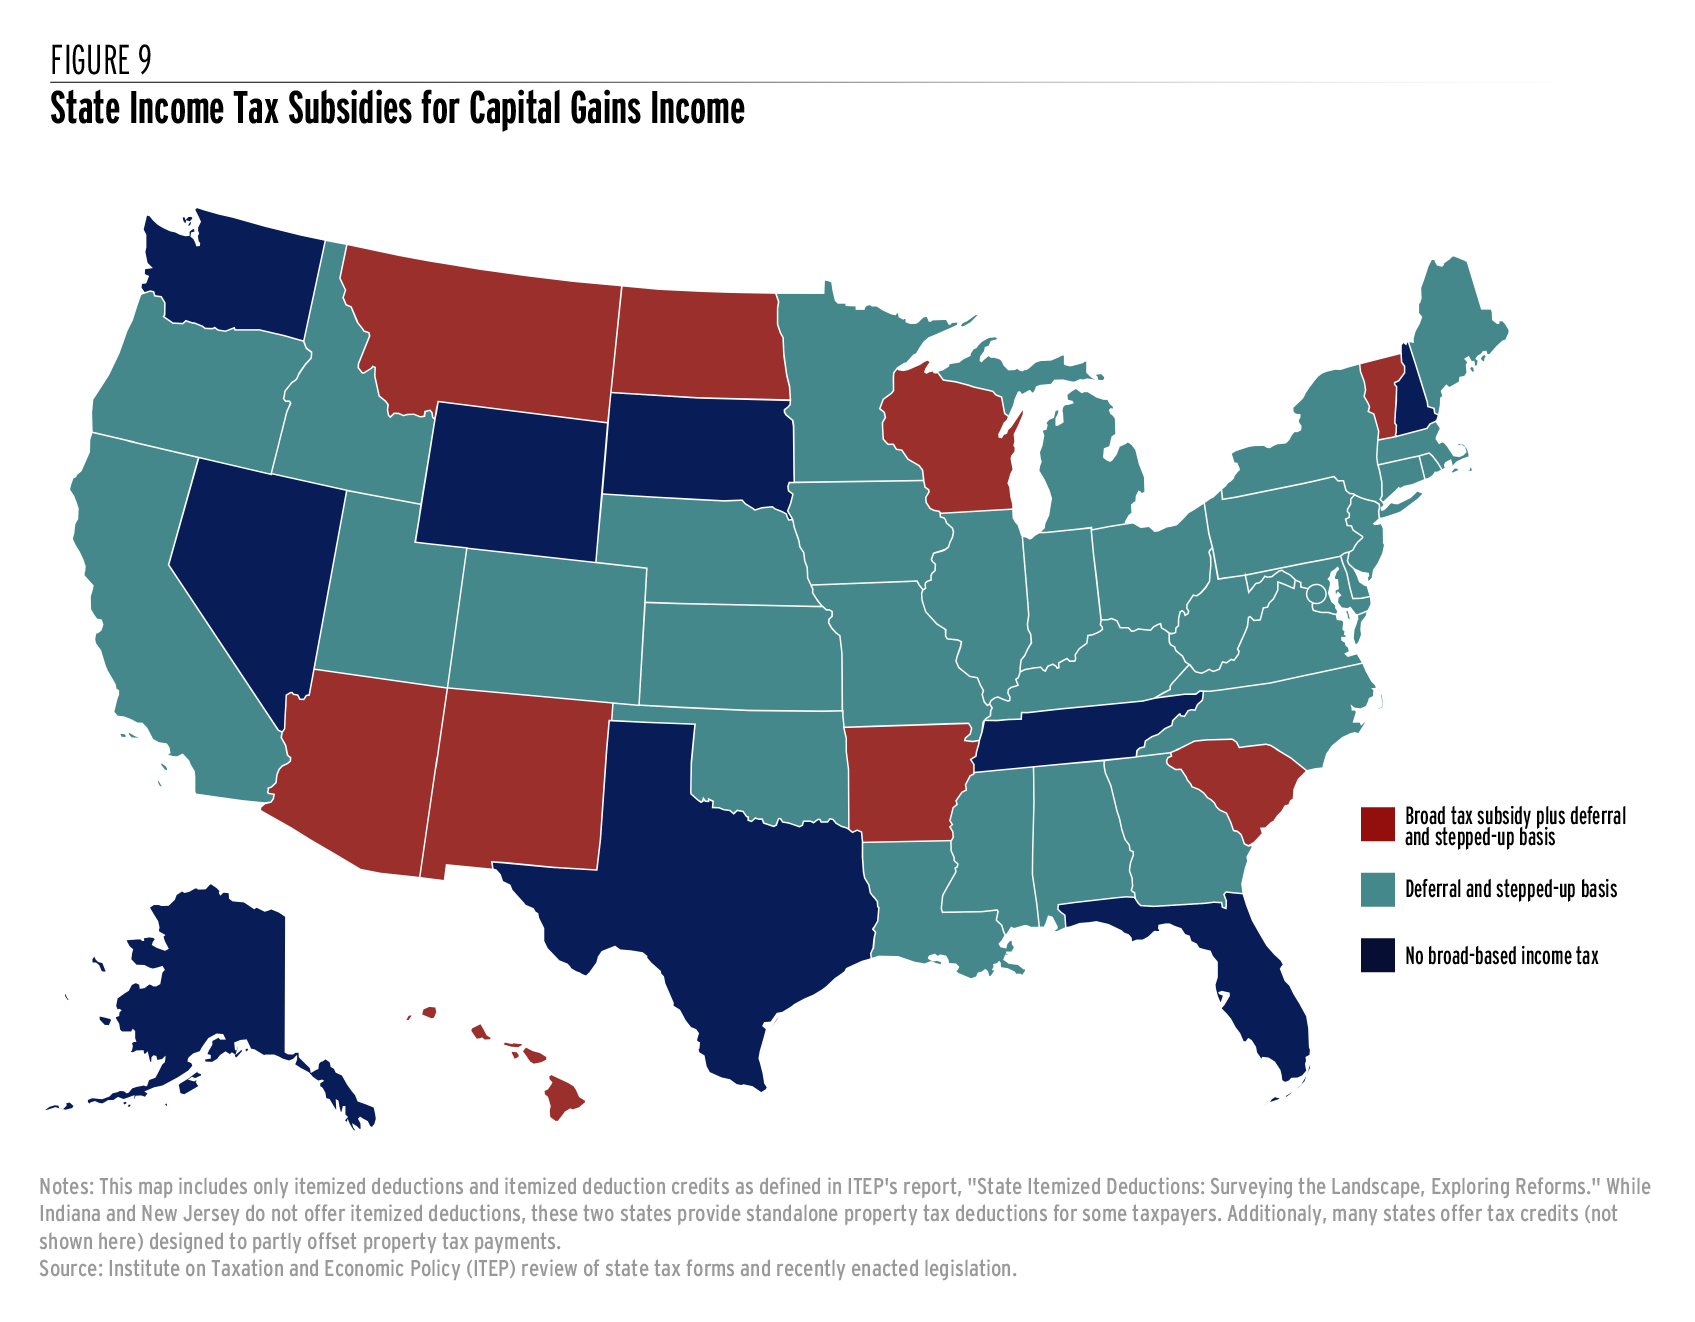
States offering deductions or preferential tax rates to investors should repeal those carveouts to advance racial equity and put investors and workers on a more even footing. Nine states currently offer a broad tax subsidy on most or all forms of capital gains income, and more than a dozen states offer narrower subsidies for capital gains derived from specific activities (often gains on certain assets located solely within state boundaries, though these kinds of subsidies have sparked legal questions relating to whether they unconstitutionally interfere with interstate commerce).[38] Some states have made progress on this front in recent years, including New Mexico which trimmed its capital gains exclusion by 20 percent and Colorado which largely repealed its exclusion for gains on assets within the state.[39]
A truly race-forward approach to capital gains taxation requires looking beyond these more obvious subsidies and pursuing deeper reforms to the way in which capital gains income is measured and taxed.[40]
Under a provision known as “deferral,” for instance, income tax on capital gains is paid only when the asset is sold. Thus, a stockholder who owns a stock over many years does not pay any tax as it increases in value each year. Salary and wage income, by contrast, is taxed every year. Eliminating the deferral benefit and shifting to an annual system of taxing capital gains (sometimes known as mark-to-market taxation) would go a long way toward lessening the degree to which state income tax codes preference wealth over work. This kind of system is already used in limited situations involving derivatives and securities held by dealers.[41] Implementing it in a broader fashion has been proposed at both the federal level and in New York State for very high-income or high-wealth people who already have tax accountants who could handle the additional tax compliance effort involved.[42]
Eliminating or curtailing “stepped-up basis” offers another worthwhile avenue for reform. When used in combination with the “deferral” benefit just described, this tax subsidy allows wealthy families, most of whom are white, to pass stocks and other property down through the generations without having to pay tax on the income created by those investments.
Ordinarily, if a $100,000 investment grows in value to $1 million, the $900,000 gain would be considered taxable income at the time the investment is sold. But if a parent holds onto that investment until death and passes it on to their children, the $900,000 gain is completely tax-free. That is, the child’s “basis” in the investment is “stepped-up” to $1 million and any future gain or loss in the asset’s value will be calculated relative to that $1 million value.
This outdated tax subsidy has been an active contributor to the nation’s growing wealth inequality and the Biden administration has recently proposed paring it back dramatically for estates with more than $1 million in capital gains.[43] If the federal government succeeds in limiting stepped-up basis, it will be important for states to couple to this reform in order to ensure a more equitable treatment of capital gains in their own tax codes. Even if federal policy does not change, however, states should explore limiting or eliminating this provision in their own tax codes.[44]
Short of eliminating stepped-up basis or moving in the direction of a mark-to-market tax system, states might also choose to simply raise rates on capital gains income. Doing so could help mitigate the subsidies provided through deferral and those provided at the federal level through special, lower rates applied to capital gains and dividends. That is, taxing capital gains at a higher rate than other sources of income at the state level could lead to a more equitable taxation of capital overall, since the federal government has unwisely chosen to tax capital gains at a lower rate than other types of income.
There is some precedent for this at the state level, as Massachusetts already taxes short-term capital gains at a higher 12 percent rate, compared to the 5 percent rate it applies to ordinary income.
For state lawmakers concerned with racial wealth inequality, higher taxes on capital gains income represent one of the clearest, shovel-ready approaches to using the tax code to lessen the extreme concentration of wealth.
Tax Pass-Through Business Income Equitably
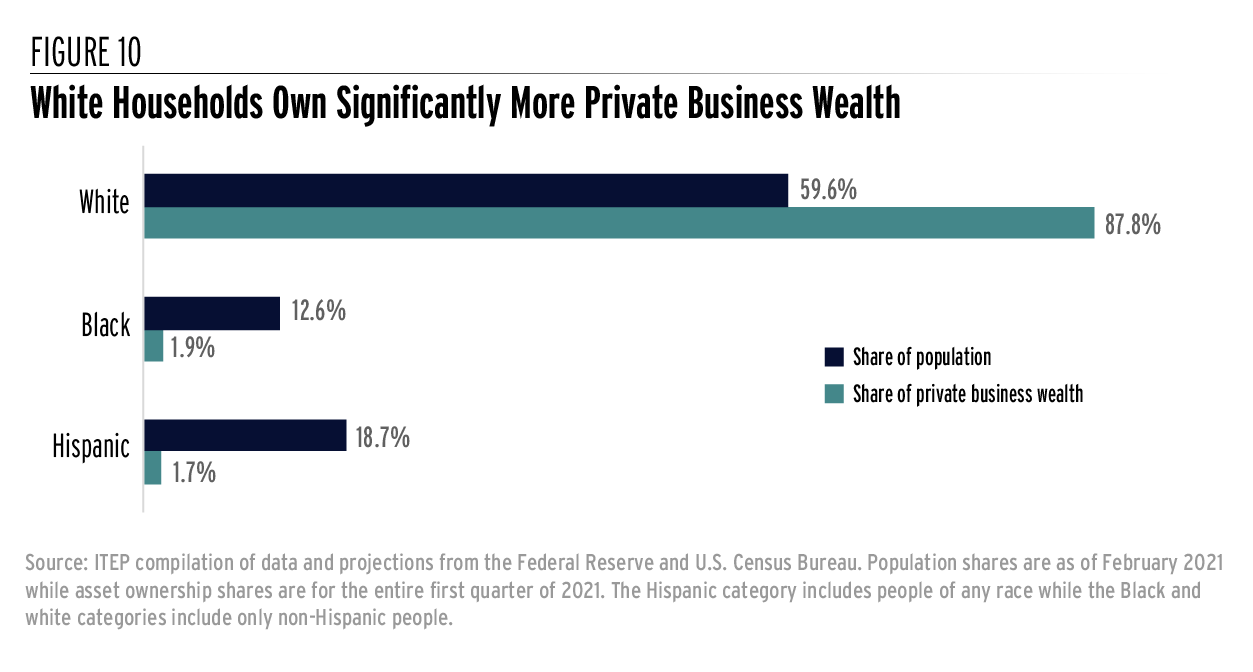
Entrepreneurship has long been held up as a vehicle for upward economic mobility and a way to accumulate wealth in America, but the opportunity to become a successful business owner is not equally available to all communities. Business owners are more likely to be white, male, wealthy, and older compared to the rest of the population.[45] Nearly 88 percent of private business wealth is owned by white people even though they account for less than 60 percent of the U.S. population overall. Black people, at 12.6 percent of the population, own just under 2 percent of business wealth and Hispanic people, at 18.7 percent of the population also own less than 2 percent of private business wealth.[46]
The distribution of private business wealth is also highly unequal across the economic spectrum, with 85 percent of such wealth held by the top 10 percent of families and more than half held by the top 1 percent alone.[47] The bulk of private business wealth is owned by a relatively small group of affluent white families.
Discriminatory practices in the housing market and financial sector have, throughout history, reduced the ability of communities of color to build and pass on business wealth.

The racial wealth gap and discrimination in lending practices affect capital availability for minority entrepreneurs—one of the most important requirements for starting a business. Black entrepreneurs are less able to acquire startup capital from virtually all sources—formal (banks, venture capital, angel investors, etc.), informal (friends, family, close associates), and owner debt and equity.[48]
More than half (53.4 percent) of Black-owned businesses that apply for financing are denied, which is more than double the rate of white-owned businesses.[49] This can be due to lender racism, lenders being unfamiliar or unreceptive to business ideas that might have a market in Black communities, or credit challenges that Black borrowers face.[50]
While the credit-scoring system may seem like a race-neutral way of assessing financial risk, it can perpetuate the racial wealth gap. For instance, white homeownership rates are 30 percent higher than Black homeownership rates, and not until recently were rental payments considered in most credit-scoring models.[51]
These barriers to capital make entry into the business world far more difficult for entrepreneurs of color. In fact, almost 28 percent of Black-owned firms and nearly 15 percent of Hispanic-owned firms (compared to 9.4 percent of white-owned firms) were categorized as “discouraged borrowers,” meaning they avoided applying for credit outright, due to the expectation that their applications would be denied.[52]
The effects of past discrimination on business ownership can even be found at the top of the economic spectrum for Black Americans. The top 5 percent of Black Americans (with a net worth of at least $357,000) hold 9 percent of their non-financial assets in business equity, compared to 37 percent for white Americans above a similar level of wealth.[53] Because white families have, overall, more business assets, the benefits of tax subsidies aimed at pass-through business flow most heavily to them.[54]
Under the Tax Cuts and Jobs Act of 2017 (TCJA), the federal government now gives pass-through business owners a 20 percent deduction for “qualified business income.”[55] Fortunately, most states with broad-based personal income taxes have chosen to eschew the federal government’s policy of offering this kind of special treatment to pass-through business owners and instead tax profits from those businesses in the same manner as salaries or wages.
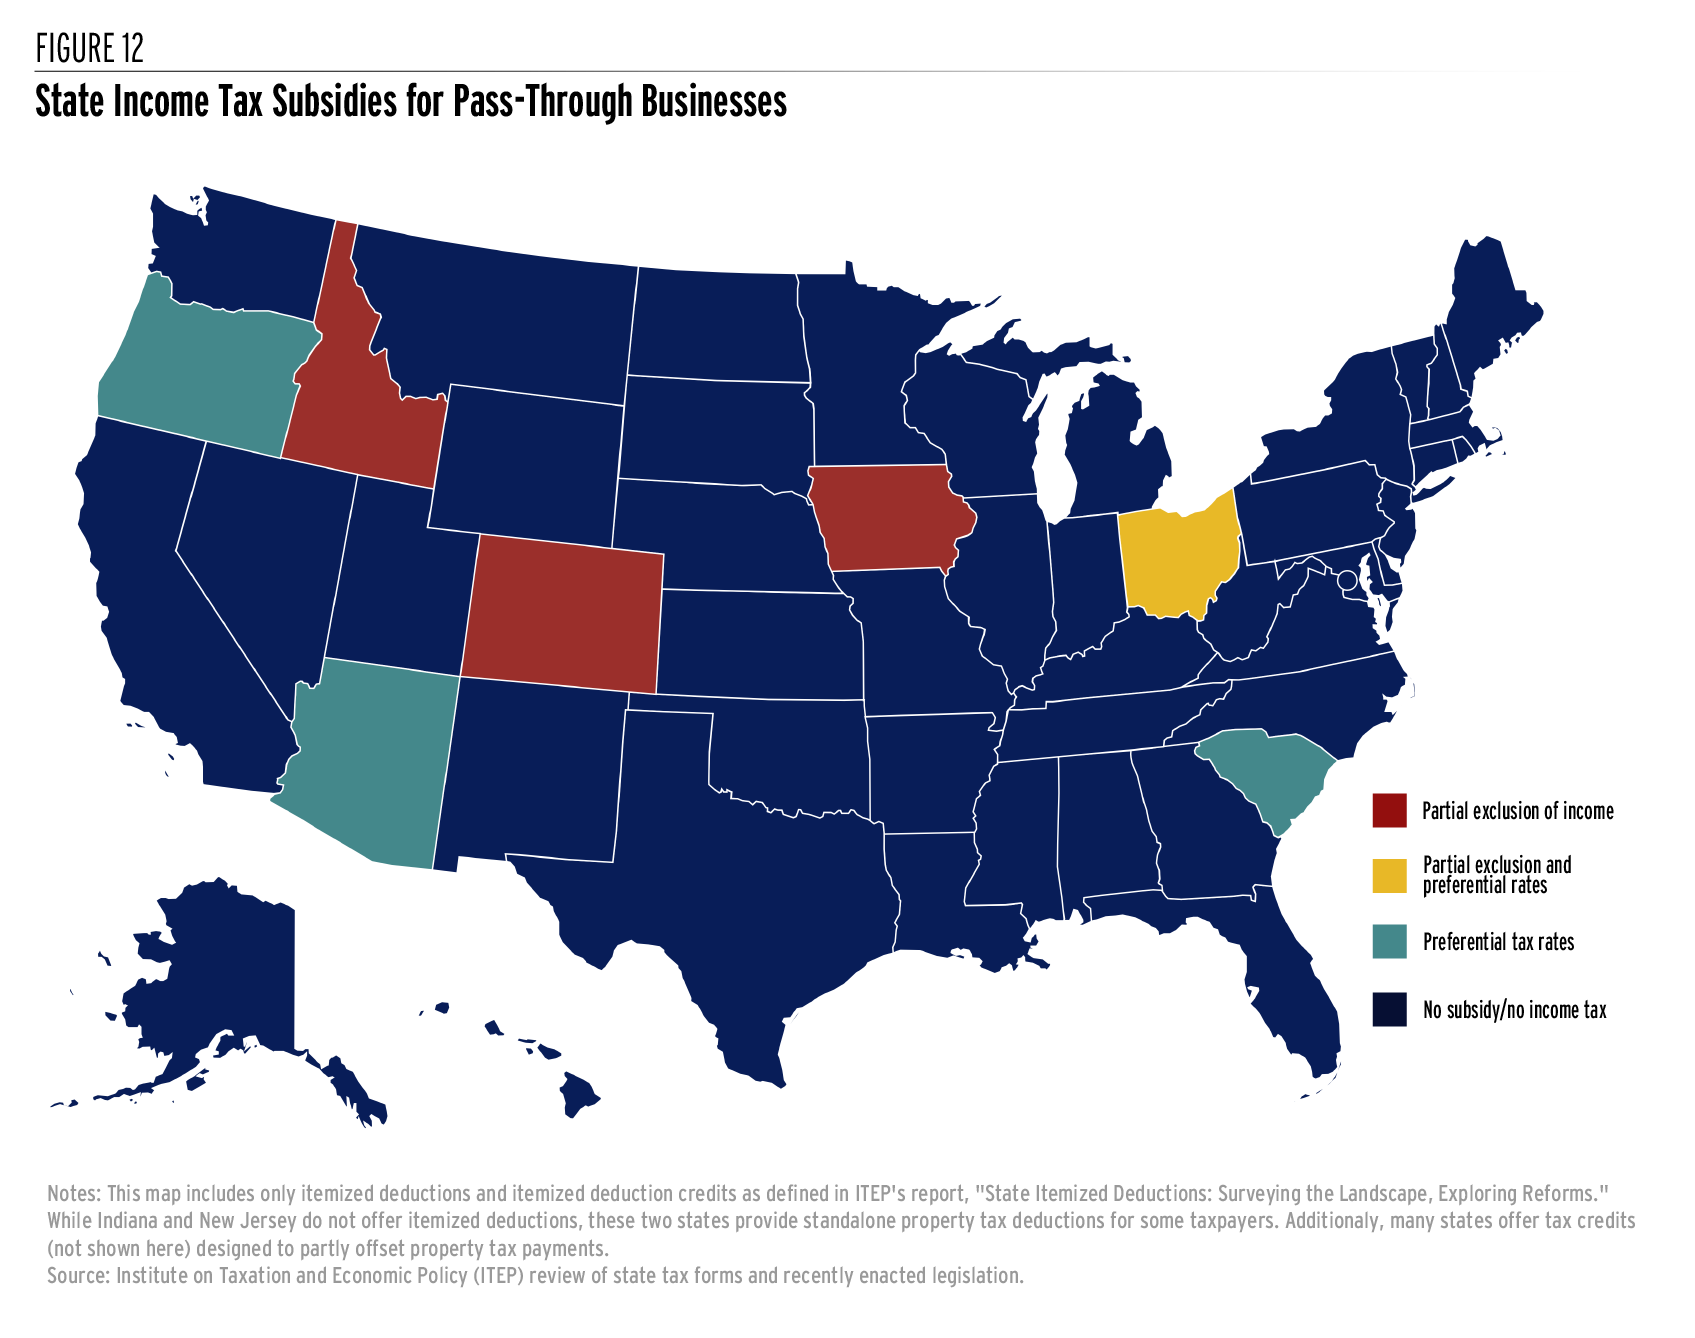
But seven states offer a tax subsidy to pass-through business owners in the form of a partial exclusion from income, a special set of lower tax rates, or in the case of Ohio, both policies. These regressive tax subsidies, which primarily benefit higher-income and higher- wealth business owners who are more likely to be white, needlessly exacerbate the racial wealth gap and should be repealed. Colorado recently took a step in this direction by eliminating its deduction for single individuals with income over $500,000 and for married couples with income over $1 million.[56]
Eliminate or Restructure Retirement Tax Preferences
Most states with income taxes offer tax preferences – often several different kinds – to elderly people that are unavailable to the broader public. These can take the form of flat dollar deductions for people above a certain age or exemptions from tax for specific types of income such as Social Security or pensions. These subsidies are skewed in favor of older and more affluent white people and tend to worsen racial inequities in both income and wealth.
There are at least three ways in which state tax subsidies for seniors are tilted in favor of white families. First, white individuals are more likely to be retired or approaching retirement age. Second, centuries of racism and discrimination have given white families retirement savings and incomes far beyond those of people of color. And third, the structure of many state tax subsidies afford larger tax cuts to higher-income seniors, who are more likely to be white.
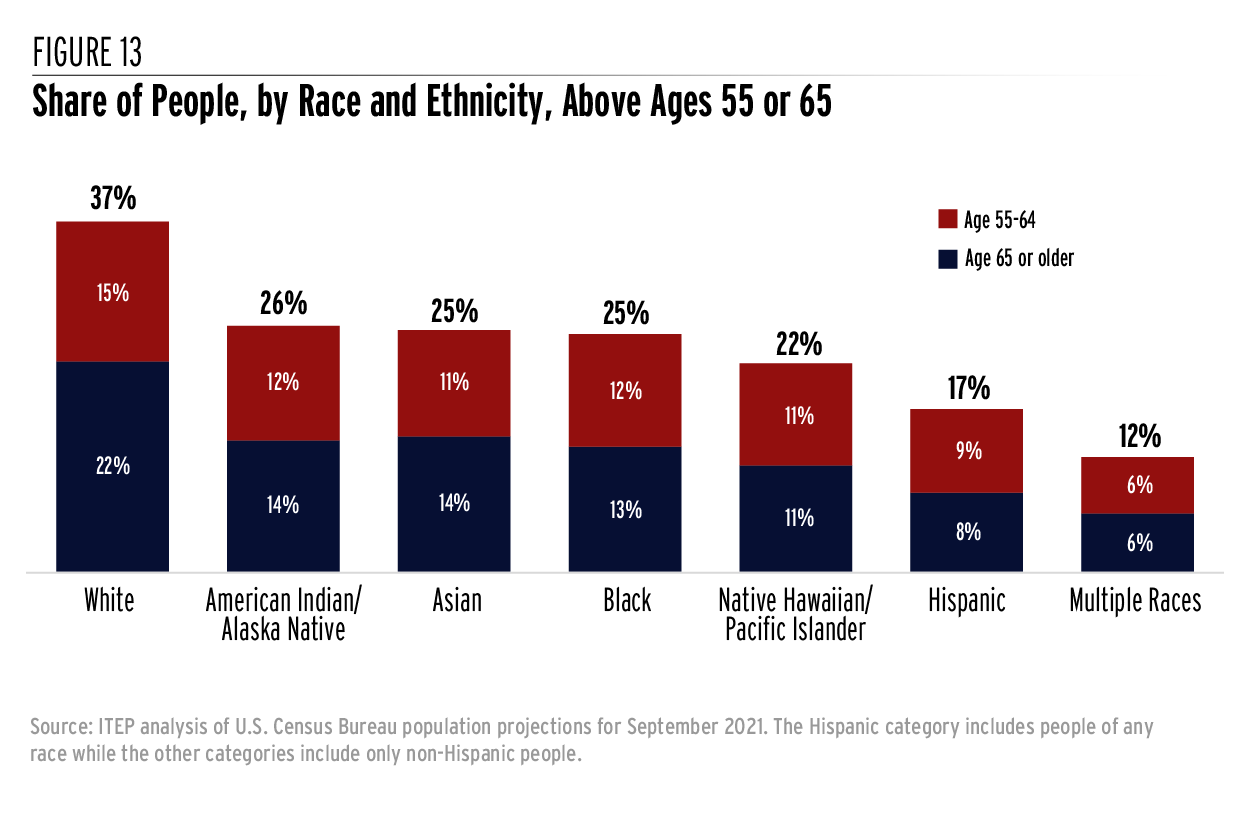
Figure 13 shows that more than one in five (22 percent) white individuals are age 65 or older compared to 14 percent or less for every other major race or ethnicity group. For instance, just 14 percent of Indigenous people, 13 percent of Black people, and 8 percent of Hispanic people are age 65 or older. There are several reasons for this, including the fact that white people have longer life expectancy as a result of more comfortable economic circumstances and access to higher quality health care. Black Americans, in particular, face an average life expectancy roughly 3.6 years shorter than white Americans.[57]
Immigration trends also contribute to these demographic patterns. Past racial quotas in immigration kept Hispanic and Asian immigrants out of the United States. As those policies have improved, younger Hispanic and Asian immigrants have arrived, making the younger population more racially and ethnically diverse than the older population.[58]
This demographic reality will not fundamentally change in the near future, as the next cohort of soon-to-be-seniors (people ages 55-64) is also disproportionately white. This age group includes 15 percent of white people, 12 percent of American Indian and Black people, and 8 percent of Hispanic people.
An outsized share of retirement income is guaranteed to flow to white households based on the simple fact that white households are more likely to be of retirement age. But this is far from the full story.
Long-running racism and discrimination in the labor and housing markets, and in society broadly, have led to drastic differences in income and wealth among older Americans of different races and ethnicities.[59] White families are more likely to have retirement accounts through their work, for instance, and tend to have better-funded accounts because of the higher pay they received throughout their careers.[60] Moreover, a disproportionate share of workers of color are employed in physically demanding jobs that are difficult to perform at older ages, forcing them to retire earlier, sacrificing both earnings and retirement savings in the process.[61]

Many Hispanic households, a larger share of whom are foreign-born or second-generation families, also face barriers related to their status as more recent arrivals in this country. Immigrants may arrive in the United States with less wealth and lower education levels, have educational credentials that are not recognized in the U.S. labor market, or face language barriers that funnel them into lower-paying occupations with fewer opportunities to save for retirement.[62]
A disproportionate share of retirement income tax breaks flow to white families because a disproportionate share of retirement income flows to those families. When states provide tax subsidies for retirees, the younger and more diverse working population ultimately must pay a larger share of overall state income taxes.
The typical white household approaching retirement has more than twice the retirement wealth of the typical Black or Hispanic household when taking the present value of expected Social Security income into consideration.[63] This disparity is even more pronounced when Social Security income is excluded. When approaching retirement, white households have five times more non-Social Security retirement wealth ($176,900) than Hispanic households ($35,000) and seven times more than Black households ($24,300).
Making matters worse, the types of tax subsidies that states often provide to seniors are skewed toward higher-income families. Federal law already exempts Social Security income from tax for low-income families, and it exempts a sizeable share of this income for moderate income families as well. This is a reasonably well-targeted policy that aids older people on fixed incomes who may struggle to cover rising expenses. But the federal policy also includes an unnecessary exemption of 15 percent of Social Security income even for high-income earners and the handful of states that base their tax treatment of Social Security on federal rules also offer this partial exemption to top earners. A larger group of states goes further than the federal government in this regard and offers a blanket exemption for all Social Security income—a policy that disproportionately benefits seniors with higher incomes relative to the more targeted tax subsidy in place at the federal level.
On top of that, many states offer significant tax subsidies for pension or other retirement income that disproportionately flow to older white people who, due partly to rampant discrimination in the labor market, were able to secure higher-paying jobs with more generous benefit packages. Tax subsidies for pensions and individual retirement account income are likely to be even more skewed in favor of white households than tax subsidies afforded to Social Security.
And because state retirement tax preferences typically take the form of exemptions or deductions, the state tax savings per dollar deducted is often higher for white families who have higher incomes overall and therefore tend to be in higher tax brackets. A high-income family in a state’s 7 percent tax bracket, for instance, saves 7 cents for every dollar of retirement income they deduct while a family of more modest means in a 4 percent tax bracket only saves 4 cents per dollar of deductible retirement income.
State lawmakers concerned about the financial well-being of lower-income seniors should look past sweeping income tax deductions for entire categories of income (e.g., pensions, investment income, or even Social Security), and instead toward measures that specifically benefit those seniors in vulnerable financial situations. This is key in advancing racial equity. The poverty rate among seniors is more than double for Black (19 percent) and Hispanic (19.5 percent) households relative to white households (7 percent).[64] Unfortunately, these vulnerable seniors are typically not the demographic that benefits most from the highly costly exemptions for retirement income currently on the books in many states.
Eliminate or Restructure Homeownership Subsidies
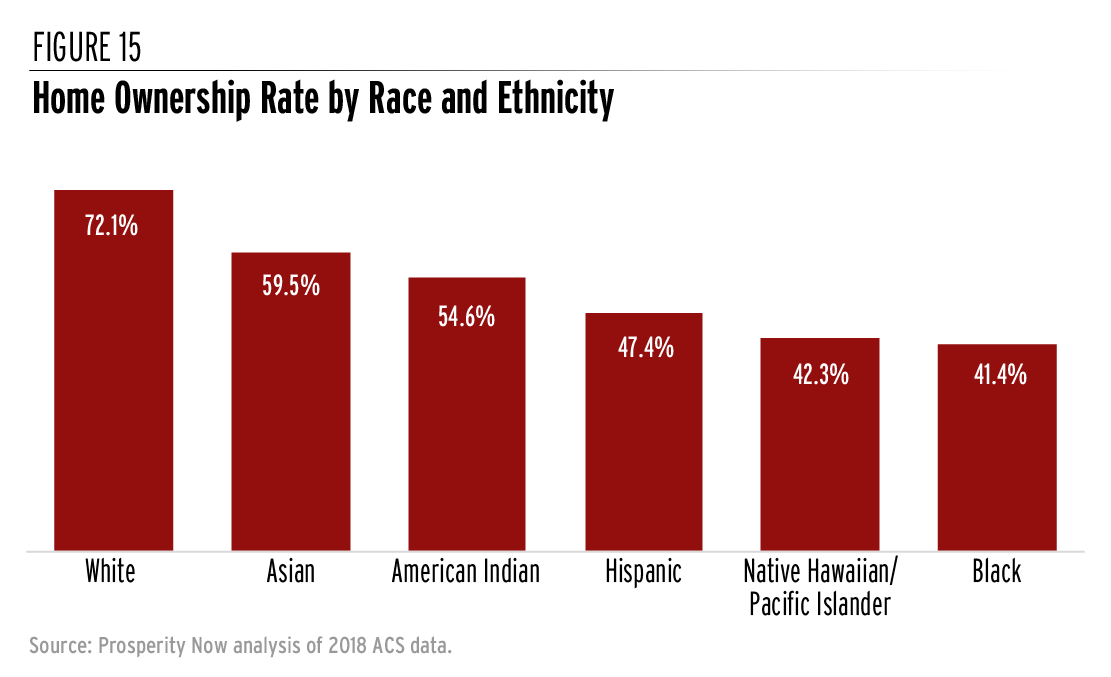
Vast differences in intergenerational wealth and a long history of racist housing policy have allowed white households to achieve homeownership rates far beyond those in communities of color. Almost three-fourths (72 percent) of white households own their homes compared to 60 percent of Asian households, 55 percent of American Indian households, 47 percent of Hispanic households, 42 percent of Native Hawaiian and other Pacific Islander households, and 41 percent of Black households.[65]
A major, concerted policy effort is needed to remedy these inequities. Existing state income tax preferences for homeowners are not well suited to this task. Given their untargeted nature, state income tax provisions benefiting homeowners are far more likely to reward existing homeowners than to enable more families to become homeowners for the first time. In other words, they subsidize homeownership without incentivizing it.
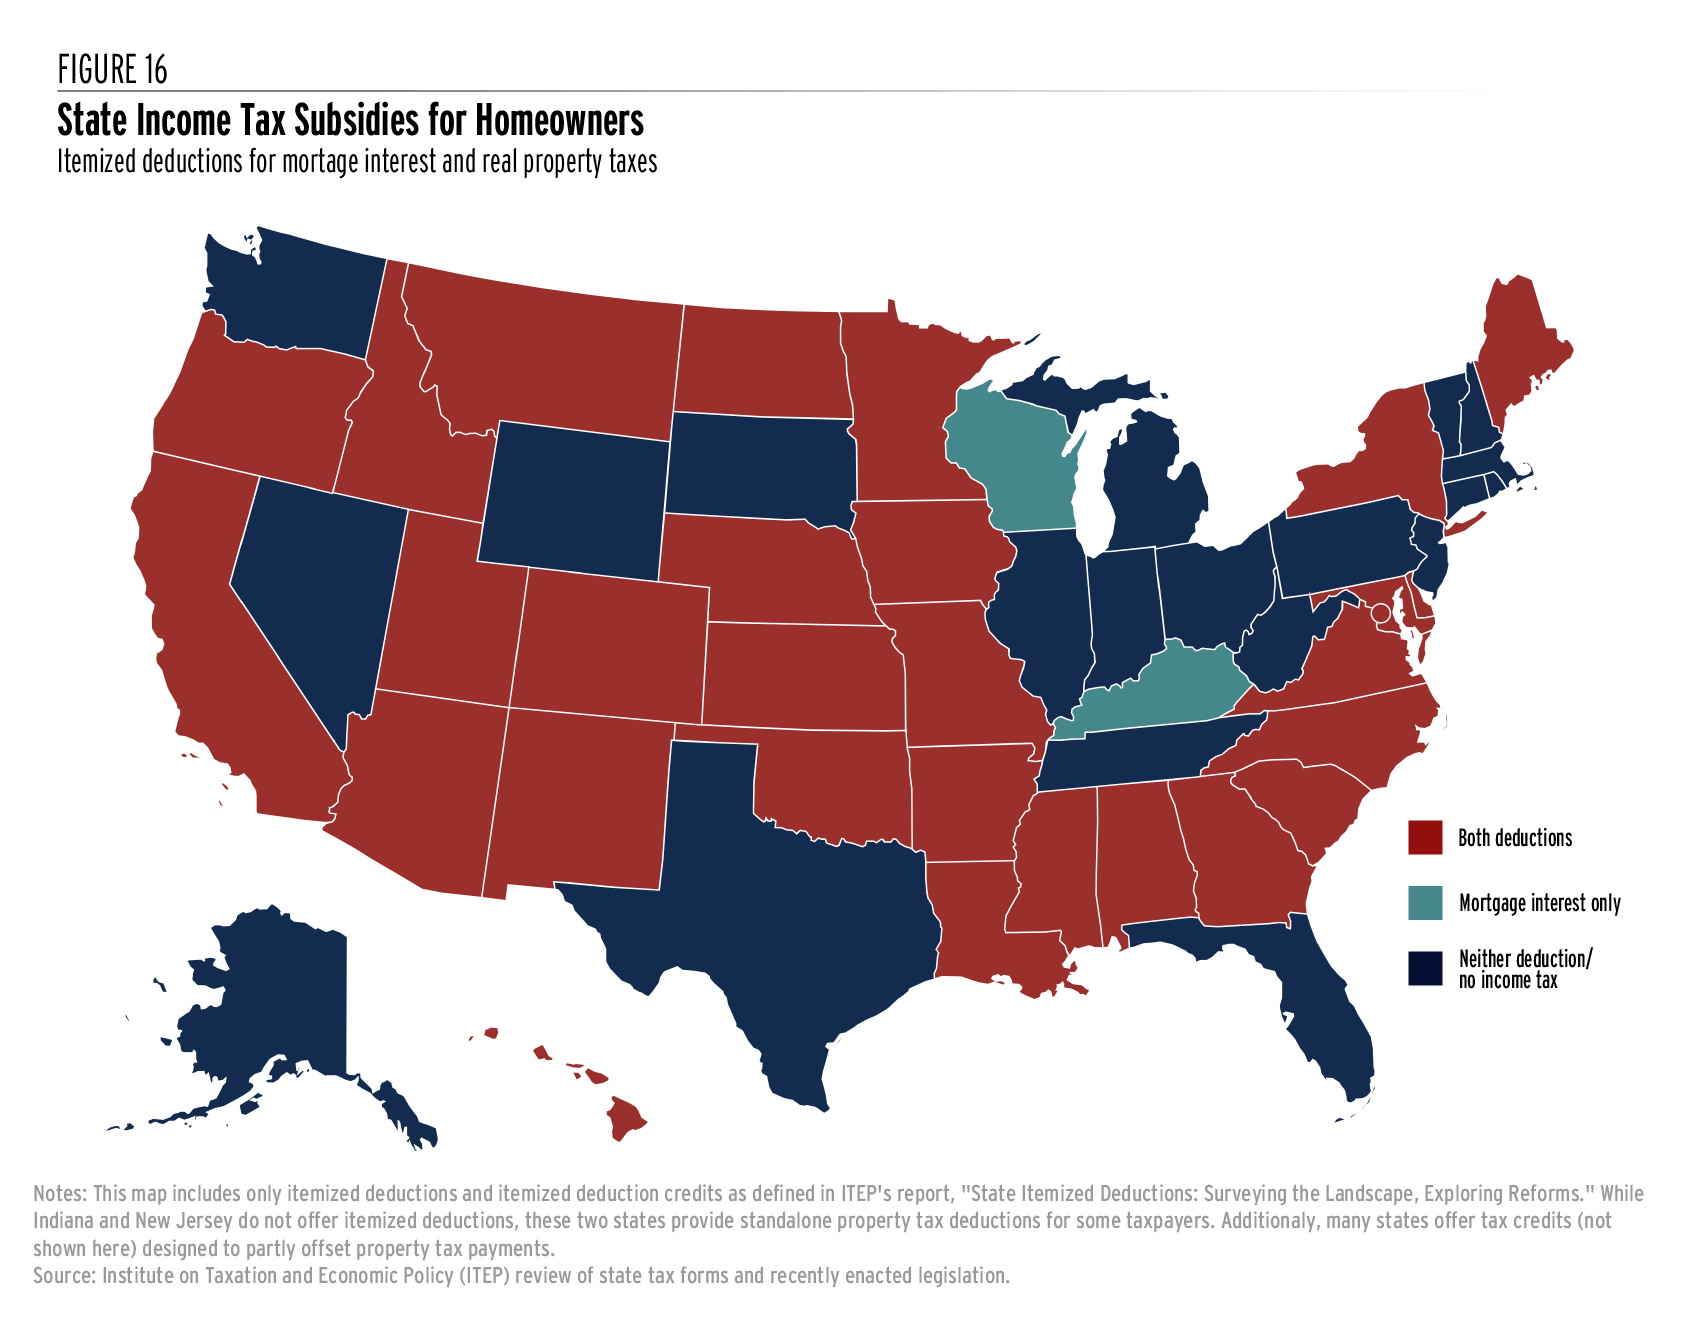
The two most common state income tax subsidies for homeowners are the itemized deductions for mortgage interest (offered in 30 states) and real estate property taxes (offered in 28 states). These deductions are of no help to most families because state law requires families to have total itemizable expenses exceeding a certain amount before they can begin to derive any benefit from these two deductions (that is, they must have itemizable expenses exceeding the standard deduction). In states conforming to the federal standard deduction, for instance, mortgage interest, property taxes, charitable gifts, and certain other expenses must exceed $12,550 for singles or $25,100 for married couples before even a single dollar of tax savings can be gained from deducting mortgage interest and property taxes.[66] Most families’ household budgets do not allow for this level of spending, especially among people of color who tend to have lower incomes.
In general, state income tax deductions are a weak tool for shaping behavior because the tax savings per dollar of deduction tends to be quite low. Moreover, the tax cuts created through deductions tend to increase with income, affording the largest benefits to upper-income families in higher state tax brackets who are least in need of assistance.
When a taxpayer deducts one dollar of mortgage interest, for example, that dollar is exempt from tax and the resulting tax savings depend on the tax rate that dollar would have faced. An upper-income taxpayer facing a 7 percent marginal state tax rate, for example, will avoid having to pay 7 cents in tax on that dollar.[67] A taxpayer with a lower income facing a 4 percent marginal tax rate, by contrast, will avoid just 4 cents in tax from the same dollar of deduction. In either case, only a small fraction of each dollar deducted is recouped through tax cuts.
A family buying a $300,000 home and facing a 7 percent state income tax rate, for example, would likely save no more than $63 per month during their first year of homeownership from a state mortgage interest deduction—an amount that will rarely be enough to tip the scales in favor of owning instead of renting. In reality, the savings could be significantly lower than this amount even in the first year for a middle-income family and will decline over time as the interest is paid off.[68]
Both the mortgage interest and property tax deductions are skewed in favor of wealthier communities that need it the least. Communities with higher incomes and property values have more residents able to take advantage of these deductions. Given the realities of state-sponsored residential segregation, affluent households able to claim these deductions tend to be concentrated in certain areas and tend to be majority white. Communities where more residents have moderate incomes, including many communities where people of color are concentrated, see more of their residents claim standard deductions instead.
One rationale sometimes advanced in favor of state deductions for local property tax payments is that the deductions make it easier for localities to raise revenue. By allowing taxpayers to write off their local property taxes on their state tax forms, the state government is effectively paying a portion of each itemizer’s local property tax bill. But one of the most important goals of state fiscal aid to localities should be ensuring that even communities with sparse resources are able to provide a high-quality education to local children. Real property tax deductions do the opposite by steering dollars into the areas that need them least.
State governments have a legitimate interest in promoting local fiscal capacity and in enabling their residents—particularly those from historically marginalized communities—to build wealth. But the regressive income tax deductions for mortgage interest and property taxes that states frequently employ are ineffective at advancing these goals and should be repealed.
Looking Beyond the Personal Income TaxPersonal income taxes are the most significant progressive tax revenue source used by state governments, accounting for 38 percent of state tax revenue raised in 2018. Given their size and ability to be fine-tuned based on ability to pay, these taxes offer one of the most promising routes toward addressing racial income and wealth inequality through the tax code. But a comprehensive approach to racially equitable tax policy requires looking beyond the income tax, and in particular toward taxes that ask more of families with large amounts of wealth. Gaps in income across race and ethnicity are large, but gaps in wealth – which reflect the accumulation of resources over a longer period and even across generations – are even larger. Historical and ongoing racism both steer a disproportionate number of people of color into lower-paid jobs with fewer options for retirement saving and less access to other benefits. Discriminatory housing policies have denied homeownership opportunities for countless Black families. And vast differences in intergenerational wealth mean that far fewer people of color receive meaningful inheritances relative to white people. As part of remedying these inequities, states should enact or strengthen their taxes on large estates and inheritances. These taxes can play an important role in reducing the transfer of concentrated wealth from one generation to the next. Unfortunately, recent changes in law have weakened the federal estate tax significantly and led to the outright repeal of many state estate taxes. Addressing racial equity through the tax code requires reversing these trends. States should also consider enacting statewide property taxes specifically on high-value homes, sometimes referred to as mansion taxes. White families own an outsized share of real property wealth in this country and such a tax could begin to level that playing field somewhat. Putting those revenues toward equalizing education funding in poorer communities with low property wealth, could further improve racial equity. Finally, corporate income tax rate increases or base broadening would primarily affect wealthy people who own corporate stock. According to the Federal Reserve, 89.5 percent of corporate equities and mutual fund shares are owned by white households. That stands in sharp contrast to the 1.1 percent held by Black households and the 0.5 percent owned by Hispanic households.[69] Every state and local revenue system includes a blend of different taxes that work together to raise the revenue needed to fund public investments. The key to raising revenue in an equitable fashion is to avoid an over-reliance on regressive sales taxes, fines, and fees that tend to ask the most of low- and middle-income families and that worsen racial disparities.[70] Instead, states should make sure that their blend includes a heavy emphasis on progressive taxes on income and wealth, asking the most of those families most able to pay and narrowing racial and economic inequities in the process. |
Lift Up Renters with Tax Credits
Discrimination in housing policies and the mortgage lending industry, together with the broader racial wealth gap, have locked countless people of color out of the benefits of homeownership. As a result, a disproportionate share of renters are people of color, many of whom are confronting high and rapidly growing rent bills.
Current state, local, and federal tax laws steer more subsidies to homeowners than renters. Reforming this imbalance can advance racial equity and bolster the economic security of renters. States have powerful, anti-racist tax policy options for targeting assistance to renters struggling under the weight of high housing costs.
Enacting robust “circuit breaker” credits or expanding existing credits to include renters within their scope represents one worthwhile reform. Although they are typically administered through the income tax system, circuit breaker credits are designed to prevent a property tax “overload” in cases where property tax payments become unacceptably high relative to a household’s income.[71] (States do not need to have a personal income tax on the books in order to administer these programs—they can be provided as standalone rebates even in states without income taxes.)
While renters do not pay property taxes directly, they do pay the tax indirectly as landlords pass some of the cost along to their tenants.[72] Most states with circuit breakers acknowledge this fact by allowing renters to assume that a certain share of their rent (often 20 percent) is an indirect property tax payment and affording a tax credit based on that estimated property tax payment amount. Figure 17 provides an example of how this policy works in Minnesota.
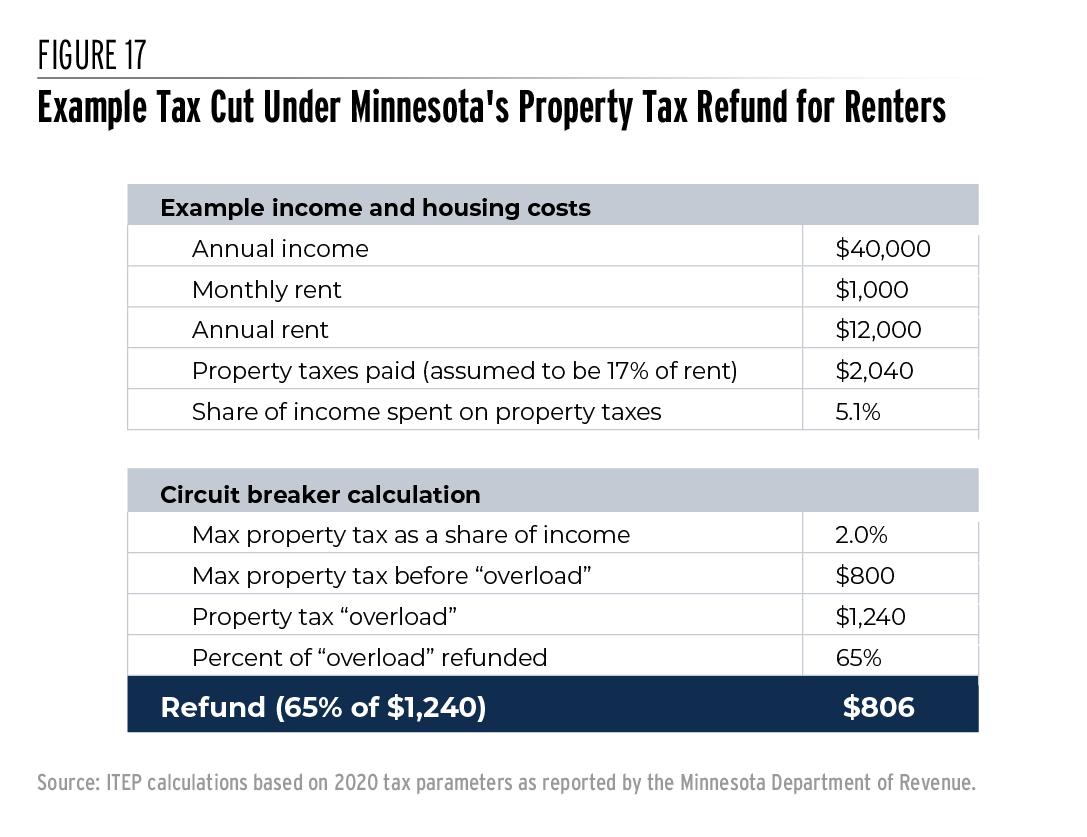
Minnesota’s circuit breaker program assumes that 17 percent of rent payments go to covering property tax liability—a figure roughly in line with estimates by the state’s department of revenue.[73] Based on this assumption, a family paying $12,000 in rent per year (or $1,000 per month) is assumed to pay $2,040 in property taxes. That amounts to 5.1 percent of income for a family earning $40,000.
Under the Minnesota circuit breaker program, a tax of this magnitude warrants a partial refund of property taxes paid. In 2020, renters with incomes up to $62,960 are eligible for the refund. For a family earning $40,000, the program considers any property tax above 2 percent of income to be an “overload” and refunds a portion (65 percent) of the overload amount. (These two percent and 65 percent parameters vary by income level). For this taxpayer, the result is a refund of $806, or nearly 40 percent of the initial $2,040 in property taxes paid.
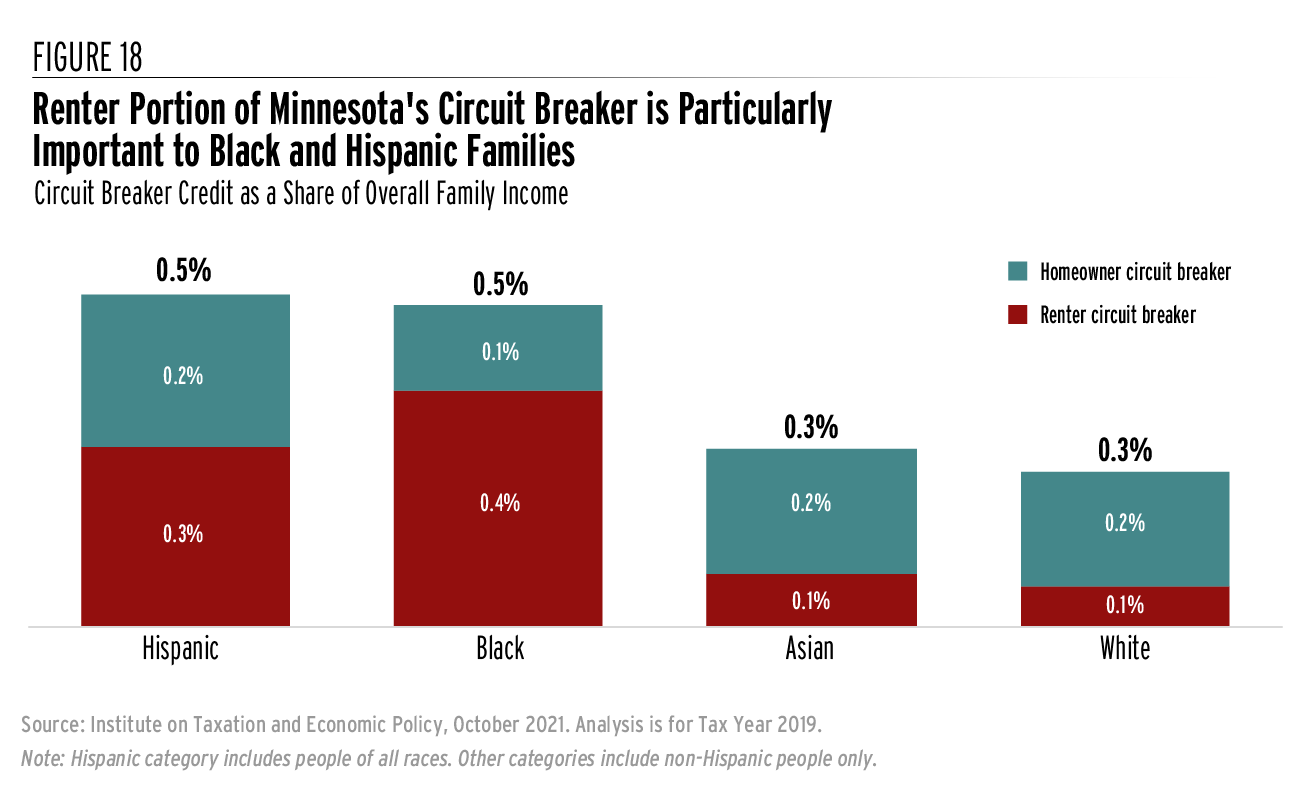
The Minnesota program includes both homeowners and renters within its scope, although homeowners can qualify at much higher income levels than renters. Using the ITEP model, we find that the program is particularly beneficial to Hispanic and Black families, and that the renter portion of the credit in especially important to those families. Figure 18 shows that the renter portion of Minnesota’s circuit breaker program lifts overall family income by 0.4 percent for Black households, 0.3 percent for Hispanic households, and 0.1 percent for white and Asian households.[74] Those figures are equivalent to a $234 average tax cut for Black families, $178 for Hispanic families, $88 for Asian families, and $70 for white families. To be clear, these are statewide averages including both eligible and non-eligible households. For benefiting households, the average income boost is much larger than these amounts.
The higher income boost to Black and Hispanic households reflects the substantially lower average incomes for these families, and the fact that they are more likely to be renters. In other words, while Minnesota’s renter circuit breaker advances the economic security of a diverse group of low- and moderate-income families of many different races or ethnicities, it tends to be particularly powerful for Black and Hispanic people who are confronting economic hardship created by systemic racism.
Former Senator and now Vice President Kamala Harris proposed a broad federal renter tax credit with similarities to the circuit breaker programs that are already common in the states.[75] Under her proposal, lower- and middle-income renters would receive tax credits calculated based on the relationship between rent and income, much like how circuit breakers look at the relationship between property tax and income.
Under this proposal, families earning less than $25,000 would see any rent paid above 30 percent of their income reimbursed through a federal tax credit. Moderate income families earning between $25,000 and $50,000 would receive a partial reimbursement (75 percent) for rent above 30 percent of their income. And the reimbursement rate would continue falling from there before phasing out entirely for six-figure earners.
Figure 19 illustrates the similarities between circuit breaker credits for renters (tied to property taxes paid) and renter tax credits (tied directly to rent) with an example family spending 40 percent of their income on rent. Under the circuit breaker, the “overload” amount is calculated as a portion of property taxes paid: in this example, the family receives a rebate equal to 6 percent of income, or the amount by which their property tax bill surpasses 2 percent of income. Under the renter tax credit, the “overload” amount is calculated as a portion of rent paid: in this example, the family receives a rebate equal to 10 percent of income, or the amount by which their total rent exceeds 30 percent of income.
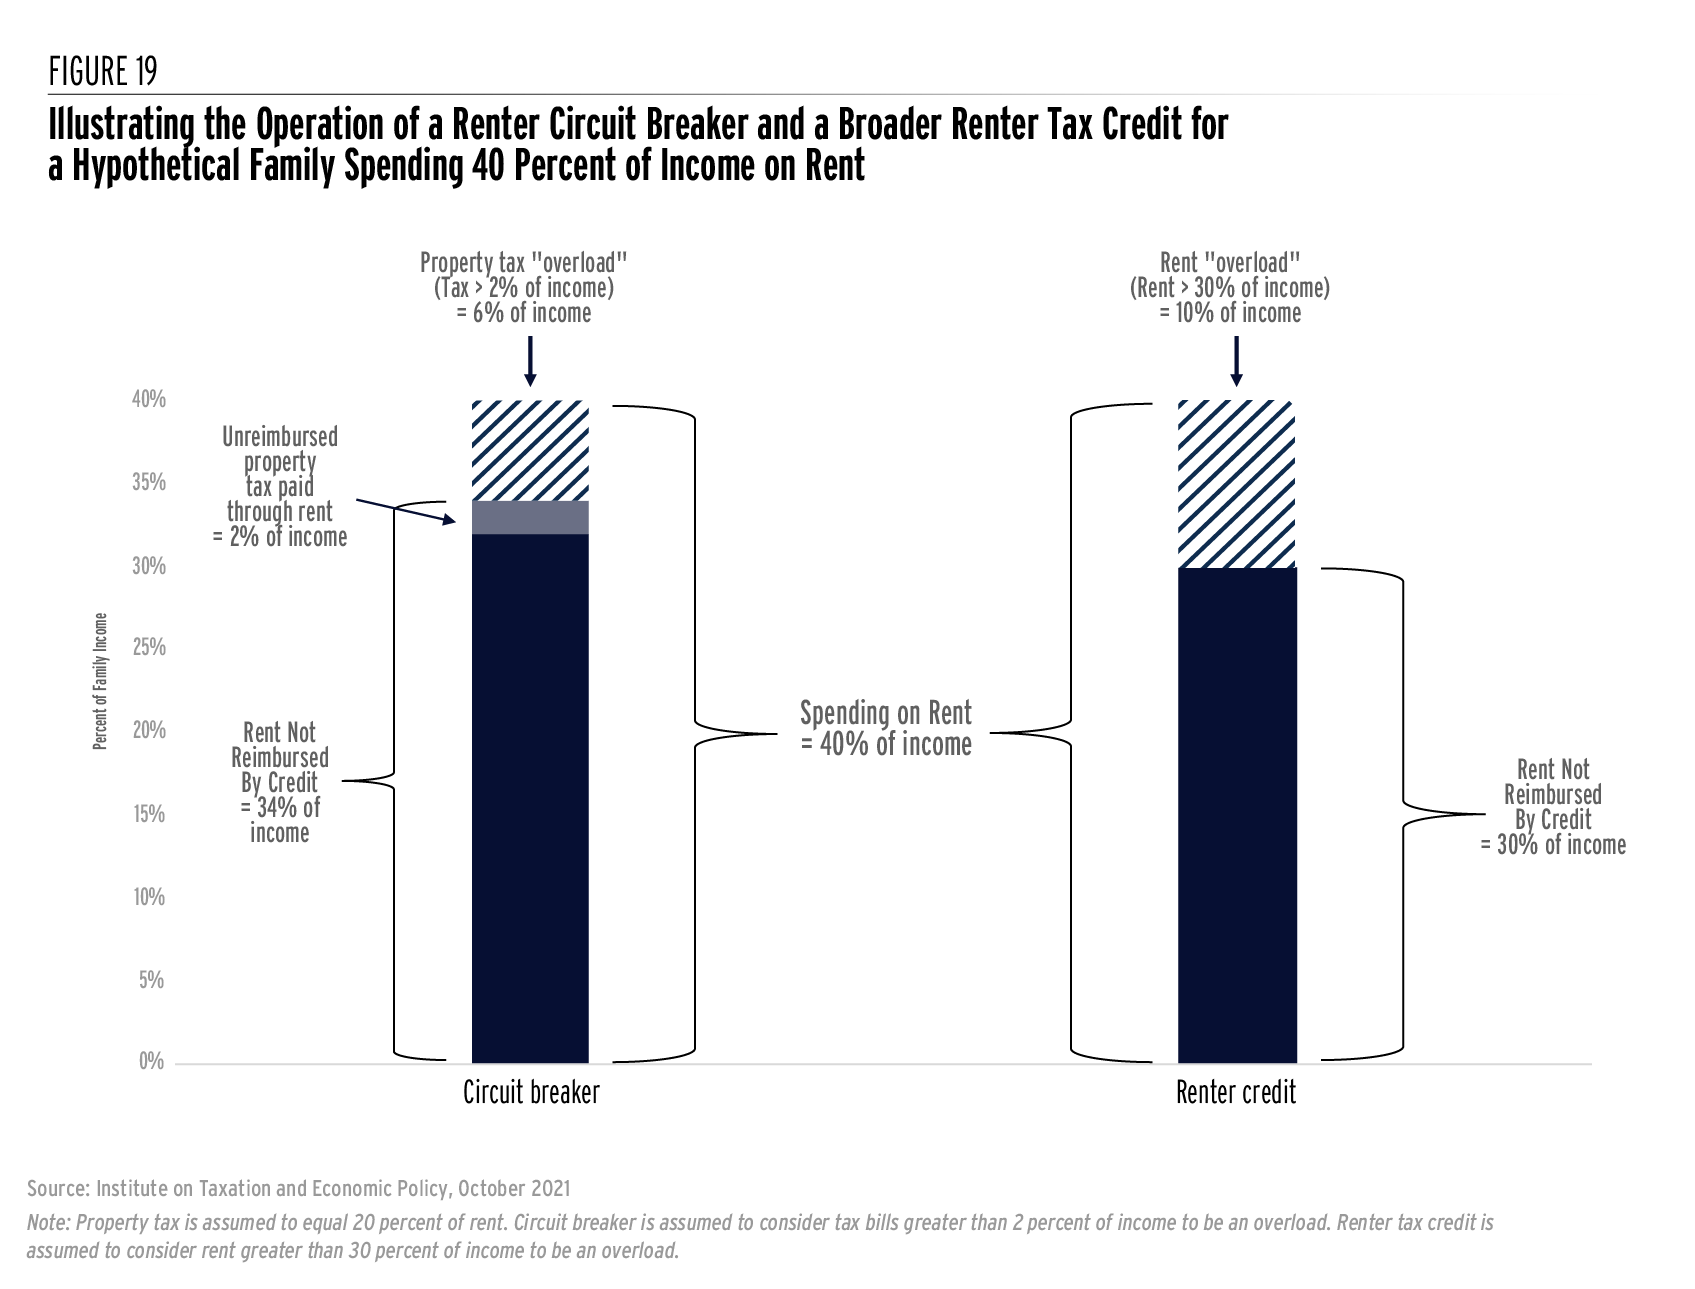
In these two examples, the renter tax credit provides a larger rebate because it is calculated in direct proportion to rent paid rather than in proportion to the smaller slice of rent that constitutes property taxes. In practice, it is possible for circuit breaker credits to be equal to, or larger than, renter tax credits depending on the levels chosen for key parameters.
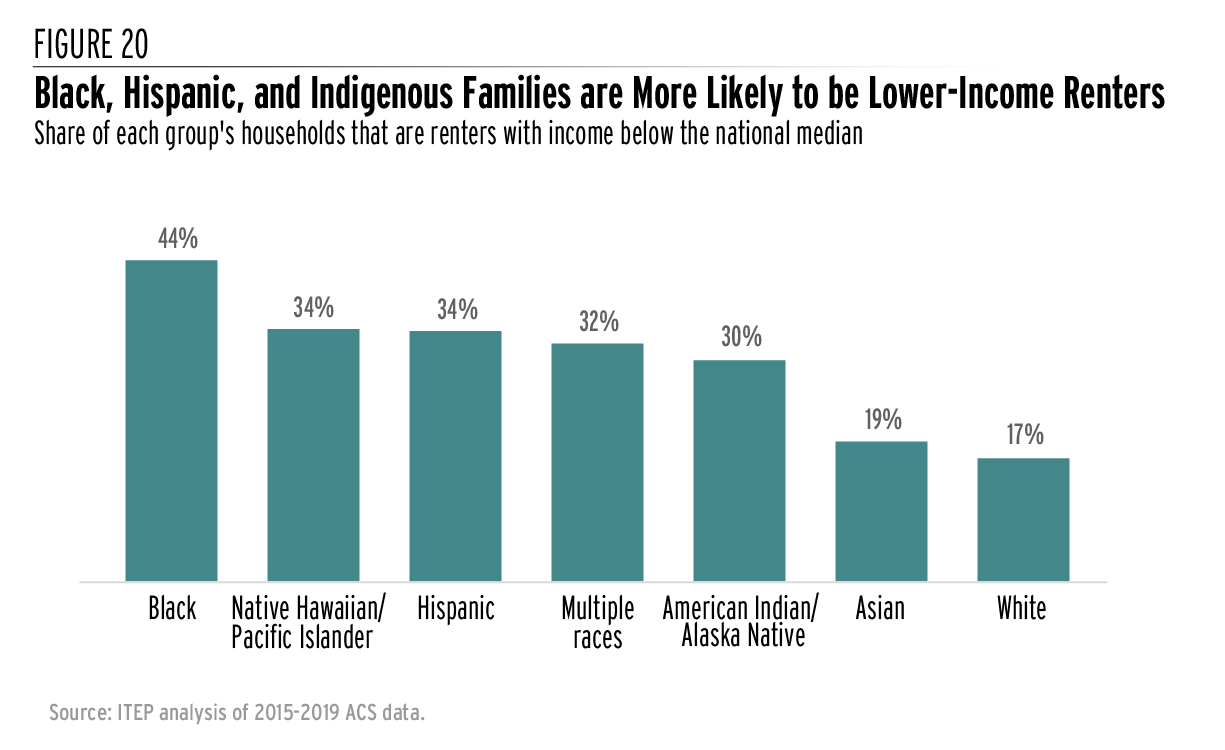
Tax credits for renters could be implemented at the federal and state levels and offer a promising way to help lower-income renters, a disproportionate share of whom are people of color. Our analysis of American Community Survey (ACS) data in Figure 20 reveals that more than four in ten (44 percent) of Black households are renters with incomes below the national median income. The same is true for 34 percent of Hispanic, Native Hawaiian, and other Pacific Islander families, 32 percent of families headed by multiracial individuals, 30 percent of Indigenous families, 19 percent of Asian families, and 17 percent of white families. A tax credit tailored toward lower-income renters is therefore an effective way of reaching a significant share of Black, Indigenous, and Hispanic families.
Currently, 22 states have income-based credits for renters designed to offset a portion of property taxes paid, though many of those are limited to elderly renters only.[76] Strengthening these credits and expanding them to include renters of all ages offers a promising avenue for addressing racial disparities and are an important complement to tax credits based primarily on income such as Earned Income Tax Credits (EITC).
It is relatively easy for states to target assistance toward low-income households because annual income is reported on both federal and state tax returns. But given the severity of the racial wealth gap, addressing racial economic disparities will require tailoring benefits based not only on income, but on wealth as well.
Unfortunately, tailoring tax benefits to low-wealth households brings administrative complexity because the amount of overall wealth held by individual households is not measured as part of any existing state or federal tax law. Conditioning a tax benefit on renter status offers one promising approach for tailoring the benefit toward lower-wealth households without having to undertake the difficult task of precisely measuring every household’s overall wealth holdings.
In 2019, the median renter had a net worth of just $6,300 while the median homeowner’s net worth was more than 40 times larger, at $255,000.[77] A tax benefit tailored toward renters with lower incomes is likely to reach a large share of low-wealth households in an administratively straightforward fashion.
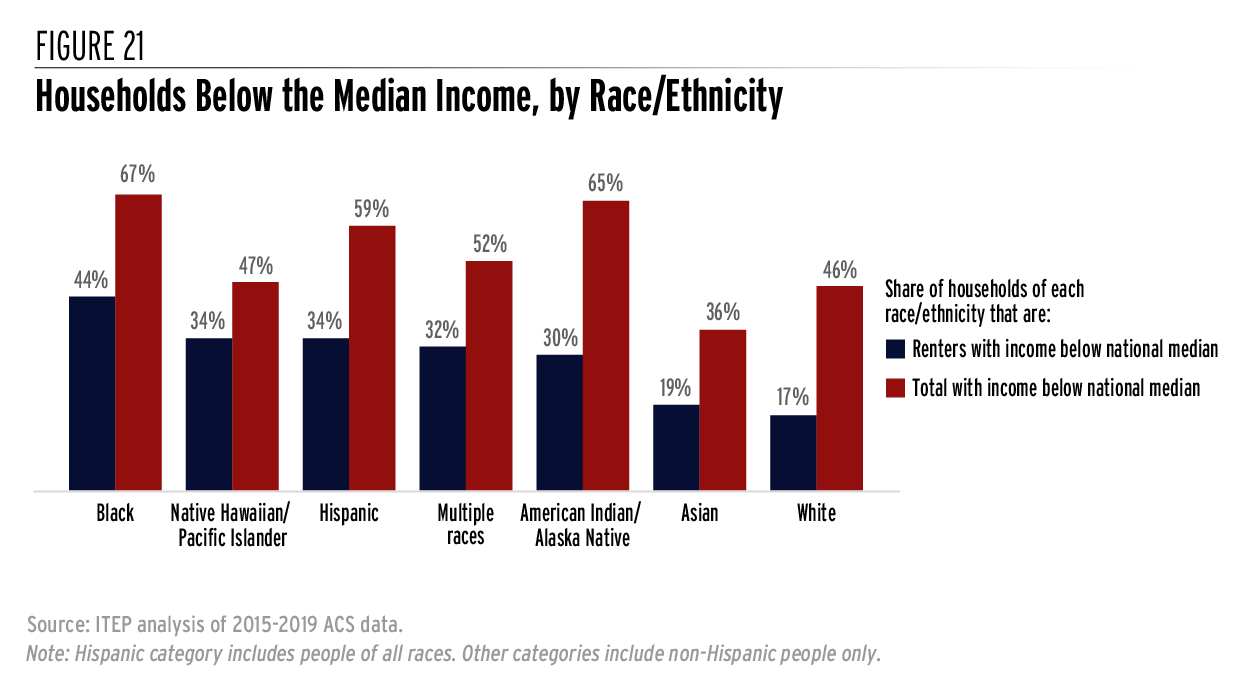
Such a policy would be particularly important in bolstering the economic security of Black, Hispanic, and Indigenous households with lower levels of income and wealth. The data in Figure 21 help to illustrate this point.
Looking solely at income in Figure 21, for example, shows that Black households are 1.5 times as likely as white households to have incomes below the national median. That is, 67 percent of Black households have below-median incomes compared to 46 percent of white households.
But when we broaden the comparison to simultaneously consider both income and homeownership, the disparity widens significantly. Specifically, Black households are 2.6 times as likely as white households to be renters with income below the median level. In other words, more than four in ten (44 percent) of Black households not only have income below the median level, but also rent rather than own their homes. The same is true of just 17 percent of white households.
This comparison suggests that a tax credit targeted to low-income renters will be efficient in reaching historically marginalized communities and is an important policy for states to enact in addition to tax benefits made available to all low-income individuals. It is important, however, that states also devote meaningful resources to ensuring that all families, including those who may not need to file income tax returns, are aware of these credits and able to claim them in a free and straightforward manner.
By looking beyond annual income and bringing in an additional indicator of financial wellbeing such as renter status, tax credits for renters offer a particularly effective means of reaching those families in the most economically disadvantaged positions.
Improve Child Well-Being with Tax Credits
The hardship, uncertainty, and stress that comes with financial insecurity can take a toll on growing children. Fortunately, tax credits offer a valuable means of bolstering the economic security of families with children and better positioning those children for success.[78] For example, tax credits have been shown to improve nutrition and academic outcomes for children in families with lower incomes.[79] These types of policies can be particularly beneficial for Black, Hispanic, Indigenous, and other children of color whose families are confronting racism and discrimination and are therefore disproportionately likely to have lower incomes.[80] These policies also benefit society broadly by boosting future workers’ earnings and productivity as well as overall health and well-being.[81]
States have at least two options for using tax credits to invest in families and children: Child Tax Credits (CTC) and Child and Dependent Care Tax Credits (CDCTC).
Child Tax Credits
Child Tax Credits offer a direct reduction in tax liability for every qualifying child in the household. The federal CTC, for example, is usually available for children ages 16 and under and can be claimed, at least in part, by families with incomes up to $440,000 for married couples or $240,000 for single parents. The federal CTC is typically $2,000 per child but has been temporarily expanded, for 2021, to $3,600 for children under age 6 and $3,000 for children ages 6 and over. Children who are 17 years old are also temporarily eligible for the credit.
Roughly half a dozen states offer some type of CTC, though the credits vary significantly in their design.[82] New York’s credit, for example, is set at the greater of $100 per child or 33 percent of the federal CTC as it existed in 2017.[83]
For states considering enacting a CTC today, a better approach would be to enact a credit similar to the federal CTC as it exists in 2021. The American Rescue Plan (ARP) of 2021 temporarily made the credit far more equitable than previous versions. In addition to boosting the credit’s headline value, the ARP significantly improved the CTC by making the credit fully refundable and available to nearly all children regardless of their parents’ income. Previous limitations in federal law denied the full benefits of the credit to nearly half of all Black and Hispanic children—a reality that will resurface starting in 2022 unless federal policymakers extend the reforms.[84] Full refundability is essential under a state CTC to ensure that the credit can reach children in lower-income families who may have little state personal income tax liability against which to apply such a credit, but who tend to pay a large share of their income in sales, excise, and property taxes.[85]
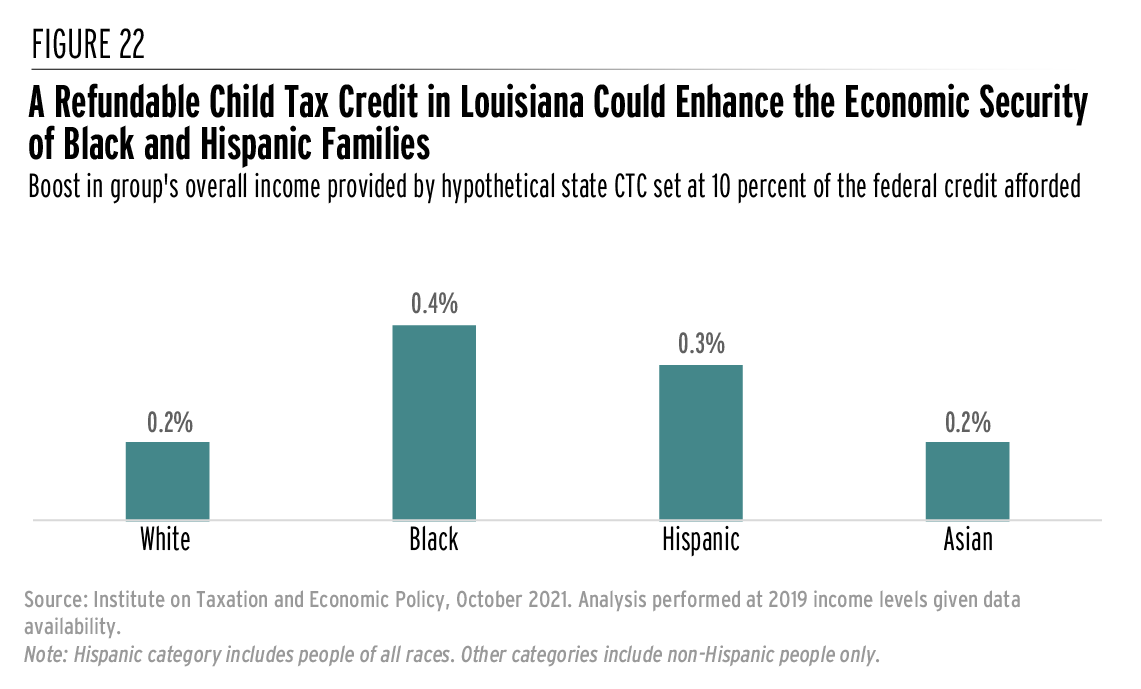
Figure 22 illustrates the potential impact of a state CTC tied to the 2021 federal design. Using Louisiana as an example and assuming a credit equal to 10 percent of the federal amount, we estimate that such a credit would boost the overall income flowing to Black families throughout the state by 0.4 percent and the overall income to Hispanic families by 0.3 percent. White and Asian families would see somewhat smaller boosts relative to income, averaging 0.2 percent.
Expressed in average dollar terms, Black families would see a $212 tax cut, Hispanic families $193, white families $151, and Asian families $146. These larger dollar amounts are driven largely by the fact that Black and Hispanic families are more likely to have incomes in the low and middle portions of the income distribution, thereby qualifying them for the full credit. To be clear, these are average figures for these groups as a whole and the tax cuts for families with children would be significantly larger: up to $360 per child under age 6 and $300 for children ages 6 and over.
Louisiana has among the worst child poverty rates in the country. In 2019, 43 percent of Black children and 33 percent of Hispanic children in Louisiana lived in poverty, compared to 15 percent of white children.[86] Nationally, the comparable figures are 31 percent for Black children, 30 percent for Indigenous children, 23 percent for Hispanic children, and 10 percent for white children.[87] A refundable Child Tax Credit would be particularly impactful for historically marginalized communities facing the highest poverty rates.
While such a credit would come at a high cost to state revenues—reducing Louisiana’s personal income tax collections by more than 10 percent in this example—the revenue-raising reforms described earlier in this report could be used to fund the credit without necessitating cuts in public funding for other priorities.
In designing state-level CTCs, lawmakers should build on the success of the federal CTC by extending their credits to immigrant children who lack a Social Security Number—a group that is likely made up mostly of Hispanic and Asian children.[88] Prior to Tax Cuts and Jobs Act of 2017 (TCJA), all children regardless of their citizenship status received the federal version of the credit as long as their parents met the income eligibility requirements. Colorado recently extended its own, state-level CTC to include children without Social Security Numbers.[89] Restoring this policy nationwide would benefit around 1 million children and their families.[90]
Child and Dependent Care Tax Credits
Child and Dependent Care Tax Credits are designed specifically to defray some of the high cost of childcare. The federal CDCTC, for example, offsets a portion of the first $3,000 spent on childcare each year (or $6,000 if the taxpayer has more than one qualifying child). That offset ranges from a potential benefit of 35 percent of childcare spending for lower-income families down to 20 percent for middle- and upper-income families. A temporary provision of federal law has increased these parameters to $4,000 in childcare expenses per child and a match of up to 50 percent of childcare spending for families earning less than $125,000.
States seeking to improve childcare affordability through their tax codes should prioritize those families in the greatest need. Among families paying for childcare, those below the poverty line devote roughly four times the share of their income to paying for childcare as other families.[91]
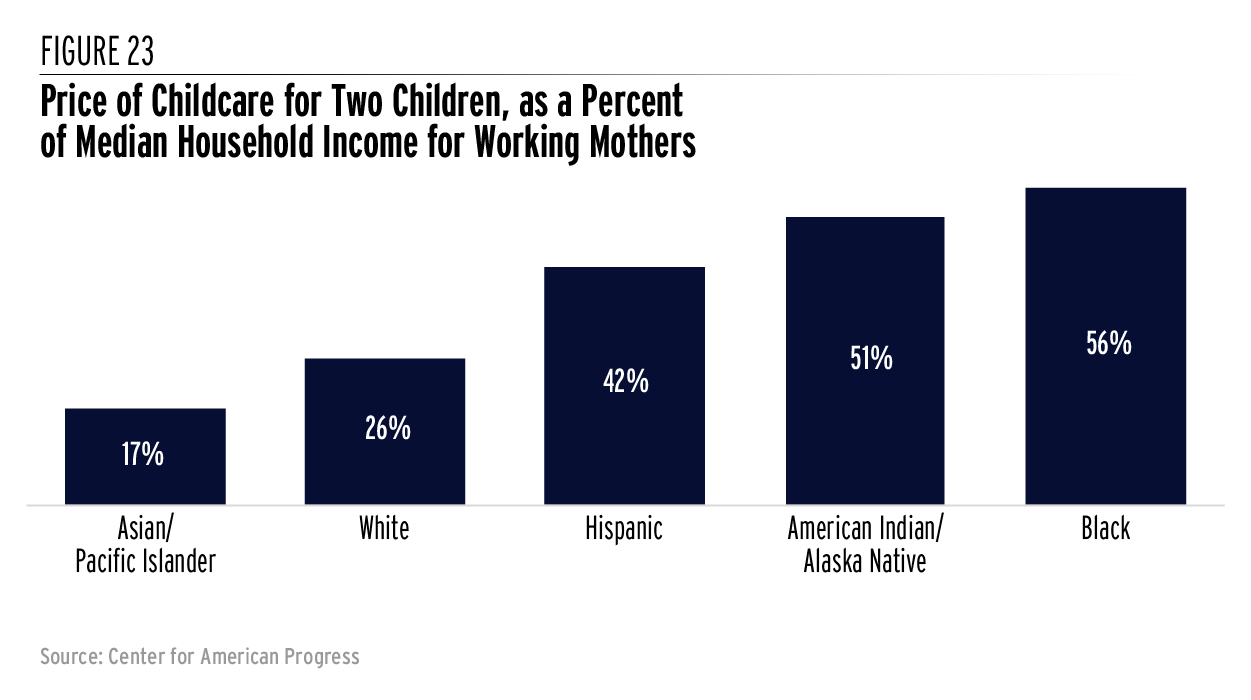
But childcare affordability is also a challenge for families above the poverty line. Among working mothers with children under age 5, the cost of childcare for two children would swallow up more than half of the household income of the median Black or Indigenous family and more than 40 percent of the median Hispanic family’s income.[92] The cost relative to income is somewhat smaller for white and Asian households but still far above the federal guidelines that define affordability as 7 percent or less of annual income.[93]
Nearly half the states offer some form of state income tax break for families with dependent care expenses.[94] A well-designed dependent care credit should be fully refundable so its benefits can reach the lowest-income families who struggle most with childcare affordability. To keep its cost down, such a credit should also gradually phase-out for higher-income families able to afford childcare on their own.
Dependent care credits will not solve the childcare affordability crisis on their own. Ultimately, providing childcare assistance through the tax code—even when fully refundable—requires families to have cash on hand to pay for childcare services outright before being reimbursed, an obstacle to many working families with limited financial resources. But a well-designed credit can help as part of a broader strategy to improve affordability, and it can be particularly meaningful for the people of color who often find childcare least affordable.
Support Workers with the Earned Income Tax Credit
The Earned Income Tax Credit (EITC) can bolster the incomes of low-wage workers, helping families move closer to meaningful economic security. The federal EITC has kept millions of Americans out of poverty since its enactment in the mid-1970s. Over the past several decades, the effectiveness of the EITC has improved through various expansions to the federal credit, and by the actions of most states, which have chosen to enact or expand their own credits. Nearly two-thirds of states (30 states plus the District of Columbia) now offer Earned Income Tax Credits.
Discrimination in the labor market, inequitable educational systems, over-policing, and countless other manifestations of systemic racism have resulted in an economy where a disproportionate share of low-wage jobs are filled by people of color. Achieving genuine racial equity will require a transformation of our society and economy such that members of historically marginalized communities are no longer disproportionately paid low wages.
As long as racial disparities in pre-tax income persist, however, state EITCs can move us closer to a racially equitable outcome as they offer an effective way to bolster the economic security of lower-income people of color.
To demonstrate this, Figures 24 and 25 present data on the racial equity impact of New Jersey’s EITC. The beneficiaries of this program include a diverse mix of people of many different races and ethnicities. Approximately 37 percent of New Jersey EITC claimants are Hispanic, 35 percent are non-Hispanic white, 20 percent are Black, 6 percent are Asian, and 1 percent are multiracial. Expressed as a share of each race or ethnic group’s total families, however, Hispanic and Black families are the most likely to benefit. Figure 24 shows that almost one in three (32 percent) Hispanic New Jerseyans benefits from the state’s EITC compared to 27 percent of Black families, 18 percent of families headed by multiracial individuals, 12 percent of Asian families and 11 percent of white families.
The EITC is an effective means of lifting the incomes of lower-income families. On average, eligible families of all races earning less than $27,000 in New Jersey see their incomes lifted by $799 per year as a result of the state’s EITC. Because a disproportionate share of Black and Hispanic families have lower incomes, this also translates into a larger overall boost to the incomes of these groups, on average.

Figure 25 shows that the New Jersey EITC is somewhat narrowing racial income inequality in the state. The state’s EITC boosts the overall amount of income flowing to Hispanic families throughout the state by roughly 0.4 percent. The overall boost to Black families’ income is a little under 0.3 percent. Overall income flowing to families headed by white, Asian, or multiracial individuals is boosted by roughly 0.1 percent. These figures reflect the statewide average gain in income for each of these groups as a whole. Specific low-income taxpayers who are eligible for the credit can see much more meaningful gains in income, sometimes above 10 percent of their earnings.
In total, we estimate that roughly two-thirds of New Jersey’s EITC dollars flow to Hispanic (44 percent) or Black (21 percent) families—groups that together account for about one in three families in the state. Even after EITC dollars are distributed, however, the racial distribution of income in New Jersey remains highly unequal.
States have several options for advancing racial equity through a state EITC. The starting point, of course, is creating such a credit in the first place. States without such credits can add one to their existing income tax law at little administrative cost since the credit’s rules can be piggybacked largely on federal law. Even states without personal income taxes can create EITCs administered as standalone rebates, as Washington State will begin doing in 2022.[95] (The same can also be said of the other low-income credits described in the previous sections of this report. There is no need for states to have a personal income tax on the books in order to administer these types of programs as rebates.)
States should also improve on the design of the federal EITC by extending their own credits to immigrant workers who file taxes using Individual Taxpayer Identification Numbers (ITINs)—a group that is likely made up mostly of Hispanic and Asian families.[96] Most provisions of federal tax law apply equally to families filing with either Social Security Numbers or ITINs, with the EITC being a rare exception denied to ITIN filers (the Child Tax Credit is another exception). States have made significant progress on this front in a very short period, with California and Colorado now allowing ITIN filers to access the EITC through legislation enacted in 2020, and Maine, Maryland, New Mexico, Oregon, and Washington State enacting comparable legislation in 2021.[97]
Some states have also made meaningful progress in recent years to expand the credit’s reach to lower-income workers without dependents in the home—a group that has traditionally received little or no benefit from the EITC. This can involve boosting the size of the credit, loosening age limitations, and expanding income thresholds for this group. At the federal level, all of these reforms affecting workers without dependents have been implemented on a temporary basis for Tax Year 2021 but will soon expire absent additional federal legislation.[98]
Revisiting the Tax Treatment of Married CouplesThe federal income tax, and most state income taxes, allow married couples to combine their income and file one joint tax return. Under a progressive rate structure, this option tends to be most beneficial to single- earner households, such as those in which one spouse works a paying job while the other works to care for the couple’s children and home. This is potentially problematic from a race equity perspective because a disproportionate share of single-earner couples are white. Typically, married couples who file jointly gain access to larger deductions and wider tax brackets than a single person filing individually. At the federal level, for example, the 2021 standard deduction is $25,100 for married couples compared to $12,550 for single filers and the bottom tax bracket covers $19,900 of income for married couples compared to $9,950 for singles. For a couple where each spouse earns a similar amount of money, marriage typically offers little in the way of tax benefits, and in some instances may trigger a marriage penalty. But for single-earner households, marriage allows the high-earning spouse to gain access to more generous deductions and brackets and will usually result in a tax cut. The joint filing option in the U.S. was born out of a white, single-earner couple’s desire to reduce their federal income tax bill as much as possible. Henry Seaborn—the wealthy vice president of a shipbuilding company—and his wife Charlotte created it out of thin air in 1927 when they reported their income jointly even though federal law did not specifically allow for such an option at the time.[99] The IRS rejected their return, but the Supreme Court eventually ruled in their favor, paving the way for the joint filing option still used today.1[100] Because single-earner households are disproportionately white, this option tends to favor white households over households of color.[101] The most direct way to eliminate that racially disparate impact would be to shift toward a system of individual filing at the state and federal levels, where each spouse reports their income and claims tax benefits separately. Canada and most nations in the Organization for Economic Cooperation and Development (OECD) already require separate filing.[102] Under this type of system, the personal decision regarding whether to marry would no longer determine the amount of tax a couple pays. And state income tax codes’ skew in favor of single-earner marriages, which are more likely to be comprised of white spouses, would be eliminated. Moving toward a system of separate filing, however, would bring its own complications. For instance, tax credits based on family income like the Earned Income Tax Credit (EITC) or Child Tax Credit (CTC) could become more difficult to target effectively because the lower-earning spouse in a married couple could become eligible for these benefits even if they are married to an extremely high-income individual. Moreover, high-income couples making use of sophisticated tax planning techniques may choose to shift some of their income-producing assets to the lower-earning spouse in order to capitalize on the lower tax bracket they would enjoy under separate filing. Such tax planning could at least partly restore the marriage bonus for couples with unequal incomes, thereby undercutting the purpose of a shift to separate filing. Ultimately, the appropriate tax treatment of married couples is a complex issue without easy answers, as evidenced by the fact that an extensive body of legal research has been dedicated to this question.[103] Both joint and separate filing have strengths and weaknesses, and we therefore refrain from making a making a specific policy recommendation in this report. But it is important that lawmakers be aware that the joint return is a policy choice, not an inevitability, and that it produces racially disparate impacts that are deserving of scrutiny and debate. |
Support Single Parents with Head of Household Filing Status
One of the greatest advantages of personal income taxes is that they can be calibrated based on ability to pay. For example, exemptions and credits can ensure that low-income people are not taxed deeper into poverty while graduated rates can require that top earners pay a higher tax rate than middle-income families. But income level is not the only relevant factor in determining ability to pay. Family size – especially the number of dependents in the home – also affects ability to pay.
A single individual without children earning a $50,000 salary, for instance, clearly has a higher ability to pay than a single parent with two children living on the same level of earnings. Achieving racial equity in the tax code demands that state lawmakers take this reality into account when determining how much income tax should be paid by families of different sizes.
Tax credits for families with children, which were discussed in an earlier section, offer one promising means of adjusting income taxes to better account for family size. Another valuable mechanism is the head of household filing status, which can be used by single parents and other unmarried people caring for dependents to access larger deductions and more generous tax brackets. Typically, the deductions and tax brackets available to head of household filers fall halfway between the amounts available to single filers and married couples filing jointly. But not all states offer head of household filing benefits. Kansas, Louisiana, and Wisconsin, for instance, require heads of household to pay under the same rate schedule as single individuals without children and Georgia offers the same standard deduction to heads of households as to other singles. Similarly, Mississippi, Montana, Ohio, Rhode Island, South Carolina, Virginia, and West Virginia require both heads of household and married couples to pay under the same rate schedule as single individuals.
After adjusting for family size, head of household filers have significantly lower average incomes than either married couples or single individuals without children. In 2017, for example, the average family filing as a married couple reported $130,000 of adjusted gross income and three members of the household, for an average income per household member of $43,000. The average head of household, by contrast, reported just $40,000 of income but 2.6 members of the household, for an average per-person income of $15,000. On average, families filing as head of household on their federal tax returns are in a more precarious economic position than people using any other filing status. For this reason, states should follow the federal government’s lead in offering more generous tax treatment to single parents and other heads of households.
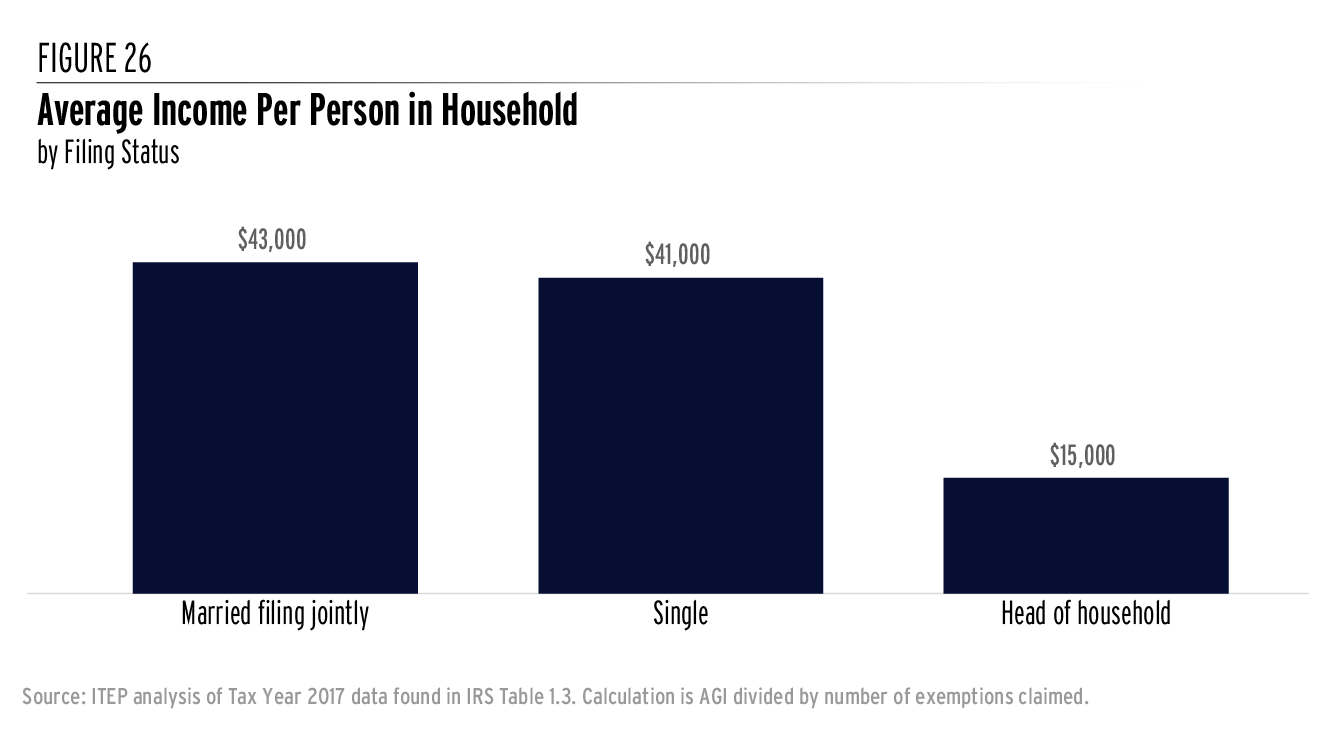
Head of household filing status is particularly important to communities of color as a disproportionate share of Black, Hispanic, Indigenous, and multiracial people raising children are unmarried.[104] Offering enhanced tax benefits to heads of household therefore offers one avenue for advancing economic and racial equity.
Allow Local Governments to Levy Robust Income Taxes
Personal income taxes are among the most equitable sources of revenue available at any level of government. Unfortunately, most states prohibit their localities from levying income taxes while others place restrictions on income tax rates, tax bases, credits, or the kinds of localities that can implement these taxes. These restrictions often cause local governments to turn to sales taxes, fines, fees, and other regressive levies to supplement property tax revenues in funding local services and institutions.
Fees and fines are particularly problematic from a race equity perspective. Government officials who collect fees and fines, often police officers and court officials, have enormous discretion in choosing who is subjected to monetary penalties. The U.S. Commission on Civil Rights found that the “unchecked discretion or stringent requirements to impose fines or fees can lead and have led to discrimination and inequitable access to justice.”[105] That is, a lack of oversight and pressure to collect revenue are encouraging over-policing and criminalization of communities of color.
State officials committed to advancing race equity should work to equip local governments with more equitable revenue options, such as local personal income taxes. Such a reform could contribute to a more racially just state and local finance system overall.
One drawback of this approach is that poorer communities, often home to a disproportionate share of people of color, will not be able to raise the same amount of revenue through a personal income tax as high-income jurisdictions—a problem that also exists under the property tax and to some extent sales taxes as well. Local income taxes are therefore not a replacement for robust state fiscal aid to lower-income localities. But they are a good option for replacing dollars raised through more regressive sources like sales taxes and fines and fees.
Seventeen states currently see at least one locality within its borders levy some kind of local income tax.[106] These taxes vary significantly in scope and design. Some of the more progressive approaches include taxes on interest and dividend income in Kansas, graduated rate taxes in New York City and Portland, Oregon, and taxes that include local-level EITCs in New York City and Montgomery County, Maryland.
Progress toward more robust and progressive local income taxes has been mixed in recent years.
After Montgomery, Alabama tried to implement a 1 percent local income tax in 2020, for example, the state legislature quickly intervened to nullify the measure and require all future local income tax increases to gain state approval prior to enactment. It bears noting that Montgomery is a majority-Black city whereas the state legislature is 75 percent white.[107]
On the other hand, voters in Portland and Multnomah County, Oregon, recently approved new income taxes on married couples with incomes over $200,000 and single filers with income above $125,000.[108]
Local income taxes are unlikely to supplant the property tax as the primary vehicle to fund local services in the immediate future. Moreover, the reality of residential segregation means that there are inherent limitations to the potential of local taxes to advance racial equity. A robust local income tax in San Francisco, for example, will not directly benefit the residents of Oakland.
But localities inevitably need to raise revenue, and local income taxes have the potential to diversify local revenue streams and move toward more racially equitable systems of local-level public finance.
Conclusion
Racism and discrimination have created extremely unequal distributions of income and wealth across race and ethnicity. While personal income tax laws on their own will not solve these problems, they offer one of the most promising routes toward beginning to address racial income and wealth inequality through the tax code.
Looking carefully at a range of factors impacting tax liability – income level, wealth, homeownership, age, and family structure, for example – helps to make clear how tax codes can be used to advance, or hinder, racial equity.
Lawmakers who want to make their personal income taxes a more powerful force for advancing racial equity should look to repeal tax subsidies or otherwise ask more of high-income investors, business owners, employees, retirees, and homeowners. At the same time, personal income tax codes should be used to lift up lower-income workers, renters, and families with children through refundable credits. Reforms of this type have a valuable role to play in narrowing unconscionable racial disparities in income, wealth, and economic well-being.
Appendices
Acknowledgments
The authors wish to thank Kamolika Das, Aidan Davis, Lisa Christensen Gee, Dylan Grundman O’Neill, Emma Sifre, and Meg Wiehe for research support.
Endnotes
[1] Matthew Sheffield, “Poll: A majority of Americans support raising the top tax rate to 70 percent,” The Hill. January 2019. https://thehill.com/hilltv/what-americas-thinking/425422-a-majority-of-americans- support-raising-the-top-tax-rate-to-70.
[2] Jerome Culp of Duke University is often credited with inspiring this line of scholarship with a question he posed in: Jerome McCristal Culp, Jr., “Toward a Black Legal Scholarship: Race and Original Understandings,” Duke Law Journal, 1991, pp. 39-105. Some of the earliest responses to that question include: Beverly I. Moran and William Whitford, “A Black Critique of the Internal Revenue Code,” Wisconsin Law Review, 1996, pp. 751-820. Dorothy A. Brown, “The Marriage Bonus/Penalty in Black and White,” 65 University of Cincinnati Law Review, 1996, pp. 787-798.
[3] Meg Wiehe, Aidan Davis, Carl Davis, et al., “Who Pays? A Distributional Analysis of the Tax Systems in All 50 States,” Institute on Taxation and Economic Policy. October 2018. https://itep.org/whopays/. Carl Davis, Misha Hill, and Meg Wiehe, “Taxes and Racial Equity: An Overview of State and Local Policy Impacts,” Institute on Taxation and Economic Policy. March 2021. https://itep.org/taxes-and-racial-equity/.
[4] Marianne Bertrand and Sendhil Mullainathan, “Are Emily and Greg More Employable Than Lakisha and Jamal: A Field Experiment on Labor Market Discrimination,” 94(4) American Economic Review, 2004, pp. 991-1013. S. Michael Gaddis, “Discrimination in the Credential Society: An Audit Study of Race and College Selectivity in the Labor Market,” 93(4) Social Forces, 2015, pp. 1451–1479, https://doi.org/10.1093/sf/sou111.
[5] Farah Z. Ahmad and Christian E. Weller, “Reading Between the Data: The Incomplete Story of Asian Americans, Native Hawaiians, and Pacific Islanders,” Center for American Progress, March 2014. https:// cdn.americanprogress.org/wp-content/uploads/2014/03/AAPI-report.pdf. Jeff Guo, “The Asian American ‘advantage’ that is actually an illusion,” Washington Post. December 29, 2016. https://www.washingtonpost. com/news/wonk/wp/2016/12/29/the-asian-american-advantage-that-is-actually-an-illusion/. Melany De La Cruz-Viesca, Zhenxiang Chen, Paul M. Ong, et al., “The Color of Wealth in Los Angeles”, Duke University, The New School, UCLA, and Insight Center for Community Economic Development. 2016. http://www.aasc.ucla. edu/besol/color_of_wealth_report.pdf.
[6] Neil Bhutta, Andrew C. Chang, Lisa J. Dettling, et al., “Disparities in Wealth by Race and Ethnicity in the 2019 Survey of Consumer Finances,” FEDS Notes. Washington: Board of Governors of the Federal Reserve System. September 2020. https://doi.org/10.17016/2380-7172.2797.
[7] William Darity Jr., Darrick Hamilton, Mark Paul, et al., “What We Get Wrong About Closing the Racial Wealth Gap,” Samuel DuBois Cook Center on Social Equity and Insight Center for Community Economic Development. April 2018. https://insightcced.org/wp-content/uploads/2018/07/Where-We-Went-Wrong- COMPLETE-REPORT-July-2018.pdf.
[8] Darrick Hamilton, William Darity Jr., Anne E. Price, et al., “Umbrellas Don’t Make it Rain: Why Studying and Working Hard Isn’t Enough for Black Americans,” The New School, Duke Center for Social Equity, and Insight Center for Community Economic Development. April 2015. https://insightcced.org/wp- content/uploads/2015/08/Umbrellas_Dont_Make_It_Rain_Final.pdf.
[9] David S. Evans and Boyan Jovanovic, “An Estimated Model of Entrepreneurial Choice under Liquidity Constraints,” 97(4) Journal of Political Economy, 1989, pp. 808-827. Robert W. Fairlie and Alicia
M. Robb, “Disparities in Capital Access between Minority and Non-Minority-Owned Businesses: The Troubling Reality of Capital Limitations Faced by MBEs,” U.S. Department of Commerce, Minority Business Development Agency. January 2010. https://www.mbda.gov/sites/default/files/migrated/files-attachments/ DisparitiesinCapitalAccessReport.pdf. Lincoln Quillian, Devah Pager, Ole Hexel, and Arnfinn H. Midtbøen, “Meta-analysis of field experiments shows no change in racial discrimination in hiring over time,” 114(41) Proceedings of the National Academy of Sciences of the United States of America, 2017, pp. 10870-10875. https://www.pnas.org/content/pnas/114/41/10870.full.pdf.
[10] Judith Scott-Clayton and Jing Li, “Black-white disparity in student loan debt more than triples after graduation,” 2(3) Evidence Speaks Reports. Center on Children and Families at Brookings. October 2016. https://www.brookings.edu/wp-content/uploads/2016/10/es_20161020_scott-clayton_evidence_speaks.pdf.
[11] Andre M. Perry, Jonathan Rothwell, and David Harshbarger, “The devaluation of assets in Black neighborhoods: The case of residential property.” Brookings Institution. November 2018. https://www. brookings.edu/research/devaluation-of-assets-in-black-neighborhoods/. Maria Krysan, Mick P. Couper, Reynolds Farley, and Tyrone Forman, “Does Race Matter in Neighborhood Preferences? Results from a Video Experiment,” 115(2) American Journal of Sociology, 2009, pp. 527-559.
[12] Dorothy A. Brown, “The Whiteness of Wealth: How the Tax System Impoverishes Black Americans— And How We Can Fix It.” New York, Crown, 2021.
[13] Ibid.
[14] Meg Wiehe, Emanuel Nieves, Jeremie Greer, and David Newville, “Race, Wealth and Taxes: How the Tax Cuts and Jobs Act Supercharges the Racial Wealth Divide,” Institute on Taxation and Economic Policy and Prosperity Now. October 2018. https://itep.org/race-wealth-and-taxes-how-the-tax-cuts-and-jobs-act- supercharges-the-racial-wealth-divide/.
[15] Carl Davis, Misha Hill, and Meg Wiehe, “Taxes and Racial Equity: An Overview of State and Local Policy Impacts,” Institute on Taxation and Economic Policy. March 2021. https://itep.org/taxes-and-racial- equity/.
[16]A more detailed discussion of these findings is available in: Carl Davis, Misha Hill, and Meg Wiehe, “Taxes and Racial Equity: An Overview of State and Local Policy Impacts,” Institute on Taxation and Economic Policy. March 2021. https://itep.org/taxes-and-racial-equity/. Our method for disaggregating state and local tax incidence by race is explained here: https://itep.org/itep-tax-model/iteps-approach-to- modeling-taxes-by-race-and-ethnicity.
[17] All tax units in the ITEP Microsimulation Tax Model, including those containing people of multiple races, are assigned to race and ethnicity groups based only on the race or ethnicity of the tax unit head. The race of the tax unit head is estimated based on the racial composition of similar sub-household groups using the Census Bureau’s American Community Survey (ACS). A “Black household,” for example, is one where the tax unit head (often the respondent to a Census survey) personally identifies as Black and might also contain people of other races or ethnicities.
[18] Personal and dependent tax breaks in Virginia and most other states take the form of exemptions, though in California these policies are administered as tax credits. Designing these policies as tax credits is useful in avoiding the inherently regressive nature of tax exemptions, where the tax savings derived from each dollar of tax exemption is highest for affluent families in higher tax brackets.
[19] Kayla Kitson, “California Loses More Than $60 Billion Through Tax Breaks Each Year, Much of It to High-Income Households and Corporations,” California Budget and Policy Center. January 2020. https:// calbudgetcenter.org/wp-content/uploads/2020/01/CA_Budget_Center_tax-expenditures-fact-sheet.pdf.
[20] Meg Wiehe, Aidan Davis, Carl Davis, et al., “Who Pays? A Distributional Analysis of the Tax Systems in All 50 States,” Institute on Taxation and Economic Policy. October 2018. https://itep.org/whopays/. Carl Davis, Misha Hill, and Meg Wiehe, “Taxes and Racial Equity: An Overview of State and Local Policy Impacts,” Institute on Taxation and Economic Policy. March 2021. https://itep.org/taxes-and-racial-equity/.
[21] Many relevant essays are compiled in: Anthony C. Infanti and Bridget J. Crawford, “Critical Tax Theory: An Introduction.” Cambridge, Cambridge University Press, 2009.
[22] Our method for disaggregating state and local tax incidence by race is explained here: https://itep. org/itep-tax-model/iteps-approach-to-modeling-taxes-by-race-and-ethnicity/.
[23] 23) During the first quarter of 2021, the most recent period with available data as of this writing, 55 percent of corporate equities, mutual fund shares, and private business wealth was held by the top 1 percent of households by wealth. See Board of Governors of the Federal Reserve System, “Distribution of Household Wealth in the U.S. since 1989.” https://www.federalreserve.gov/releases/z1/dataviz/dfa/distribute/table/#frb-rs-dfa-table;quarter:120;series:Corporate%20equities%20and%20mutual%20fund%20 shares;demographic:race;population:1,3,5,7;units:shares.
[24] Lily Altavena, “Arizona voters approve Prop. 208, education tax on state’s highest earners,” Arizona Republic. November 2020. https://www.azcentral.com/story/news/politics/arizona-education/2020/11/03/ proposition-208-invest-education-act-election-results-raise-taxes-high-earners/6041668002/.
[25] Note that while this figure includes all relevant policy changes enacted through the end of 2020, it is conducted at 2015 levels and excludes elderly households, for reasons explained in ITEP’s Who Pays? Report. The other numbers cited in this section, by contrast, are calculated at 2019 levels and include households headed by people of all ages. See Meg Wiehe, Aidan Davis, Carl Davis, et al., “Who Pays? A Distributional Analysis of the Tax Systems in All 50 States,” Institute on Taxation and Economic Policy. October 2018. https:// itep.org/whopays/.
[26] Laurie Roberts, “Gov. Ducey says tax cut will average $350? Don’t go making plans for that money just yet,” Arizona Republic. June 2021. https://www.azcentral.com/story/opinion/op-ed/
laurieroberts/2021/06/25/arizona-legislature-passes-huge-tax-cut-slaps-prop-208-voters/5352868001/.
[27] Bob Christie, “Arizona groups that blocked Proposition 208 seek to block tax cuts signed by Gov. Ducey,” Arizona Republic. July 2021. https://www.azcentral.com/story/news/politics/arizona/2021/07/02/ arizona-groups-backed-proposition-208-seek-block-tax-cuts/7848699002/.
[28] Robert Robb, “Arizona’s budget bills may be the worst ever (even if they have some good ideas),” Arizona Republic. June 2021. https://www.azcentral.com/story/opinion/op-ed/robertrobb/2021/06/06/arizona- budget-bills-blatantly-violate-state-constitution/7533387002/.
[29] Meg Wiehe, Aidan Davis, Carl Davis, et al., “Who Pays? A Distributional Analysis of the Tax Systems in All 50 States,” Institute on Taxation and Economic Policy. October 2018. https://itep.org/whopays/.
[30] IRS Table 1.4, Tax Year 2018.
[31] Sherman D. Hanna, Cong Wang, and Yoonkyung Yuh, “Racial/Ethnic Differences in High Return Investment Ownership: A Decomposition Analysis,” 21(2) Journal of Financial Counseling and Planning. 2010.
[32] Stan Choe, “Stocks are soaring, and most Black people are missing out,” Associated Press. October 2020. https://apnews.com/article/virus-outbreak-race-and-ethnicity-business-us-news-ap-top-news-69fe836 e19a8dfe89d73e8e4be6d480c.
[33] Tristan Mabry, “Black Investors Lack Trust in Brokers, Shy Away From Investing in Stocks,” The Wall Street Journal. May 1999. https://www.wsj.com/articles/SB926636527156960101.
[34] Dorothy A. Brown, “The Whiteness of Wealth: How the Tax System Impoverishes Black Americans— And How We Can Fix It.” New York, Crown, 2021.
[35] U.S. Census Bureau, “Wealth, Asset Ownership, & Debt of Households Detailed Tables: 2017.” https:// www.census.gov/data/tables/2017/demo/wealth/wealth-asset-ownership.html.
[36] Ibid.
[37] During the first quarter of 2021, the most recent period with available data as of this writing, 89.1 percent of corporate equities, mutual fund shares, and private business wealth was held by non- Hispanic white families. Just 1.3 percent was held by Black families, 0.8 percent by Hispanic families, and 8.8 percent by other families. See Board of Governors of the Federal Reserve System, “Distribution of Household Wealth in the U.S. since 1989.” https://www.federalreserve.gov/releases/z1/dataviz/dfa/distribute/table/#frb-rs-dfa-table;quarter:120;series:Corporate%20equities%20and%20mutual%20fund%20 shares;demographic:race;population:1,3,5,7;units:shares.
[38] Marco Guzman, “State Taxation of Capital Gains: The Folly of Tax Cuts & Case for Proactive Reforms,” Institute on Taxation and Economic Policy. September 2020. https://itep.org/state-taxation-of-capital-gains- the-folly-of-tax-cuts-case-for-proactive-reforms/.
[39] New Mexico House Bill 6 of the 2019 regular session reduced the capital gains deduction from 50 to 40 percent. Colorado House Bill 21-1311 of the 2021 legislative session eliminated the capital gains deduction except for qualified agricultural property.
[40] Marco Guzman, “State Taxation of Capital Gains: The Folly of Tax Cuts & Case for Proactive Reforms,” Institute on Taxation and Economic Policy. September 2020. https://itep.org/state-taxation-of-capital-gains- the-folly-of-tax-cuts-case-for-proactive-reforms/.
[41] 26 U.S. Code § 1256. 26 U.S. Code § 475.
[42] Steve Wamhoff, “Sen. Wyden’s Anti-Deferral Accounting Proposal Could Be a Game-Changer,” Institute on Taxation and Economic Policy. September 2019. https://itep.org/sen-wydens-anti-deferral- accounting-proposal-could-be-a-game-changer/. Jimmy Vielkind, “Some Democratic Lawmakers Push for Wealth Tax on New York Billionaires,” The Wall Street Journal. February 2021. https://www.wsj.com/articles/ some-democratic-lawmakers-push-for-wealth-tax-on-new-york-billionaires-11613692224. David Gamage, Emmanuel Saez, and Darien Shanske, “The NY Billionaire Mark-to-Market Tax Act: Revenue, Economic, and Constitutional Analysis,” Indiana Legal Studies Research Paper Forthcoming, 2021. https://papers.ssrn.com/ sol3/papers.cfm?abstract_id=3766547.
[43] Laura Saunders, “Death and Taxes: Biden Wants to Step Down the ’Step-Up’ on Investment Gains,” The Wall Street Journal. April 2021. https://www.wsj.com/articles/death-and-taxes-biden-wants-to-step- down-the-step-up-on-investment-gains-11619775021.
[44] Note that under a comprehensive mark-to-market system, stepped-up basis becomes much less important because most gains will have already been taxed by the time an asset is passed on to an heir. But for any state that has not implemented a comprehensive mark-to-market system (and to date, none have), eliminating stepped-up basis still has a valuable role to play in tax reform.
[45] Nathan Goldschlag, J. Daniel Kim, & Kristin McCue, “Just Passing Through: Characterizing U.S. Pass-Through Business Owners,” November 2017. https://cmepr.gmu.edu/wp-content/uploads/2018/10/CES- WP-17-69.pdf. Michael Cooper, John McClelland, & James Pearce, et al., “Business in the United States: Who Owns it and How Much Tax Do They Pay?” National Bureau of Economic Research, October 2015. https:// www.nber.org/system/files/working_papers/w21651/w21651.pdf.
[46] These figures are for the first quarter of 2021, which is the most recent period with available data as of this writing. See Board of Governors of the Federal Reserve System, “DFA: Distribution of Household Wealth in the U.S. since 1989.” https://www.federalreserve. gov/releases/z1/dataviz/dfa/distribute/table/#frb-rs-dfa-table;quarter:126;series:Private%20businesses;demographic:race;population:1,3,5;units:shares;range:1989.3,2021.1. U.S. Census Bureau, “Annual Estimates of the Resident Population by Sex, Age, Race, and Hispanic Origin for the United States: April 1, 2020 to July 1, 2019.” White and Black populations are defined to include only non-Hispanic individuals in the DFA data and we have used to same definitions of these groups in calculating population shares based on Census data.
[47] During the first quarter of 2021, the most recent period with available data as of this writing, 84.9 percent of private business wealth was held by the top 10 percent of households, by wealth, and 54.9 percent was held by the top 1 percent. See Board of Governors of the Federal Reserve System, “DFA: Distribution of Household Wealth in the U.S. since 1989.” https://www.federalreserve. gov/releases/z1/dataviz/dfa/distribute/table/#frb-rs-dfa-table;quarter:126;series:Private%20businesses;demographic:networth;population:all;units:shares;range:1989.3,2021.1.
[48] Robert W. Fairlie, Alicia Robb, & David T. Robinson, “Black and White: Access to Capital Among Minority-Owned Startups,” National Bureau of Economic Research. November 2020. https://www.nber.org/ system/files/working_papers/w28154/w28154.pdf.
[49] Board of Governors of the Federal Reserve System, “Report to Congress on the Availability of Credit to Small Businesses.” September 2017. https://www.federalreserve.gov/publications/2017-september- availability-of-credit-to-small-businesses.htm.
[50] Gene Marks, “Black-owned firms are twice as likely to be rejected for loans. Is this discrimination?,” The Guardian. January 2020. https://www.theguardian.com/business/2020/jan/16/black-owned-firms-are- twice-as-likely-to-be-rejected-for-loans-is-this-discrimination. Robert W. Fairlie, Alicia Robb, and David T. Robinson, “Black and White: Access to Capital Among Minority-Owned Startups,” NBER Working Paper 28154. https://www.nber.org/papers/w28154.
[51] Kevin L. Matthews II, “There’s a ’credit gap’ between Black and white Americans, and it’s holding Black Americans back from building wealth,” Business Insider. January 2021. https://www.businessinsider. com/personal-finance/credit-gap-black-americans-building-wealth-2021-1.
[52] Board of Governors of the Federal Reserve System, “Report to Congress on the Availability of Credit to Small Businesses.” September 2017. https://www.federalreserve.gov/publications/2017-september- availability-of-credit-to-small-businesses.htm.
[53] Credit Suisse, “Wealth patterns among the top 5% of African-Americans,” November 2014. https://research-doc.credit-suisse.com/docView?sourceid=em&document_ id=x603305&serialid=EPbpZVC9yQSzQAcQybZ8trdJT5i1wtDSIYihG%2b07VaQ%3d.
[54] Ibid.
[55] 26 U.S. Code § 199A.
[56] Colorado House Bill 21-1311 of the 2021 legislative session.
[57] Elizabeth Arias, “Changes in Life Expectancy by Race and Hispanic Origin in the United States, 2013- 2014,” National Center for Health Statistics data brief no. 244. April 2016. https://www.cdc.gov/nchs/products/ databriefs/db244.htm#birth.
[58] Eileen Patten, “The Nation‘s Latino Population Is Defined by Its Youth,” Pew Research Center. April 2016. https://www.pewresearch.org/hispanic/2016/04/20/the-nations-latino-population-is-defined-by-its- youth/. Pew Research Center, “Modern Immigration Wave Brings 59 Million to U.S., Driving Population Growth and Change Through 2065: Views of Immigration‘s Impact on U.S. Society Mixed.” September 2015. https://www.pewresearch.org/hispanic/2015/09/28/modern-immigration-wave-brings-59-million-to-u-s- driving-population-growth-and-change-through-2065/.
[59] Mark Miller, “America’s Retirement Race Gap, and Ideas for Closing It,” The New York Times. August 2020. https://www.nytimes.com/2020/08/14/business/retirement-inequality-racism.html.
[60] 60) Susan K. Urahn, Travis Plunkett, John Scott, et al., “Employer-Sponsored Retirement Plan Access, Uptake, and Savings,” Pew Charitable Trusts. September 2016. https://www.pewtrusts.org/-/media/ assets/2016/09/employersponsoredretirementplanaccessuptakeandsavings.pdf. Wenliang Hou and Geoffrey
T. Sanzenbacher, “Social Security is a Great Equalizer,” Center for Retirement Research at Boston College. January 2020. https://crr.bc.edu/wp-content/uploads/2020/01/IB_20-2.pdf.
[61] Board of Governors of the Federal Reserve System, “Report on the Economic Well-Being of U.S. Households in 2019, Featuring Supplemental Data from April 2020.” May 2020. https://www.federalreserve. gov/publications/2020-economic-well-being-of-us-households-in-2019-retirement.htm.
[63] Wenliang Hou and Geoffrey T. Sanzenbacher, “Social Security is a Great Equalizer,” Center for Retirement Research at Boston College. January 2020. https://crr.bc.edu/wp-content/uploads/2020/01/IB_20- 2.pdf.
[64] Center on Budget and Policy Priorities, “Policy Basics: Top Ten Facts About Social Security.” August 2016. https://www.cbpp.org/research/social-security/top-ten-facts-about-social-security.
[65] Prosperity Now, “State Data: Homeownership Rate.” https://scorecard.prosperitynow.org/data-by- issue#housing/outcome/homeownership-rate.
[66] These are Tax Year 2021 values. These amounts are indexed to inflation and therefore change from year to year.
[67] The average top income tax rate among states offering itemized deductions is 6.7 cents. Carl Davis, “State Itemized Deductions: Surveying the Landscape, Exploring Reforms,” Institute on Taxation and Economic Policy. February 2020. https://itep.org/state-itemized-deductions-surveying-the-landscape- exploring-reforms/.
[68] This assumes that the buyer made a 10 percent down payment on a $300,000 home and has a 30- year mortgage of $270,000 at an interest rate of 4 percent. In this case, interest payments in the first year should be $10,713. Deducting this amount against a 7 percent tax rate would yield $749.91 in annual tax cuts or $62.49 per month. The actual tax cut would be lower if the buyer’s itemized deductions exceed their potential standard deduction by less than $10,713.
[69] Data for the first quarter of 2021, the most recent period with available data as of this writing. See Board of Governors of the Federal Reserve System, “Distribution of Household Wealth in the U.S. since 1989.” https://www.federalreserve.gov/releases/z1/dataviz/dfa/distribute/ table/#frb-rs-dfa-table;quarter:120;series:Corporate%20equities%20and%20mutual%20fund%20 shares;demographic:race;population:1,3,5,7;units:shares.
[70] Carl Davis, Misha Hill, and Meg Wiehe, “Taxes and Racial Equity: An Overview of State and Local Policy Impacts,” Institute on Taxation and Economic Policy. March 2021. https://itep.org/taxes-and-racial- equity/.
[71] Aidan Davis, “Property Tax Circuit Breakers in 2018,” Institute on Taxation and Economic Policy, September 2018. https://itep.org/property-tax-circuit-breakers-in-2018/.
[72] David E. Black, “The Incidence of Differential Property Taxes on Urban Housing: Some Further Evidence,” 27(2) National Tax Journal, 1974. pp. 367-369. David N. Hyman and Ernest C. Pasour, Jr., “Property Tax Differentials and Residential Rents in North Carolina,” 26(2) National Tax Journal, 1973. pp. 303-307. Larry L. Orr, “The Incidence of Differential Property Taxes: A Response,” 23(1) National Tax Journal, 1970. pp. 99-101.
[73] The most recent Minnesota Department of Revenue study concludes that the share of rent constituting property taxes varies from a high of 16.1 percent in Minneapolis to a low of 12.9 percent outside of the city’s largest urban areas. See Minnesota Department of Revenue, “Estimate of the Percentage of Rent that Constitutes Property Taxes in Minnesota.” March 2018. https://www.revenue.state.mn.us/sites/ default/files/2018-12/Rent%20Constituting%20Property%20Taxes%202018%20%28Feb%2027%29.pdf.
[74] The homeowner portion of Minnesota’s circuit breaker credit lifts overall family income by 0.2 percent for white, Hispanic, and Asian families compared to just 0.1 percent for Black families. The smaller average impact for Black households under the homeowner credit reflects underlying inequities in homeownership rates by race. Because the homeowner circuit breaker is means tested, however, it is less tilted toward white taxpayers than the other types of homeownership subsidies discussed earlier in this report such as itemized deductions for mortgage interest or property taxes.
[75] Jeff Stein, “Sen. Kamala Harris’s 2020 policy agenda: $3 trillion tax plan, tax credits for renters, bail reform, Medicare for all,” The Washington Post. January 2019. https://www.washingtonpost.com/ politics/2019/01/21/sen-kamala-harriss-policy-agenda-trillion-tax-plan-tax-credits-renters-bail-reform- medicare-for-all/.
[76] Aidan Davis, “Property Tax Circuit Breakers in 2018,” Institute on Taxation and Economic Policy. September 2018. https://itep.org/property-tax-circuit-breakers-in-2018/.
[77] See Table 2, page 11 of: Board of Governors of the Federal Reserve System, “Changes in U.S. Family Finances from 2016 to 2019: Evidence from the Survey of Consumer Finances,” 106(5) Federal Reserve Bulletin. September 2020. https://www.federalreserve.gov/publications/files/scf20.pdf.
[78] Danilo Trisi and Ife Floyd, “Benefits of Expanding Child Tax Credit Outweigh Small Employment Effects,” Center on Budget and Policy Priorities. March 2021. https://www.cbpp.org/research/federal-tax/ benefits-of-expanding-child-tax-credit-outweigh-small-employment-effects.
[79] National Academies of Sciences, Engineering, and Medicine, “A Roadmap to Reducing Child Poverty,” Washington, DC, National Academies Press. 2019. https://www.nap.edu/read/25246.
[80] Uyen Sophie Nguyen, Sheila Smith, and Maribel R. Granja, “Young Children in Deep Poverty: Racial/ Ethnic Disparities and Child Well-Being Compared to Other Income Groups,” National Center for Children in Poverty. October 2020. https://www.nccp.org/wp-content/uploads/2020/10/Deep-Poverty-Report-11.11.20_ Final.pdf.
[81] Irwin Garfinkel, Laurel Sariscsany, Elizabeth Ananat, et al., “The Costs and Benefits of a Child Allowance,” 5(1) Poverty & Social Policy Brief. 2021. https://www.povertycenter.columbia.edu/news- internal/2021/child-allowance/cost-benefit-analysis.
[82] Aidan Davis, “State Tax Codes as Poverty Fighting Tools: 2019 Update on Four Key Policies in All 50 States,” Institute on Taxation and Economic Policy. September 2019. https://itep.org/state-tax-codes-as- poverty-fighting-tools/.
[83] New York State Department of Taxation and Finance, “Empire State child credit.” Accessed May 14, 2021. https://www.tax.ny.gov/pit/credits/empire_state_child_credit.htm.
[84] ITEP has found that more than one-third of children (39 percent) live in families that do not qualify for the full federal Child Tax Credit absent the temporary reforms made by the American Rescue Plan
Act. The statistic varies significantly by race and ethnicity and includes 47.6 percent of Black children, 45.7 percent of Hispanic children, 36.0 percent of white children, and 34.0 percent of Asian children. See Aidan Davis, “Child Tax Credit Is a Critical Component of Biden Administration’s Recovery Package,” Institute on Taxation and Economic Policy. April 2021. https://itep.org/child-tax-credit-is-critical-component-of-biden- administrations-recovery-package/.
[85] Meg Wiehe, Aidan Davis, Carl Davis, et al., “Who Pays? A Distributional Analysis of the Tax Systems in All 50 States,” Institute on Taxation and Economic Policy. October 2018. https://itep.org/whopays/.
[86] Data provided by National KIDS COUNT, based on the U.S. Census Bureau’s 2019 American Community Survey: https://datacenter.kidscount.org/data/tables/44-children-in-poverty-by-race-and- ethnicity#detailed/2/2-53/false/1729/9,12,1,13/323.
[87] Data provided by National KIDS COUNT, based on the U.S. Census Bureau’s 2019 American Community Survey: https://datacenter.kidscount.org/data/tables/44-children-in-poverty-by-race-and- ethnicity#detailed/1/any/false/1729/9,12,1/323.
[88] There are no available data on the race and ethnicity of the specific group of children that would benefit from this reform, but if this group resembles the larger undocumented population or the overall immigrant population, then it is comprised mainly of Hispanic and Asian children and their families. For data on the demographic profile of the undocumented population, see: https://www.migrationpolicy.org/ data/unauthorized-immigrant-population/state/US.
[89] Aidan Davis, “State-Level EITC Victories in 2021,” Institute on Taxation and Economic Policy. June 2021. https://itep.org/state-level-eitc-victories-in-2021/.
[90] Marco Guzman, “Inclusive Child Tax Credit Reform Would Restore Benefit to 1 Million Young ’Dreamers,’” Institute on Taxation and Economic Policy. April 2021. https://itep.org/inclusive-child-tax-credit- reform-would-restore-benefit-to-1-million-young-dreamers/.
[91] Lynda Laughlin, “Who’s Minding the Kids? Child Care Arrangements: Spring 2011.” U.S. Department of Commerce, Economics and Statistics Administration. P70-135. April 2013. https://www.census.gov/ prod/2013pubs/p70-135.pdf.
[92] Sarah Jane Glynn, “The Economics of Caregiving for Working Mothers,” Center for American Progress. December 2019. https://www.americanprogress.org/issues/early-childhood/ reports/2019/12/10/478387/economics-caregiving-working-mothers/.
[93] U.S. Department of Health & Human Services Office of Child Care, “Child Care and Development Fund Final Rule Frequently Asked Questions.” https://www.acf.hhs.gov/occ/faq/child-care-and-development- fund-final-rule-frequently-asked-questions.
[94] Aidan Davis, “State Tax Codes as Poverty Fighting Tools: 2019 Update on Four Key Policies in All 50 States,” Institute on Taxation and Economic Policy. September 2019. https://itep.org/state-tax-codes-as- poverty-fighting-tools/.
[95] Washington State Budget & Policy Center, “The Working Families Tax Credit to be enacted in Washington state,” Schmudget Blog. April 2021. https://budgetandpolicy.org/schmudget/the-working- families-tax-credit-to-be-enacted-in-washington-state/.
[96] There are no available data on the race and ethnicity of taxpayers who file using ITINs, but if this group resembles the larger undocumented population or the overall immigrant population, then it is comprised mainly of Hispanic and Asian households. For data on the demographic profile of the
undocumented population, see: https://www.migrationpolicy.org/data/unauthorized-immigrant-population/ state/US.
[97] Aidan Davis, “State-Level EITC Victories in 2021,” Institute on Taxation and Economic Policy. June 2021. https://itep.org/state-level-eitc-victories-in-2021/.
[98] Legislative Analyst’s Office, “Tax Credit Expansions in the American Rescue Plan,” Budget and Policy Post. April 2021. https://lao.ca.gov/Publications/Report/4410.
[99] Dorothy A. Brown, “The Whiteness of Wealth: How the Tax System Impoverishes Black Americans— And How We Can Fix It.” New York, Crown, 2021. pp. 59-62.
[100] Poe v. Seaborn, 282 U.S. 101 (1930).
[101] Dorothy A. Brown, “The Whiteness of Wealth: How the Tax System Impoverishes Black Americans— And How We Can Fix It.” New York, Crown, 2021. pp. 59-62.
[102] Organisation for Economic Cooperation and Development, “Fundamental Reform of Personal Income Tax,” OECD Tax Policy Studies. May 2006. https://www.oecd-ilibrary.org/taxation/fundamental- reform-of-personal-income-tax_9789264025783-en.
[103] The research devoted to this topic is too voluminous to list in full but it includes: Dorothy A. Brown, “The Marriage Bonus/Penalty in Black and White,” 65 University of Cincinnati Law Review, 1996, pp. 787- 798. Anne L. Alstott, “Tax Policy and Feminism: Competing Goals and Institutional Choices,” 96(8) Columbia Law Review, 1996, pp. 2001-2082. Robert S. McIntyre and Michael J. McIntyre, “Fixing the ’Marriage Penalty’ Problem,” 33(3) Valparaiso University Law Review, 1999, pp. 907-946. Lawrence Zelenak, “Doing Something About Marriage Penalties: A Guide for the Perplexed,” 54 Tax Law Review, 2000, pp.1-76.
[104] The Annie E. Casey Foundation Kids Count Data Center, “Children in single-parent families by race in the United States,” https://datacenter.kidscount.org/data/tables/107-children-in-single-parent-families- by-race#detailed/1/any/false/1729,37,871,870,573,869,36,868,867,133/10,11,9,12,1,185,13/432,431. Gretchen Livingston, “The Changing Profile of Unmarried Parents,” Pew Research Center. April 2018. https://www. pewresearch.org/social-trends/2018/04/25/the-changing-profile-of-unmarried-parents/. Terry-Ann Craigie, Samuel L. Myers, Jr., and William A. Darity, Jr., “Racial Differences in the Effect of Marriageable Males on Female Headship,” 84(3) Journal of Demographic Economics, 2018, pp. 231-256. https://www.ncbi.nlm. nih.gov/pmc/articles/PMC6136656/. William A. Darity, Jr. and Samuel L. Myers, Jr., “Family Structure and the Marginalization of Black Men: Policy Implications,” Belinda M. Tucker and Claudia Mitchell-Kernan (Eds.). New York, Russell Sage Foundation, 1995. pp. 263-308. Chrishana M. Lloyd, Marta Alvira-Hammond, Julianna Carlson, and Deja Logan, “Family, Economic, and Geographic Characteristics of Black Families with Children,” Child Trends. March 2021. https://www.childtrends.org/wp-content/uploads/2021/02/ FamilyEconomicGeographicCharacteristics_ChildTrends_March2021.pdf. William Darity Jr., Darrick Hamilton, Mark Paul et al., “What We Get Wrong About Closing the Racial Wealth Gap,” Samuel DuBois
[105] “Targeted Fines and Fees Against Communities of Color: Civil Rights and Constitutional Implications,” U.S. Commission on Civil Rights. September 2017. https://www.usccr.gov/pubs/docs/Statutory_ Enforcement_Report2017.pdf.
[106] Jared Walczak, “Local Income Taxes in 2019,” Tax Foundation. July 2019. https://taxfoundation.org/ local-income-taxes-2019/.
[107] Hunter Blair, David Cooper, Julia Wolfe, et al., “Preempting progress: State interference in local policymaking prevents people of color, women, and low-income workers from making ends meet in the South,” Economic Policy Institute. September 2020. https://www.epi.org/publication/preemption-in-the- south/.
[108] “City of Portland now administering new tax programs for Metro and Multnomah County,” Metro News. April 2021. https://www.oregonmetro.gov/news/metro-multnomah-county-and-city-portland-stand- new-tax-programs.