Earlier this year, the Institute on Taxation and Economic Policy (ITEP) published the seventh edition of our flagship report, Who Pays? A Distributional Analysis of the Tax Systems in all 50 States. The study is a comprehensive overview of state and local taxes and makes a case for why it’s time to rethink tax policy in most states.
Nearly every state (41 of 50) taxes the top one percent of taxpayers at lower rates than working- or middle- class families. In large part this is because many states rely heavily on regressive sales and excise taxes without sufficiently strong graduated personal income taxes or refundable credits. Some state policymakers want to go even further down that road with even deeper cuts to the taxes that are paid by high-income households, like personal and corporate income taxes – cuts that are often offset by increases in taxes paid by working families.
This regressive approach—common throughout the country and in states with different politics—is due for serious revision. It results in tax policies that serve the interests of the highest income residents, rather than meeting the broad needs of families and communities.
Fortunately, there are many policy options that push instead toward fairness and more broadly shared prosperity – and clear examples of these policies doing just that in states around the country.
There are also multiple other promising tax options that have been considered or passed in some places but that policymakers, sometimes under pressure from moneyed interests, have not broadly pursued. Some of these would lead to big gains in tax fairness. These include better corporate taxation, higher taxation of income from capital gains, stronger inheritance or estate taxes, and more.
In a new chart book, Fairness Matters, we further explore our Who Pays? data with new graphics that reinforce the findings in the main report and demonstrate how state-level tax decisions shape economic divides for better and worse.
For example, in Figure 3 of the chart book we looked at the total share of income for each income quintile before and after state and local taxes.
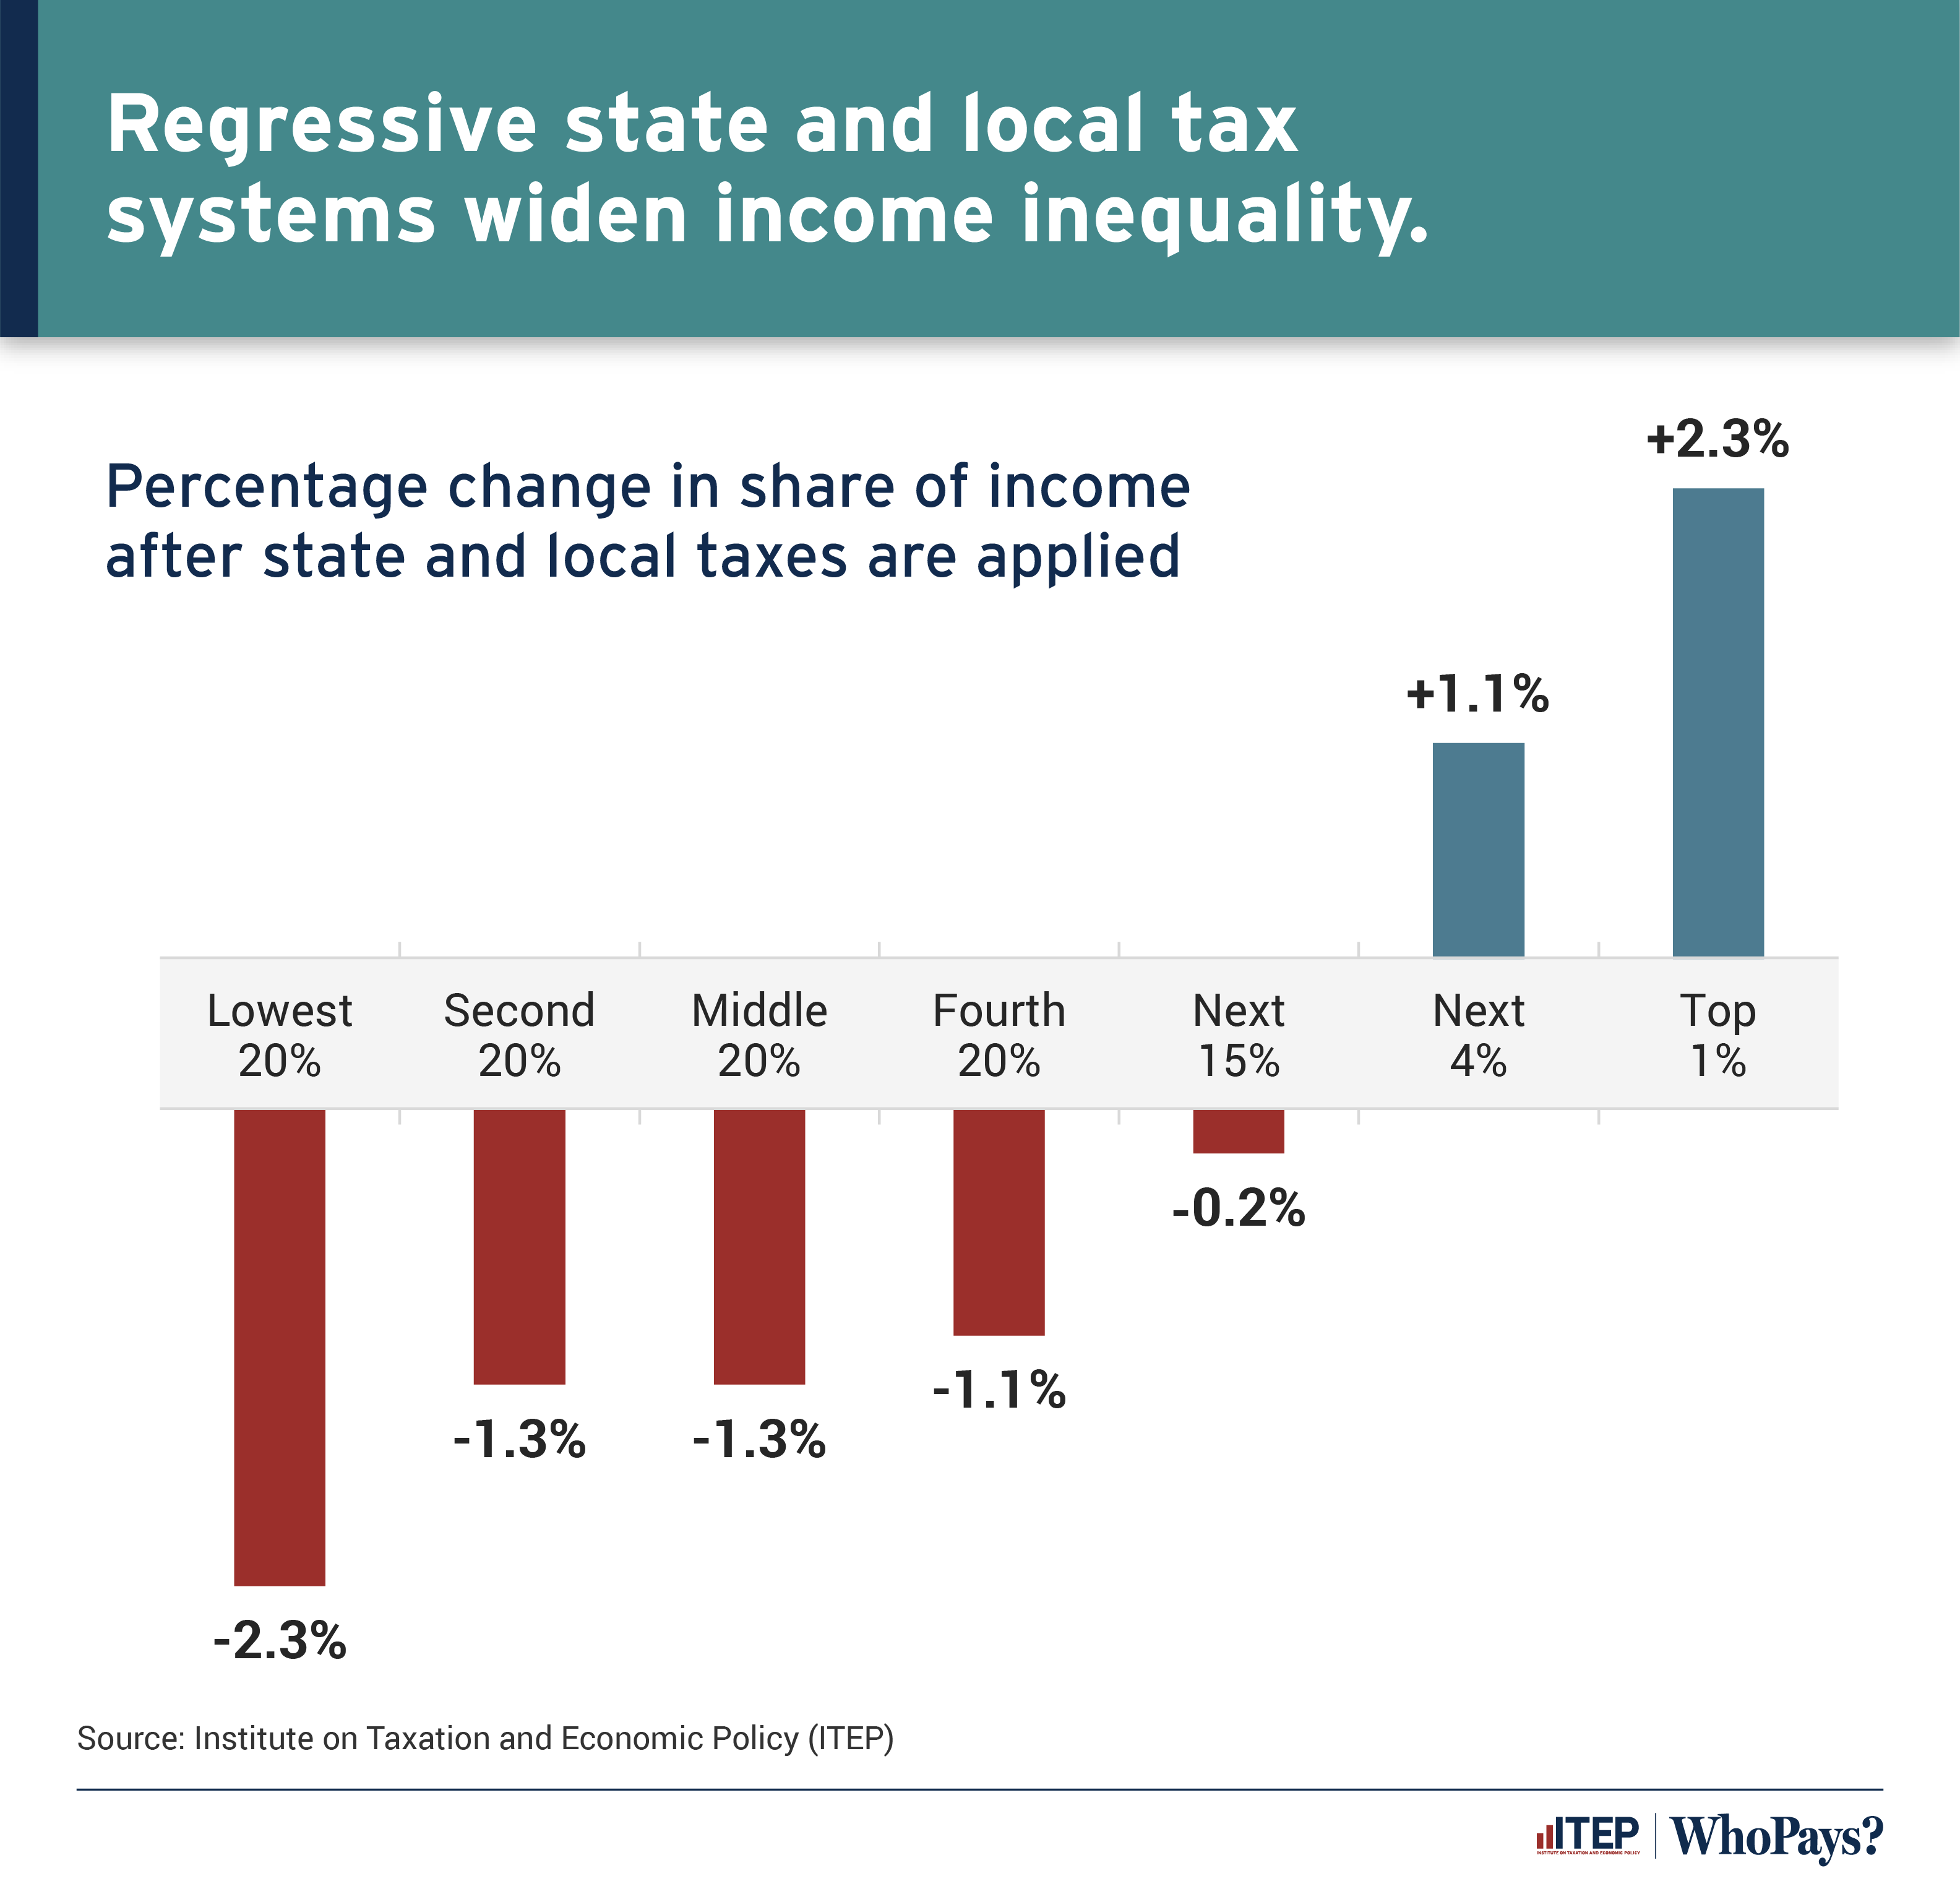
Because families with modest incomes pay above average state and local taxes, their share of total income declines after taxes are collected. In fact, the share of total income of low-income families declines by 2.3 percent while the highest one percent see their share of income increase by about the same percentage. This phenomenon results in widened inequality.
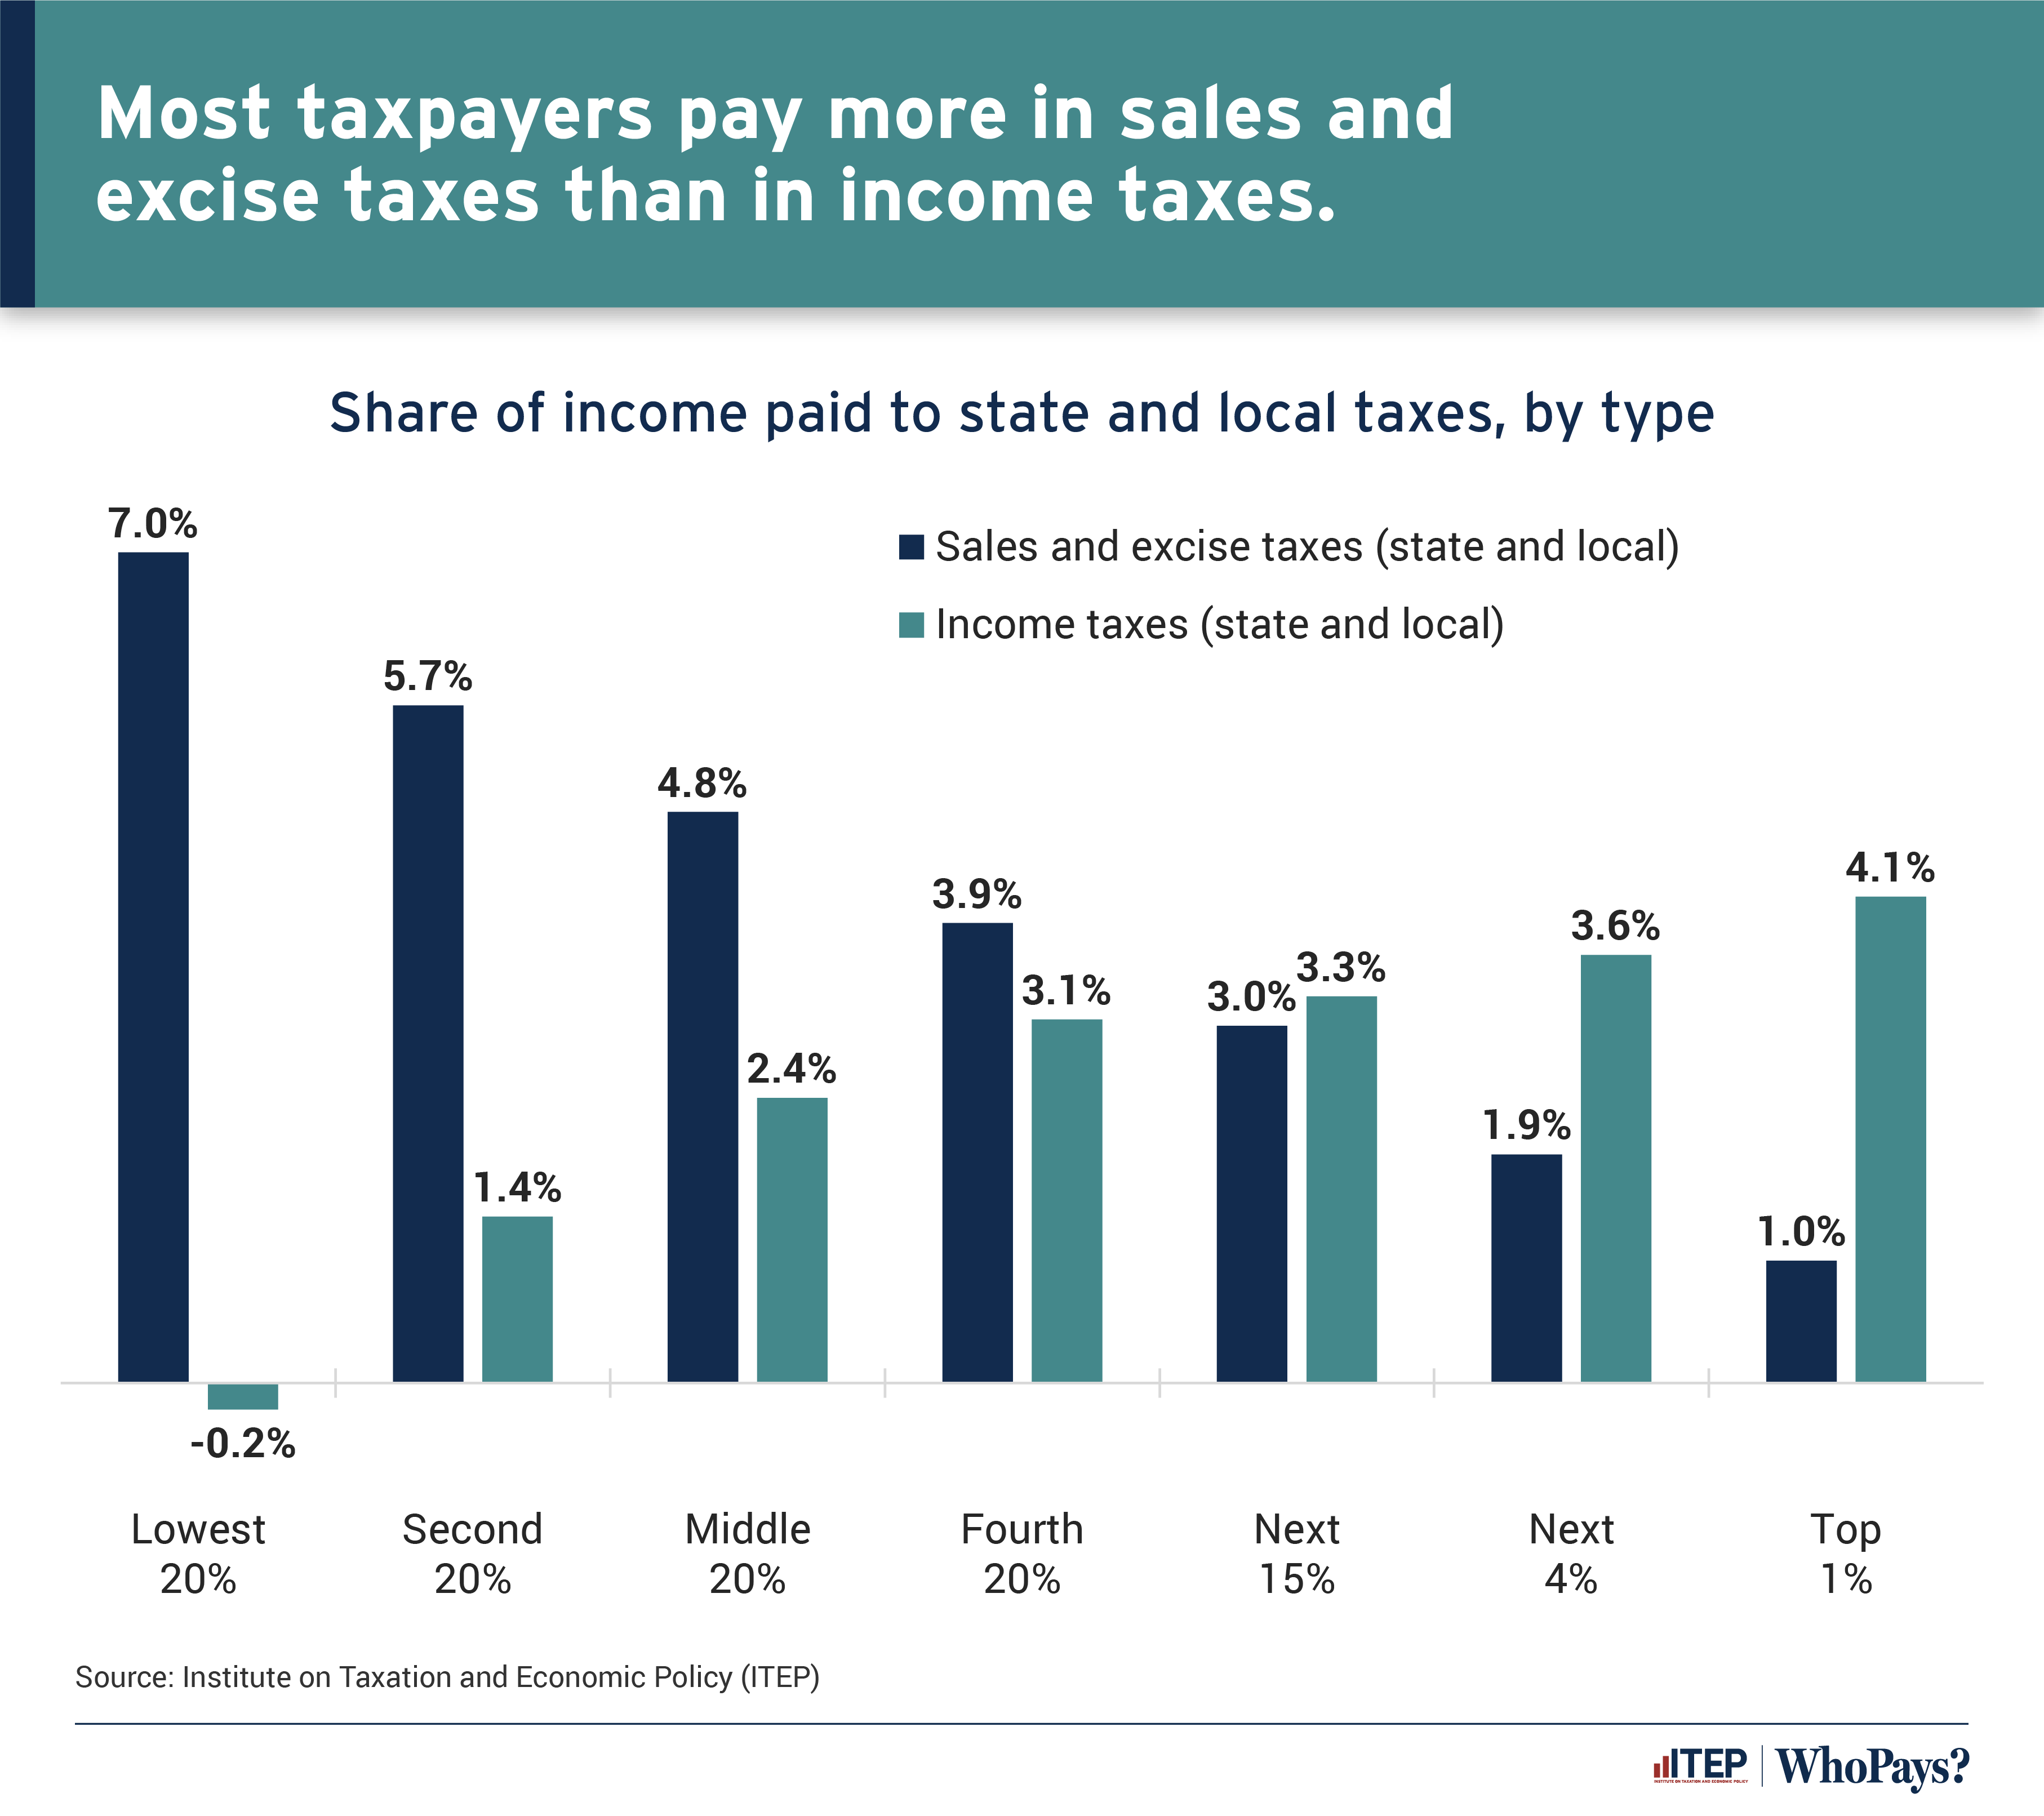
Although debates about state and local taxes often focus on personal income taxes, Figure 4 shows that for most families the largest share of state and local taxes are sales and excise taxes. On average, even for families in the fourth quintile of income, sales and excise taxes outweigh income taxes. These sales and excise taxes contribute to another major finding of Who Pays?: states with low average taxes overall tend to be only “low tax” for the rich.
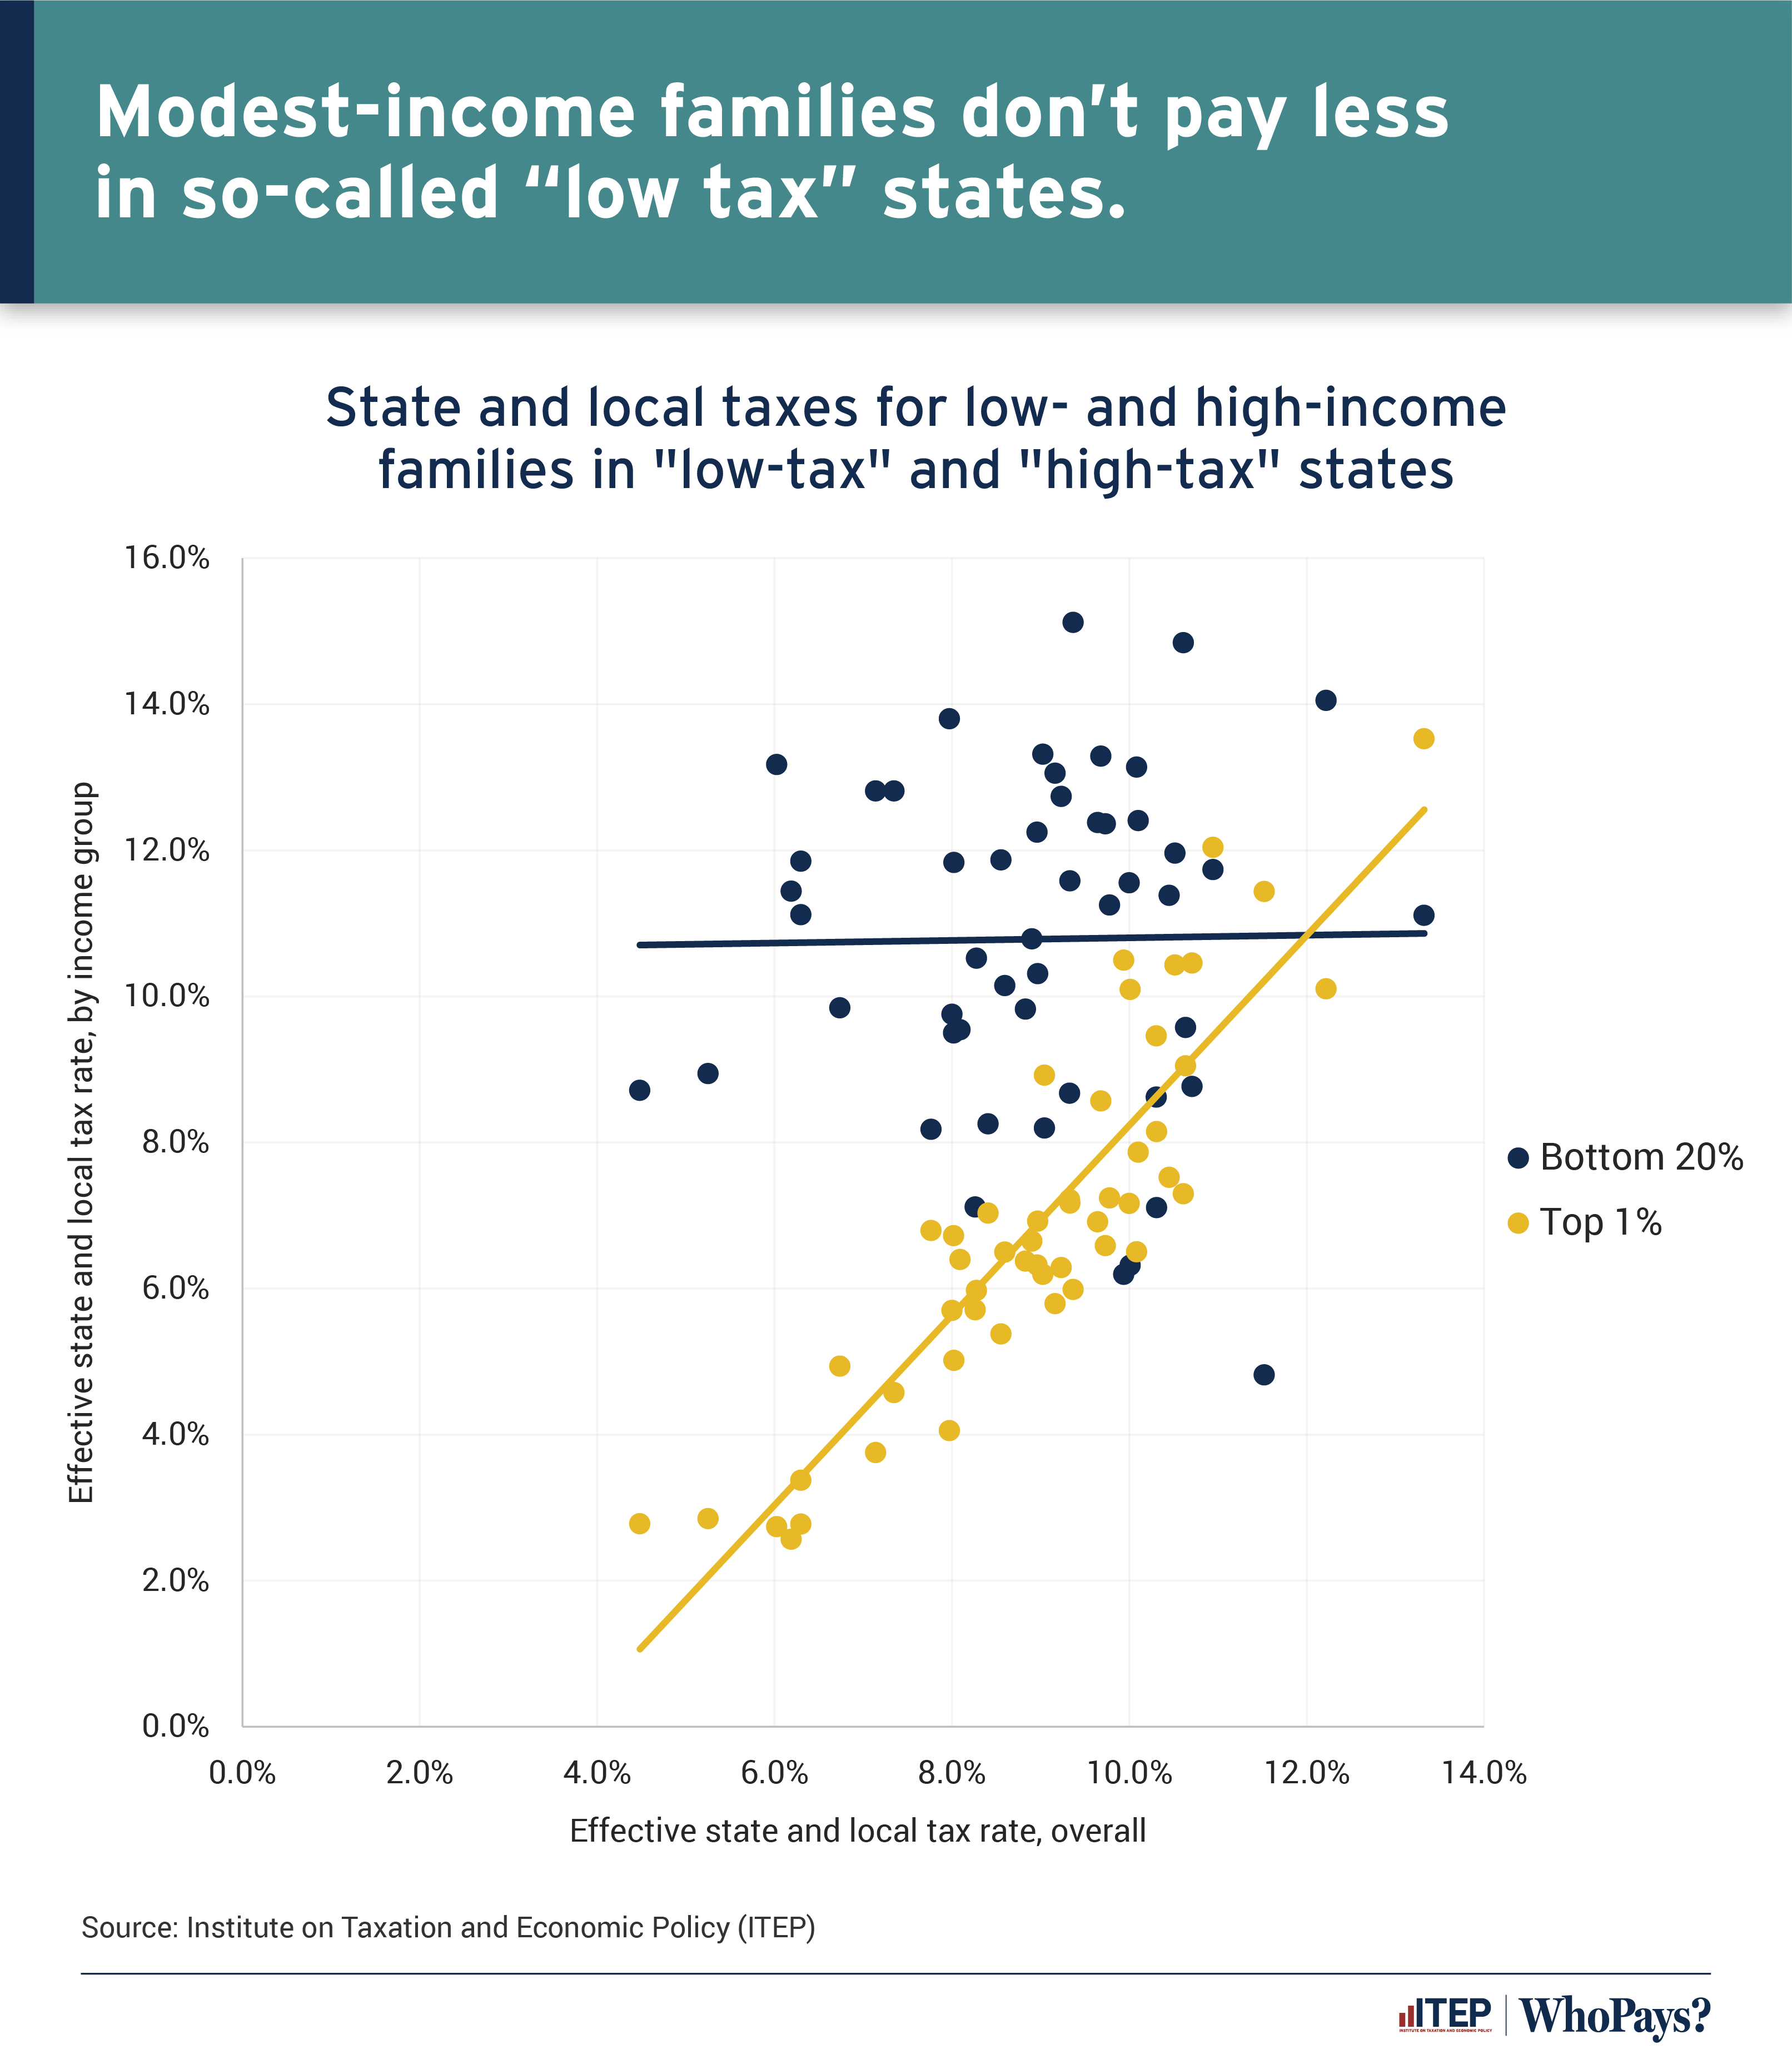
This unfortunate dynamic is demonstrated by Figure 8. One would expect that the “low tax” states are low tax for everyone, but as the graph shows, this is not the case. For the rich (yellow dots), the relationship is clear; lower overall taxes mean high earners pay less. But for those with modest means (blue dots), there is no statistically significant relationship. In other words, states that are “low tax” on average generally achieve that low average by prioritizing extremely low taxes for their richest residents while taxing low-income families just as highly as other states.
The unavoidable conclusion is that states with low overall taxes have set up their system so that those most able to pay are responsible for the least while the working class pays to fund our shared priorities.
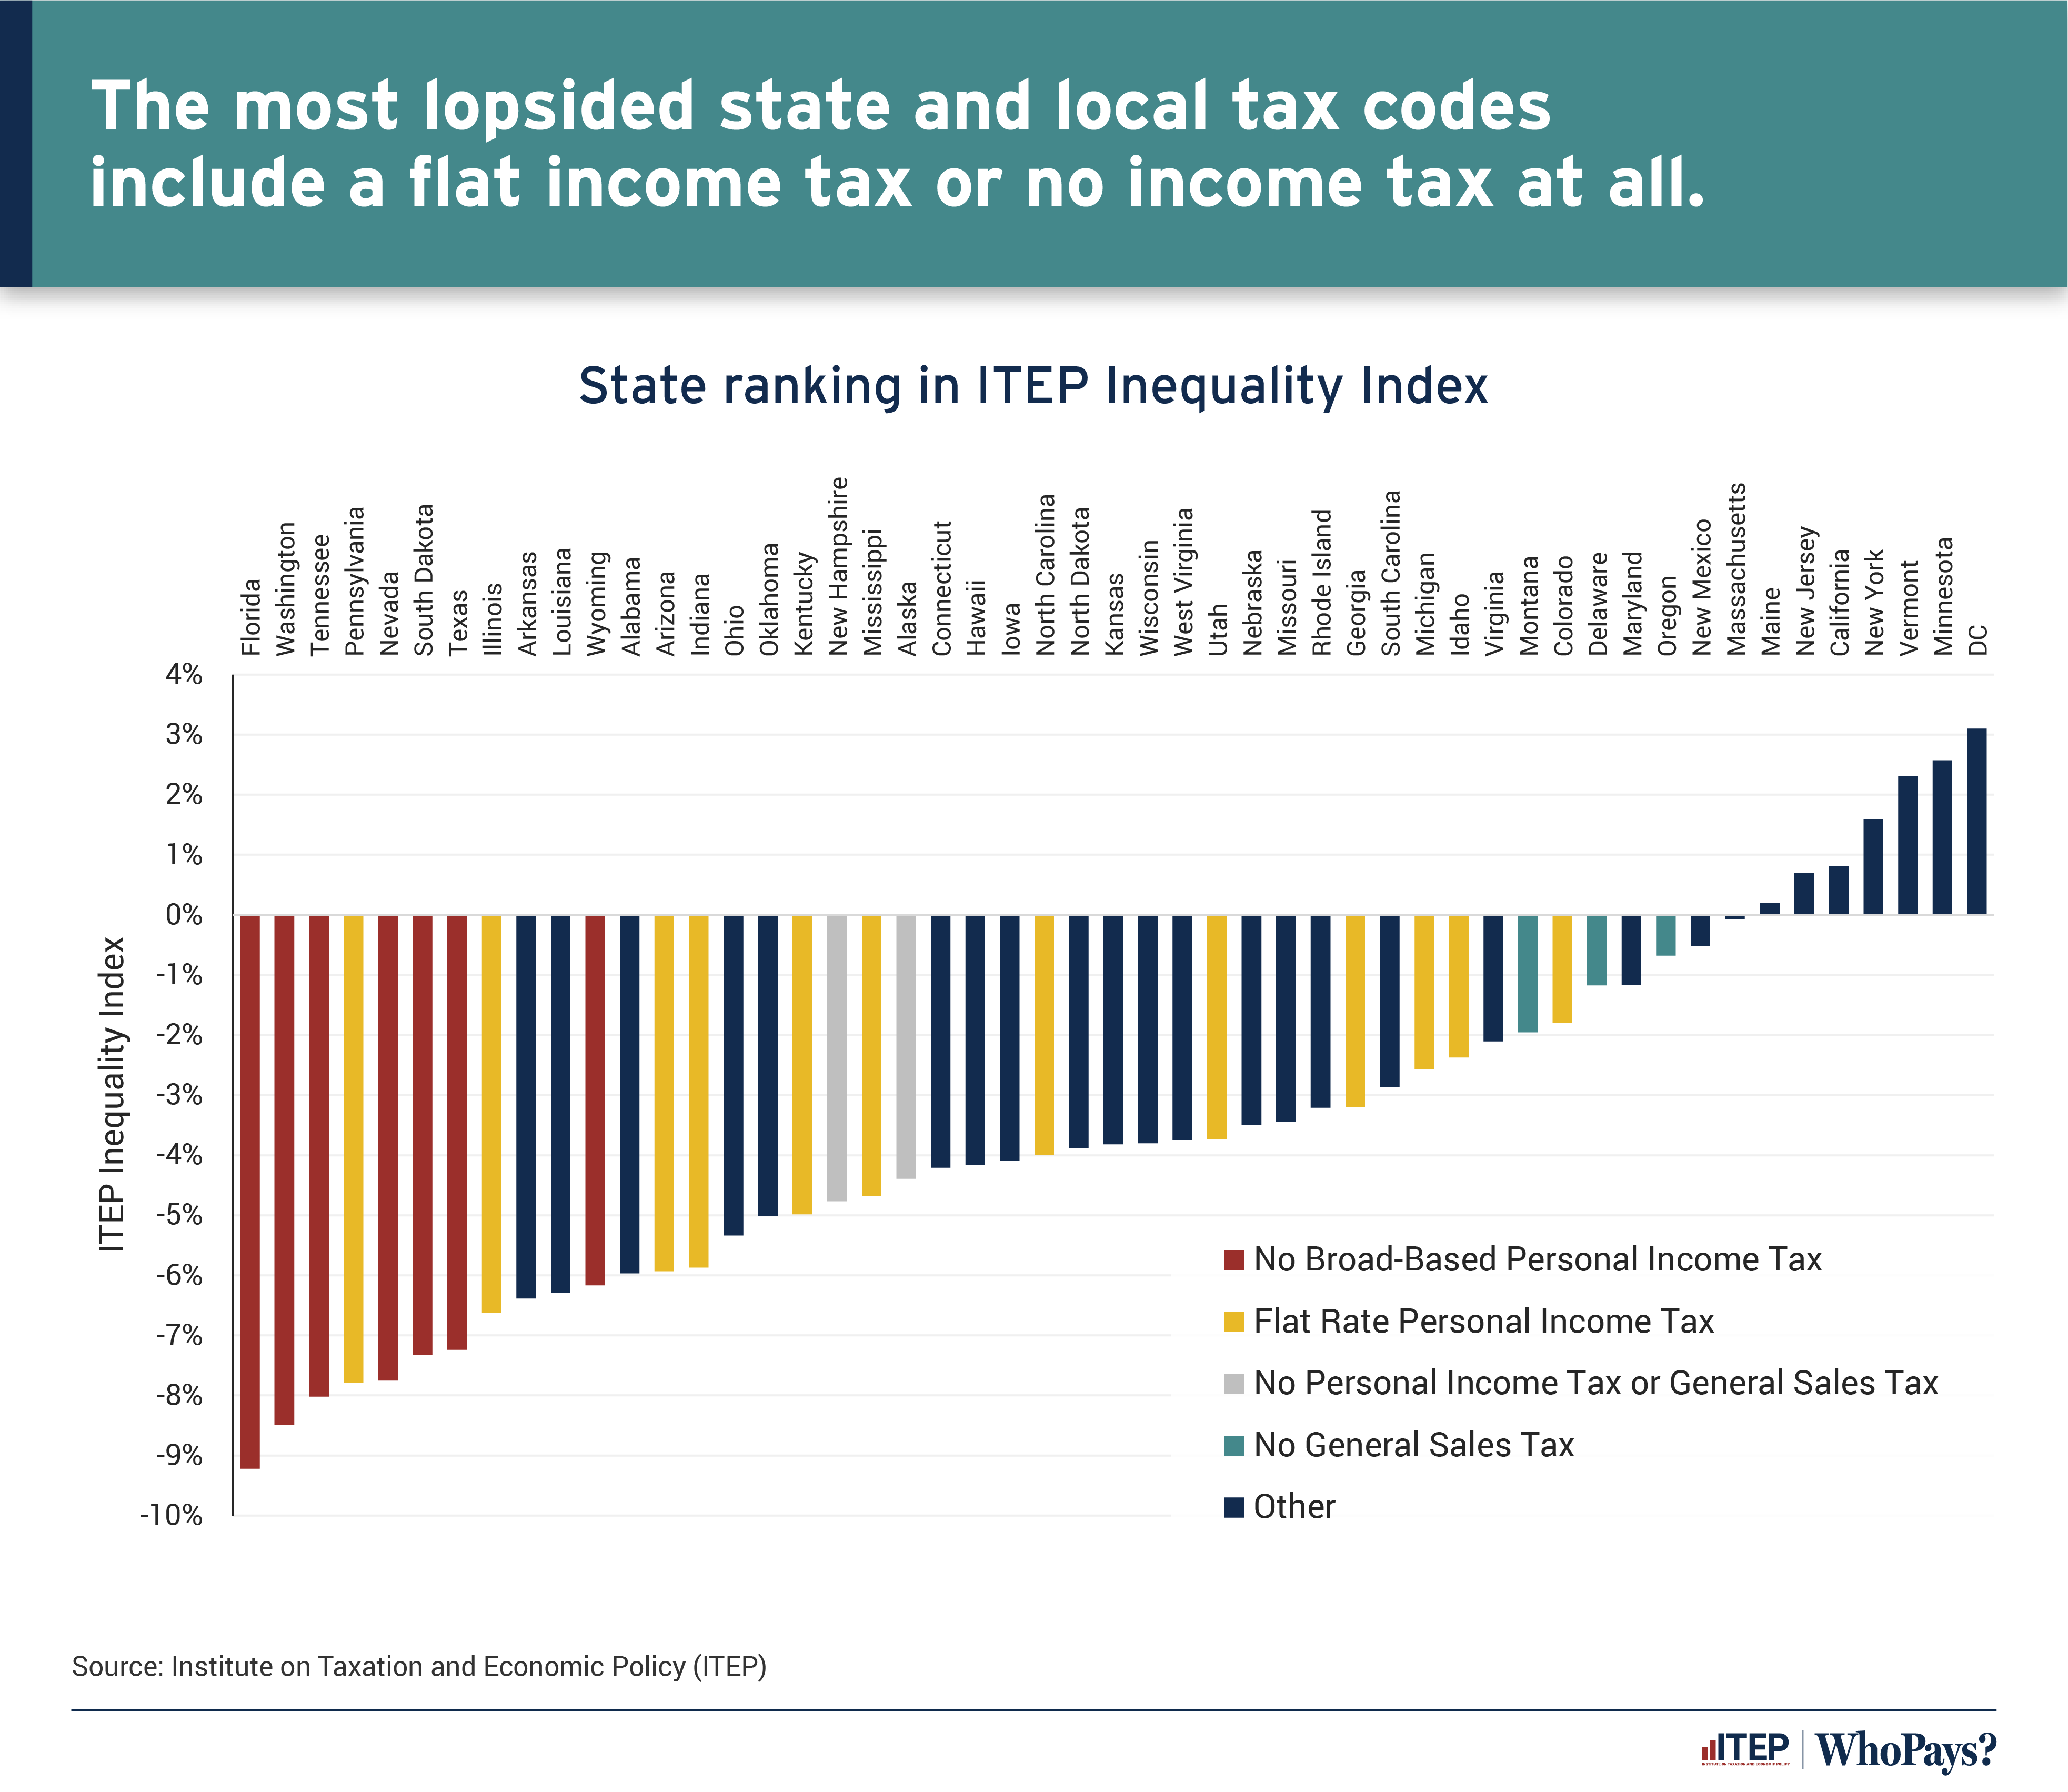
Figure 12 demonstrates that a major key to achieving a more fair tax code is a robust personal income tax with refundable credits. Eight of the 10 most regressive state tax codes levy either a flat income tax or no personal income tax at all, while the states with the least regressive tax codes, and all those whose codes are somewhat progressive, have a graduated personal income tax and a diverse set of revenues.
The full chart book includes even more.