States without personal income taxes lag behind states with the highest top tax rates
Read Report in PDF (Includes Full Appendix)
EXECUTIVE SUMMARY
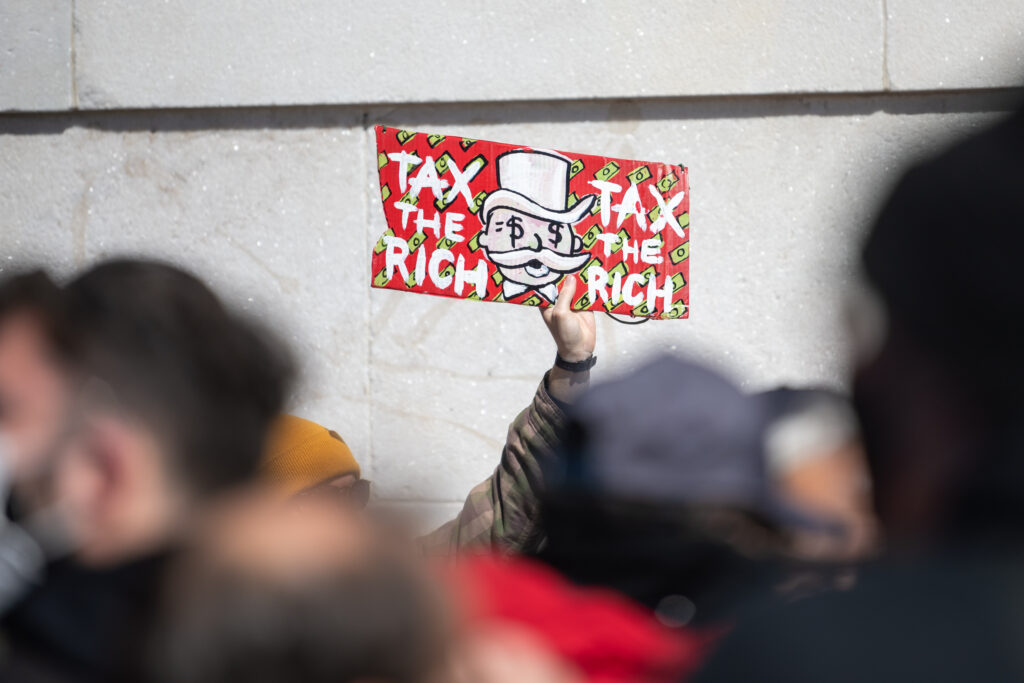
Lawmakers who support reducing or eliminating state personal income taxes typically claim that doing so will spur economic growth. Often, this claim is accompanied by the assertion that states without income taxes are booming, and that their success could be replicated by any state that abandons its income tax. To help evaluate these arguments, this study compares the economic performance of the nine states without broad-based personal income taxes to their mirror opposites—the nine states levying the highest top marginal personal income tax rates throughout the last decade.
The study’s broad finding is that the states with the highest top tax rates are experiencing more favorable economic conditions than the states without income taxes. While this finding does not indicate that higher income tax rates necessarily cause economic growth, it does call into question the notion that cutting or abandoning state income taxes leads to a clear improvement in state economies.
More specifically, the study finds that:
- States levying the highest top personal income tax rates are experiencing faster economic growth than states without such taxes. This is true of growth in the overall size of these states’ economies and, more importantly, of economic growth per person over the last decade (2006-2016).
- Average incomes are growing more quickly in the states with the highest top tax rates. Per capita personal income and disposable per capita personal income both grew more rapidly in these states over the last decade. Per capita personal consumption growth is also more robust in the states with the highest top tax rates.
- Residents of states with the highest top income tax rates are more likely to have a job than people living in states lacking income taxes. Compared to states without income taxes, a larger share of people in their prime working years (ages 25 to 54) has found work in the states levying the highest top tax rates. Additionally, under a wide range of measures, the unemployment rate is lower in the states with the highest top income tax rates.
- Rapid population growth in the states without personal income taxes has not resulted in an improvement in economic well-being for the typical resident of those states. While some measures of aggregate growth are more favorable in the states without income taxes (e.g., total number of jobs and total dollars of income earned within a state’s borders), these are primarily indications of a growing population and offer very little insight into how these states’ residents are faring. In fact, job growth has lagged significantly behind population growth in the states without personal income taxes, contributing to larger increases in their unemployment rates, and smaller increases in average incomes, relative to what has occurred in the states with the highest top tax rates.
- While the alleged economic benefits of refusing to levy a personal income tax do not appear to have materialized, the negative impacts of this decision on taxpayers struggling to make ends meet are clear. Relative to the states with the highest top income tax rates, states without personal income taxes levy higher overall taxes on the poor, due largely to their heavy reliance on regressive sales and excise taxes to fund public services. High-income taxpayers, by contrast, are the largest beneficiaries when states refuse to levy personal income taxes.
INTRODUCTION
Advocates of cutting state personal income taxes almost always argue that those cuts will foster 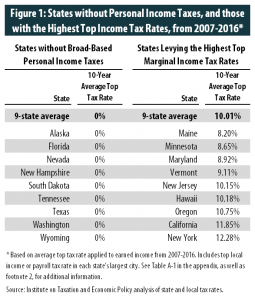 meaningful economic growth. But the academic evidence does not support this claim, and the experience of states that have recently pursued this strategy has been mixed at best.[1] To help evaluate the economic significance of state income taxes, this study compares the economic performance of the nine states without broad-based personal income taxes to their mirror opposites regarding income tax policy—the nine states levying the highest top marginal personal income tax rates throughout the last decade.
ANALYTICAL FRAMEWORK
Teasing out the impact of state tax policy on state economies is a daunting task. One reason is that differences in tax rates between states are often quite small, and small differences in policy are unlikely to lead to measurable differences in economic performance.
The research design employed in this study attempts to deal with this issue by focusing on the states that are most dissimilar in their income tax policies. As seen in Figure 1, the two groups of states in this study saw an average gap of roughly 10 percentage points in their top marginal income tax rates over the last decade (Table A-1 in the appendix provides additional detail).[2]
But there are still limitations to this approach. For instance, this framework does not control for differences across states unrelated to taxes such as industry mixes, natural resource endowments, tourism advantages, federal spending patterns, geography, and climate. For this reason, care should be taken not to read too deeply into these state comparisons. Tax policy is not the only factor contributing to differences in economic performance between these groups.
Nonetheless, the comparisons in this study are still useful for evaluating claims that the states without income taxes are booming, and that changes in income tax policy can result in dramatic changes in a state’s economic trajectory. If a 10-percentage point difference in top income tax rates cannot provide a clear economic advantage to the states without income taxes, what hope does a more modest income tax rate change of a few percentage points have of producing such a result?
This analytical framework is also valuable for evaluating the tax-cutting arguments of many supply-side lawmakers, advocates, and economists for another reason: it has been used repeatedly in the American Legislative Exchange Council’s (ALEC) “Rich States, Poor States” series of reports.[3] In nine studies released since 2007, ALEC compared the economic performance of the nine states without income taxes to the nine states with the highest top marginal tax rates throughout the previous decade. We have structured our analysis to be very similar to ALEC’s.
As in ALEC’s studies, we grouped states according to their top marginal state and local tax rates applying to earned income in each state’s largest city.[4] It is important to note, however, that top marginal tax rates are only part of what define state income tax systems.[5] While the top tax rate only applies to a relatively small number of the highest-income taxpayers in most states, it carries an outsized importance in the worldview of supply-side adherents who tend to focus their attention on the incentive (or disincentive) faced by high-income “job creators” to work and invest. For instance, Arthur Laffer, a supply-side economist and “Rich States, Poor States” co-author, recently said that “everyone knows that the highest marginal income tax rate is a killer for economic growth.”[6]
We also adhere to ALEC’s methodology in calculating averages across groups of states without regard to each state’s relative size. This allows the experience of small states to inform our results in the same manner as the experience of large states. Weighting our results by population or any other measure of size, by contrast, would cause our findings to be driven by the economic performance of a very small number of states, most notably California, Texas, Florida, and New York.
Finally, we follow ALEC’s practice of focusing on economic growth over the most recent ten-year period for which data are available. In practice, this means that growth throughout most of this report is measured relative to 2006, just prior to the onset of the Great Recession, and is influenced both by the recession itself and by the robustness of each state’s economic recovery.
The one major area in which we depart from ALEC’s framework is in our choice of emphasis on specific economic measures. Since first being published, the “Rich States, Poor States” series has at various times deployed eleven different measures of economic performance.[7] Over time, ALEC has whittled down this list to just a handful of measures that are all closely related to population trends. As explained in this report, population growth is not a reliable indicator of the actual economic conditions being faced by a state’s residents. As a result, we place a greater emphasis on measures of economic well-being such as economic growth per person, average incomes, and the rates of employment and unemployment in each state. While ALEC chooses to downplay the importance of these measures today, most of them were included in at least one edition of the organization’s “Rich States, Poor States” reports.
ECONOMIC GROWTH
Buoyed by a surge in energy prices, it was not long ago that energy-dependent states without income taxes such as Alaska and Wyoming experienced economic growth far greater than what was occurring in other parts of the country. Supply-side economists such as Arthur Laffer exploited this phenomenon to claim that the absence of income taxes was driving growth in these states.[8] But now that energy prices have fallen from their historic highs, so have these states’ rates of economic growth.
Over the last decade, the nine states with the highest top income tax rates have seen faster economic growth than the nine states without income taxes. As seen in Figure 2, this is true both on an aggregate level and on a per-person basis.
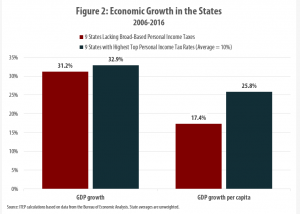
Moreover, the 41 states with broad-based personal income taxes have also grown more quickly on average than the nine states without such taxes. Table A-2 in the appendix provides a comparison of growth rates in all three groups of states over the last decade.
INCOME GROWTH
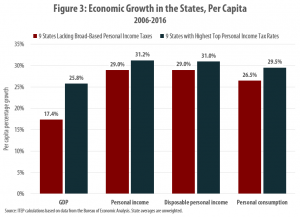
Average incomes are also growing more rapidly in the states with the highest top income tax rates, as measured by per capita personal income in Figure 3. Even after considering the impact of income and property taxes on residents’ take-home pay, the states with the highest top income tax rates are seeing faster income growth than the states without such taxes; per capita disposable personal income and per capita spending are also growing more quickly in the nine states with the highest top tax rates.[9]
Additional information on income and consumption growth over the last decade in states with and without income taxes is available in Table A-2 in the appendix. This table reveals that the 41 states with broad-based personal income taxes are also outperforming the nine states without such taxes in regard to both income and consumption growth.
EMPLOYMENT
The availability of jobs is a central component of states’ economic performance and a key concern of state lawmakers. As the following discussion shows, the residents of the states with the highest top tax rates are more likely to find employment than the residents of states without income taxes. This is indicated by both the prime-age employment rate and various measures of the unemployment rate.
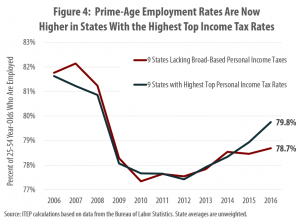
Prime-age employment
The prime-age employment rate is a simple but powerful measure of the health of a state’s job market. This measure captures the share of each state’s population in its prime working years (defined as ages 25 to 54) that is currently employed. An employment-to-population ratio of this type is not susceptible to a major shortcoming of more familiar unemployment rates: their tendency to undercount the true unemployed population by excluding discouraged workers whose job prospects are so bleak that they have stopped searching for work entirely.[10]
As seen in Figure 4, a larger share of working age residents has jobs in the states with the highest top tax rates (79.8 percent) relative to the states without such taxes (78.7 percent). While this has not always been the case, recent labor market trends are noticeably more favorable in the states with the highest tax rates. The states with the highest top tax rates weathered the recession with a slightly smaller drop in their prime-age employment rates and experienced a more robust recovery following the recession’s end.
Additional data on prime-age employment rates by state are available in Table A-3 in the appendix.
Unemployment rates
While the prime-age employment rate arguably offers a better assessment of the ability of a state’s residents to find a job, the superior labor market performance of the states with the highest income tax rates can also be seen by comparing unemployment rates across states.
Figure 5 provides a snapshot of unemployment rates, as of 2016, across both groups of states. Deciding how to define “unemployment” is somewhat subjective, and thus the Bureau of Labor Statistics (BLS) publishes more than one measure of unemployment.[11] Under a range of measures of unemployment, the states with the highest top tax rates are currently outperforming the states without such taxes.
The rates depicted above include:
- The U-3 unemployment rate: This is the official unemployment rate. It counts people as unemployed if they are out a job, available to work now, and have actively searched for work within the past four weeks;
- The U-5 unemployment rate: This is similar to the U-3 unemployment rate, but it counts people as unemployed if they have searched for work at any point within the past year (as opposed to just the last four weeks). The U-5 unemployment rate therefore at least partially corrects for the problem posed by jobless workers dropping out of the labor force;
- The U-6 unemployment rate: This is the highest unemployment rate; it is calculated in the same manner as the U-5 rate, except that it also counts workers as “unemployed” if they are stuck in part-time jobs (less than 35 hours per week) when they want full-time work. These people are typically referred to as “involuntary part-time workers;”
- A modified version of the U-6 unemployment rate: This is the same as the U-6 unemployment rate, but we have adjusted it to improve its treatment of part-time workers. Instead of counting these workers as simply employed or unemployed, we take a more nuanced approach under which they count as part employed and part unemployed.[12]
Also of note is the rate of involuntary part-time employment, which measures the share of the workforce stuck in part-time jobs when they want full-time ones. These rates were roughly equal across both groups of states in 2016, with the states without income taxes performing only slightly worse (3.9 percent) than the states with the highest top tax rates (3.8 percent).
Additional data on state unemployment and involuntary part-time employment rates are available in Table A-4 in the appendix. Those data reveal that the states without income taxes are lagging behind not just the states with the highest top income tax rates, but also the larger group of 41 states with broad-based personal income taxes of any level.
POPULATION GROWTH
Supply-side advocates such as ALEC and Arthur Laffer often claim that rapid population growth in states without income taxes is an indication of superior economic performance. But while these states are adding to their populations at above-average rates, there is scant evidence that tax rate differentials are driving this growth.[13] Moreover, as the economic measures presented throughout this report make clear, a growing population has not translated into improved economic well-being for the residents of states without income taxes.
Population and other aggregate measures do not depict actual economic well-being
While population growth is sometimes confused with economic progress, the reality is that simply increasing the number of people living in a state will not necessarily improve the job prospects, incomes, or overall quality of life for that state’s residents. For this reason, it is inappropriate to focus on population growth—and a host of variables strongly influenced by population growth—as a gauge of economic health.
Tallying up the total number of people employed within a state, the total amount of personal income earned, the total number of tax dollars collected, or even the total size of the economy (GDP) does very little to illuminate whether ordinary families are getting ahead. Controlling for population growth, as this study does by examining average incomes and unemployment rates, is important for understanding how real people are faring in practice.
The following examples make this clear.
- Among states without income taxes, total population growth has averaged 11.9 percent over the last decade, compared to 5.6 percent in the states with the highest top tax rates (see Table A-2 in the appendix). Over this same period, both groups of states also added jobs, with the no-tax states seeing 7.1 percent aggregate growth in employment and high-rate states seeing 4.6 percent growth. While the no-tax states saw more population and aggregate job growth over this period, the more significant finding is that the no-tax states have struggled to add jobs at a rate sufficient to keep pace with their growing populations. Employment growth (7.1 percent) trailed population growth (11.9 percent) by roughly 41 percent in the no-tax states, compared to 19 percent in the states with the highest top tax rates. This finding helps explain why the states without income taxes have seen larger increases in their unemployment rates, and larger decreases in their prime-age employment rates, than the states with the highest top tax rates over the last decade.
- Total personal income has also grown more quickly in the no-tax states (44.2 percent) than in the states with the highest top tax rates (38.6 percent). Because the no-tax states added significantly more people to their ranks over the last decade, it would be shocking indeed if the total amount of income reported within these states’ borders had not grown substantially. But while population growth in the states without income taxes was roughly double the growth seen in the states with the highest top tax rates, aggregate income growth over this same period was just 15 percent higher. The unavoidable result of this mismatch can be seen in Figure 3 earlier in this report, with average incomes growing more slowly in the states without income taxes than in the states with the highest top tax rates. To phrase the problem somewhat differently: the residents of states without income taxes are seeing smaller increases in their average take home pay, but summing their incomes across the entire state’s population (as ALEC does) creates the misleading impression that incomes are growing quickly simply because there are more people today than in the past.
The first few editions of ALEC’s “Rich States, Poor States” report included comparisons across states under a wide range of economic measures, but over time that list has been whittled down to just a few measures that reliably favor the states seeing the most population growth.[14] This is a strategically useful decision for ALEC, since it happens to portray states without income taxes in a positive light. But population growth is not an end in itself, and state residents care far more about their incomes and job prospects than about the number of people who happen to live in their state.
What is driving population trends?
Putting aside the problems with using population growth as a gauge of economic health, ALEC’s claim that higher rates of population growth can be attributed to the lack of personal income taxes is highly suspect. In the vast majority of cases, the differences in income tax rates between states are simply too small to provide a compelling rationale to uproot one’s life. Other financial, familial, and lifestyle concerns can easily swamp whatever income tax savings could be realized by moving to a state without an income tax. It should therefore come as little surprise that a detailed review by the Center on Budget and Policy Priorities concludes that “differences in tax levels among states have little to no effect on whether and where people move.”[15]
More recently, researchers at Stanford University and the US Treasury Department studied the migration patterns of the nation’s millionaires—the group with the most to gain by not having to pay income taxes on their sizeable incomes.[16] The study found that “outside of Florida, differences in tax rates between states have no effect on elite migration. Other low-tax states, such as Texas, Tennessee, and New Hampshire, do not draw millionaires from high-tax states.” In other words, Florida is the only one of the nine states without broad-based income taxes that seems to possess any kind of special allure for high-income taxpayers. Given that reality, the study notes that “It is difficult to know whether the Florida effect is driven by tax avoidance, unique geography, or some especially appealing combination of the two.” In any case, this finding refutes the notion that repealing state income taxes can transform a state into a magnet for high-income taxpayers; it’s simply not playing out that way in eight of the nine states without such a tax.
Some proponents of cutting income taxes argue that the higher population growth enjoyed by states without income taxes isn’t driven by “tax rate shopping” (that is, moving to a state in order to pay less in taxes), but rather by the general economic pull that refusing to levy an income tax can create. Again, this argument fails to pass muster. The academic literature, the experience of states that have recently cut income taxes, and the evidence presented in this paper indicate that the absence of an income tax does not lead to meaningfully better economic conditions.[17]
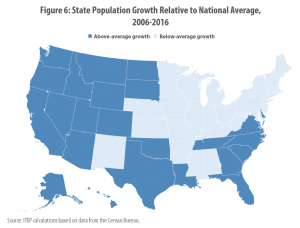
Instead, the growing populations of states without income taxes must be understood as part of a broader national migration toward the southern and western parts of the country. Twenty-two of the twenty-four states seeing above-average population growth over the last ten years are located in the South or West, with the (Midwestern) Dakotas providing the only exceptions. Similarly, six of the top twelve states are part of the so-called Sunbelt, known for having warm weather that even anti-tax advocates concede “clearly…make these states desirable locations.”[18] This ongoing southward and westward migration has disproportionately favored states without personal income taxes, since seven of those nine states happen to be located in the South or the West.
While the reasons for population trends are multifaceted, the availability of inexpensive housing is one undeniable draw. The median home price in states without income taxes is more than $100,000 cheaper than in the nine states with the highest top income tax rates.[19]
Moreover, some of the population growth advantage enjoyed by states without income taxes can be attributed to a simple difference in birth rates—not the conscious decision of adults to live in one place or another. The nine states without income taxes have an average birth rate that is 11 percent higher than in the states with the highest top income tax rates. And the largest of the no-tax states, Texas, has a birth rate 27 percent higher than the average “high rate” state.[20]
Whatever the reason for the nation’s southward and westward shift in population, it is clear that states without income taxes are not the only ones growing because of this trend. Utah, with a personal income tax rate of 5 percent, saw more population growth than any other state over the last decade. Similarly, South Carolina (top tax rate of 7 percent) saw faster growth than no-tax Florida while Idaho (top tax rate of 7.4 percent) saw more growth than no-tax Wyoming. All of the western states qualifying as “high rate” in this study (California, Hawaii, and Oregon) also saw population growth above the national average (none of the “high rate” states are located in the South).
TAX DISTRIBUTION
The alleged economic benefits of cutting or eliminating state income taxes are speculative at best. What is far more certain, however, is that such cuts can dramatically alter the distribution of state and local tax systems in ways that are detrimental to lower-income families
Low-income taxpayers
States without income taxes are not necessarily “low tax” states for everyone. Figure 7 shows that for lower-income taxpayers, the tax policy trade-offs required to forgo levying an income tax often result in higher taxes overall. Public services such as schools and roads must be paid for somehow, and in states without income taxes this typically means higher sales taxes, excise taxes, and property taxes. ITEP research has shown that these taxes tend to fall more heavily on lower-income families.[21] Largely as a result, the bottom twenty percent of households pay an average overall state and local tax rate equal to 10.0 percent of their incomes in the states with the highest top tax rates, compared to 10.7 percent in the states without income taxes.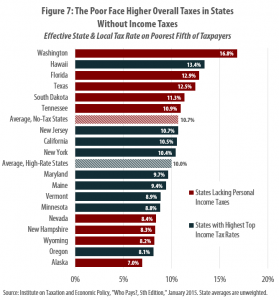
High-income taxpayers
For high-income families, state lawmakers’ decisions not to levy personal income taxes creates an inevitable windfall. Without exception, the lowest state and local tax rates in the nation for high-income taxpayers are confined to the nine states that do not levy personal income taxes.[22] 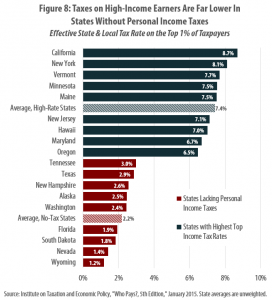
Figure 8 reveals that the states with the highest top tax rates collect 7.4 percent of their most affluent residents’ incomes, on average, in taxes. In the states without personal income taxes, the effective tax rate for this group is less than one-third that level, or 2.2 percent of income.
Overall distribution
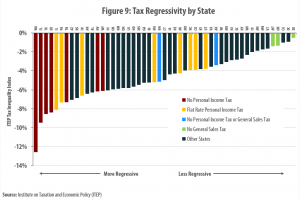
The tradeoffs required by states choosing not to levy personal income taxes can be seen clearly in the overall distribution of those states’ tax systems. The ITEP Tax Inequality Index measures the regressive nature of state and local tax codes, quantifying the degree to which those codes exacerbate income inequality.[23] As seen in Figure 9, five of the seven most lopsided state and local tax systems in the nation are in states without broad-based personal income taxes (Washington, Florida, Texas, South Dakota, and Tennessee). These states levy far higher rates on lower- and middle-income families than on their wealthiest residents.
CONCLUSION
While personal income tax cuts or outright repeal are often touted as ways to bolster state economies, the experience of states without such taxes does not provide compelling evidence for this claim. Over the last decade, economic growth in the states without income taxes has lagged behind growth in the states with the highest top personal income tax rates. Average incomes have also grown more slowly in the states without income taxes, and unemployment is currently higher. And because refusing to levy an income tax often requires higher sales and excise taxes to fund public services, low-income families often face a higher overall state and local tax rate in the states without income taxes.
The findings of this report do not suggest that higher state income tax rates are causing faster growth, but they do cast serious doubt on claims that cutting or eliminating income taxes will lead to dramatic, measurable differences in states’ economic trajectories. Proponents of such cuts overstate the impact that income taxes have on state economies, and underappreciate the economic importance of investments in education, infrastructure, and other public services that are funded with income taxes.
Appendix
See full appendix in PDF of this report
Endnotes
[1] Mazerov, Michael, “Academic Research Lacks Consensus on the Impact of State Tax Cuts on Economic Growth,” Center on Budget and Policy Priorities, Jun. 17, 2013, at https://www.cbpp.org/research/academic-research-lacks-consensus-on-the-impact-of-state-tax-cuts-on-economic-growth. Leachman, Michael and Michael Mazerov, “State Personal Income Tax Cuts: Still a Poor Strategy for Economic Growth,” Center on Budget and Policy Priorities, May 14, 2015, at https://www.cbpp.org/research/state-budget-and-tax/state-personal-income-tax-cuts-still-a-poor-strategy-for-economic.
[2] Most of the measures in this report are rooted in a timeframe of 2006-2016. Average tax rates over the 2007-2016 period were therefore used to determine the “highest rate” states because these are the years in which tax rates could potentially impact economic growth following the 2006 base period. Note that Kentucky and Maine had identical average top rates (8.2 percent) between 2007 and 2016, but that Kentucky is excluded from the “top nine” list for two reasons. First, its average yearly ranking (9.7 out of 50) was lower than Maine’s (9.1 out of 50). Second, its 8.2 percent rate was calculated using Louisville’s local tax rate, but most jurisdictions in the state levied lower local tax rates over this period (Maine’s 8.2 percent average rate applied statewide, as it lacks local income taxes).
[3] While there are ten editions of “Rich States, Poor States” in total, the most recent version was dramatically pared back and includes only state-specific fact sheets. All ten editions of the report are available at: http://www.richstatespoorstates.org/publication/.
[4] We have improved upon ALEC’s methodology, however, by examining the marginal tax rates over the entire period examined, rather than taking a simple snapshot of current tax rates. In ALEC’s studies, states are grouped according to their tax rates at the time of each study’s release, regardless of where those rates stood during the actual period of economic performance being studied. In the fifth edition, for example, the economic analysis spanned 2001 to 2010 but states were grouped according to their tax rates in effect more than a full year afterwards, in January 2012.
[5] There is a strong correlation between top income tax rates and other measures of state personal income tax size. For instance, an ITEP analysis of data from the Census Bureau and the Bureau of Economic Analysis reveals that the nine states with the highest personal income tax revenue collections, relative to their economies, include six of the nine “high rate” states in this report: Oregon, Minnesota, New York, California, Maine, and Hawaii. Under this measure, Vermont ranks 13th, Maryland ranks 15th, and New Jersey ranks 16th.
[6] Arthur Laffer interview on the Fox Business Network, Aug. 22, 2017.
[7] These include the following: GDP growth, GDP growth per capita, GDP growth per employee, personal income growth, personal income growth per capita, non-farm payroll employment growth, the unemployment rate, population growth, net domestic in-migration, state tax revenue growth, and state and local tax revenue growth.
[8] For one of many examples, see Table 4 in: Laffer, Arthur, et al., “Rich States, Poor States,” 4th Edition, Nov. 15, 2011, at https://www.alec.org/publication/rsps-2011/. In this table, Alaska is reported as enjoying overall economic growth roughly 70 percent above the national average while Wyoming’s growth is 155 percent above average. These energy-driven outliers were significant enough to change the table’s results for three of the six measures examined.
[9] “Disposable personal income” does not account for the amount that households pay in state and local sales taxes. Notably, the exclusion of sales taxes biases this measure in favor of the states without income taxes because these states are more reliant on sales taxes than the states with personal income taxes. For example, see Appendix C of: Davis, Carl, et al., “Who Pays, A Distributional Analysis of the Tax Systems in All 50 States, 5th Edition,” Institute on Taxation and Economic Policy, January 2015.
[10] This tendency to discount discouraged workers has been of special relevance in recent years. Following the 2008-2009 recession, there was a tremendous spike in long-term unemployment; the number of people unemployed six months or longer went from 1.2 million in 2006 and 2007 to 6.8 million by April of 2010. For discussion of how this has led to a downward bias in the official unemployment rate, see: Buffie, Nick, “Millions of Americans Are Still Out of Work,” Center for Economic and Policy Research (CEPR) Blog, Nov. 2016, at http://cepr.net/blogs/cepr-blog/millions-of-americans-are-still-out-of-work. Krueger, Alan, Judd Cramer, and David Cho, “Are the Long-Term Unemployed on the Margins of the Labor Market?,” Brookings Papers on Economic Activity, Spring 2014, at https://www.brookings.edu/wp-content/uploads/2016/07/2014a_Krueger.pdf. Fremstad, Shawn, “Men ‘Not in the Labor Force’ Are a Lot Like Unemployed Men,” CEPR Blog, Sept. 2017, at http://cepr.net/blogs/cepr-blog/men-not-in-the-labor-force-are-a-lot-like-unemployed-men.
[11] Data and descriptions of the BLS’ various unemployment rates are available at https://www.bls.gov/webapps/legacy/cpsatab15.htm and https://www.bls.gov/lau/stalt.htm.
[12] For example, if an unemployed American hopes to work 40 hours per week and they instead have a job working just 20 hours per week, a proper measure of unemployment would count them as “half employed and half unemployed.” But whereas this worker is merely considered “employed” in the U-3 and U-5 measures, he is considered “unemployed” in the U-6 measure. From 2007 to 2016, involuntary part-time workers worked an average of 22.8 hours per week, whereas full-time workers worked an average of 42.4 hours. As such, we have created a modified U-6 unemployment rate which counts involuntary part-time workers as being 54 percent employed and 46 percent unemployed.
[13] Fisher, Peter et al, “Selling Snake Oil to the States,” Good Jobs First and the Iowa Policy Project, Nov. 2012, pp. 18-19, at http://www.goodjobsfirst.org/sites/default/files/docs/pdf/snakeoiltothestates.pdf. Mazerov, Michael, “State Taxes Have a Negligible Impact on Americans’ Interstate Moves,” May 21, 2014, at https://www.cbpp.org/research/state-budget-and-tax/state-taxes-have-a-negligible-impact-on-americans-interstate-moves.
[14] See note 7.
[15] Mazerov, Michael, “State Taxes Have a Negligible Impact on Americans’ Interstate Moves,” May 21, 2014, at https://www.cbpp.org/research/state-budget-and-tax/state-taxes-have-a-negligible-impact-on-americans-interstate-moves.
[16] Young, Cristobal, et al., “Millionaire Migration and Taxation of the Elite: Evidence from Administrative Data,” American Sociological Review Vol. 81(3) 421-446, 2016, at http://eml.berkeley.edu/~saez/course/Millionaire_Migration_and_the_Taxtion_of_the_Elite.pdf.
[17] See note 1.
[18] Laffer, Arthur and Stephen Moore, “Taxes Really Do Matter: Look at the States,” The Laffer Center, September 2012, at http://www.senate.michigan.gov/committees/files/2017-SCT-FIN_-03-21-1-01.PDF.
[19] ITEP calculations based on data from the American Community Survey. In 2015, the median home price without a mortgage was $108,000 lower in the states without income taxes, and the median home price with a mortgage was $102,000 lower.
[20] In 2015, the most recent year for which final data are available, the states without personal income taxes saw 12.8 births per 1,000 women ages 15 to 44, while the states with the highest top tax rates saw just 11.6, according to an ITEP analysis of: Martin, Joyce et al. “Births: Final Data for 2015.” National Vital Statistics Reports, Volume 66, Number 1. Jan. 5, 2017. pp. 42. Available at: https://www.cdc.gov/nchs/data/nvsr/nvsr66/nvsr66_01.pdf.
[21] Davis, Carl, et al., “Who Pays, A Distributional Analysis of the Tax Systems in All 50 States, 5th Edition,” Institute on Taxation and Economic Policy, January 2015.
[22] Institute on Taxation and Economic Policy, “Fairness Matters: A Chart Book on Who Pays State and Local Taxes,” Jan. 26, 2017, at https://itep.org/fairness-matters-a-chart-book-on-who-pays-state-and-local-taxes/.
[23] See notes 19 and 20.