U. S. Average
Download PDF
State and local tax shares of family income
| Top 20% | |||||||
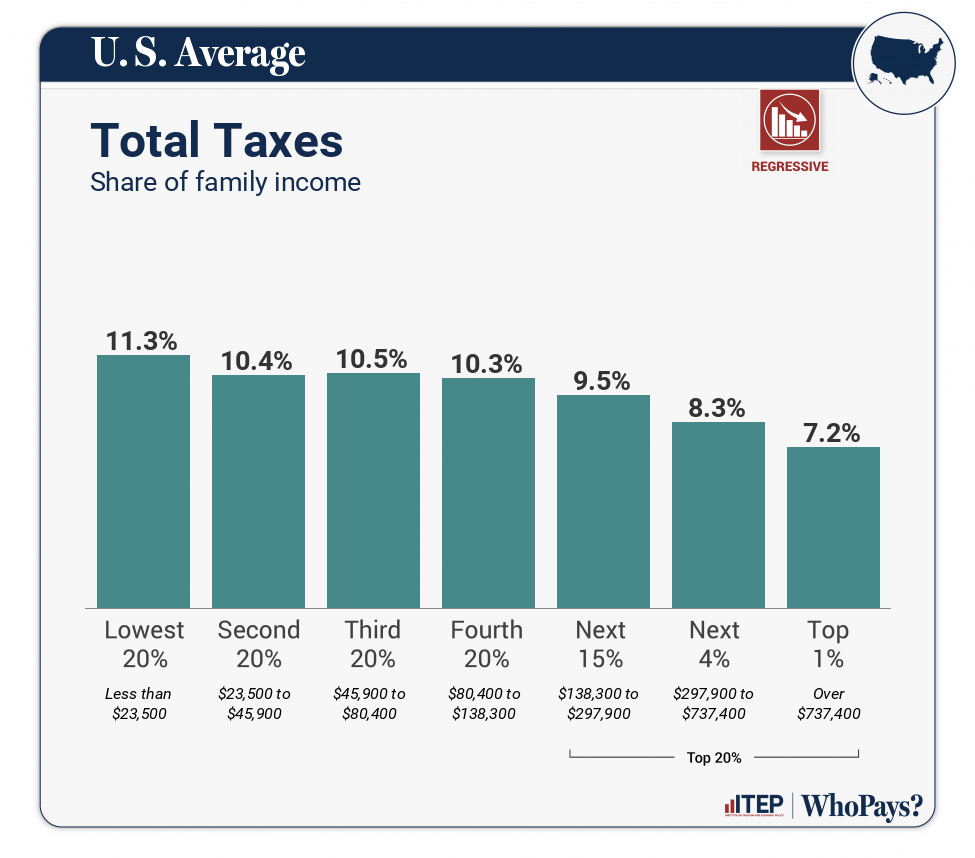
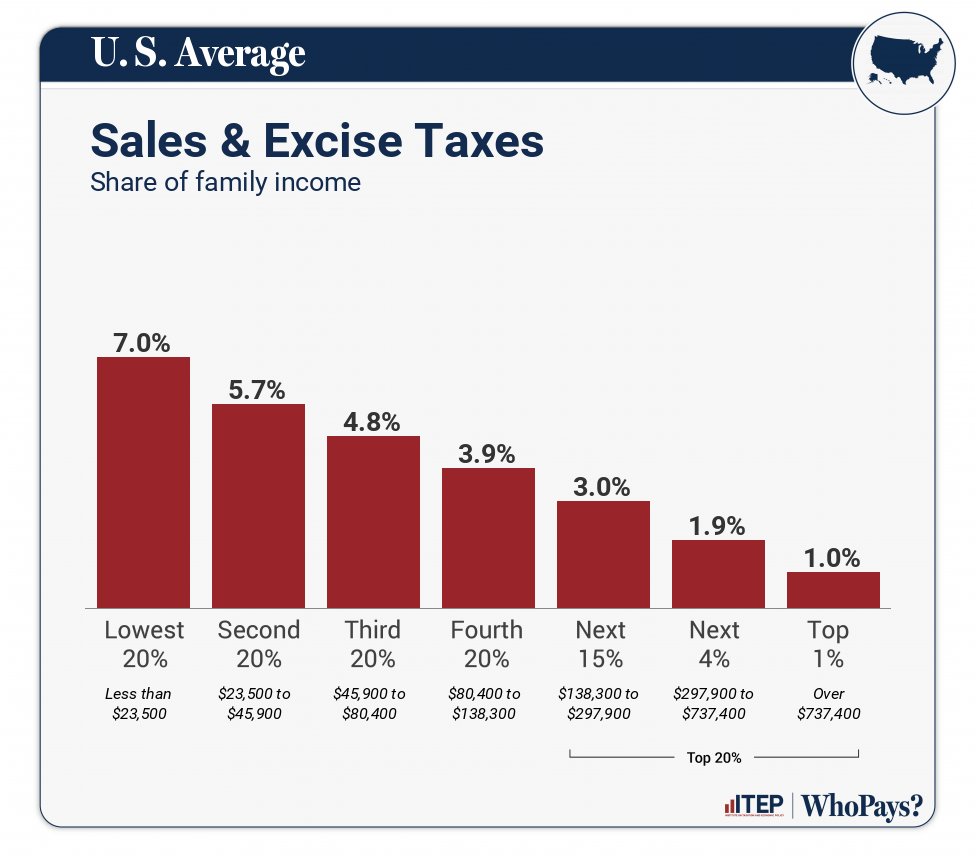
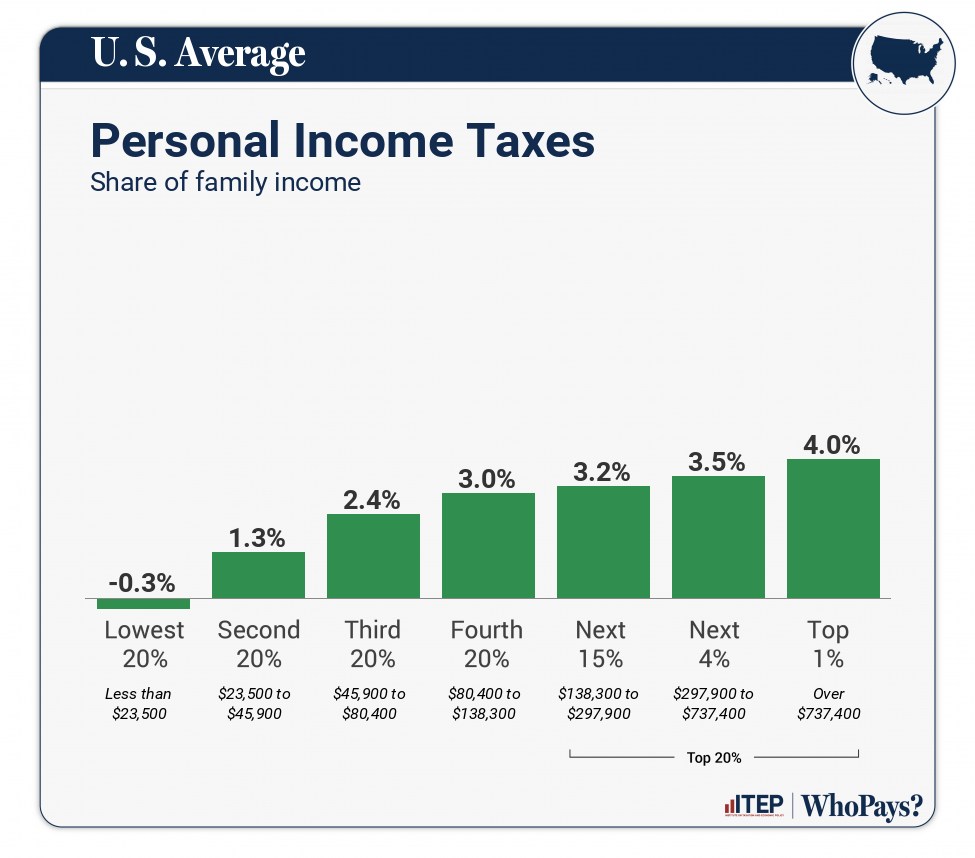
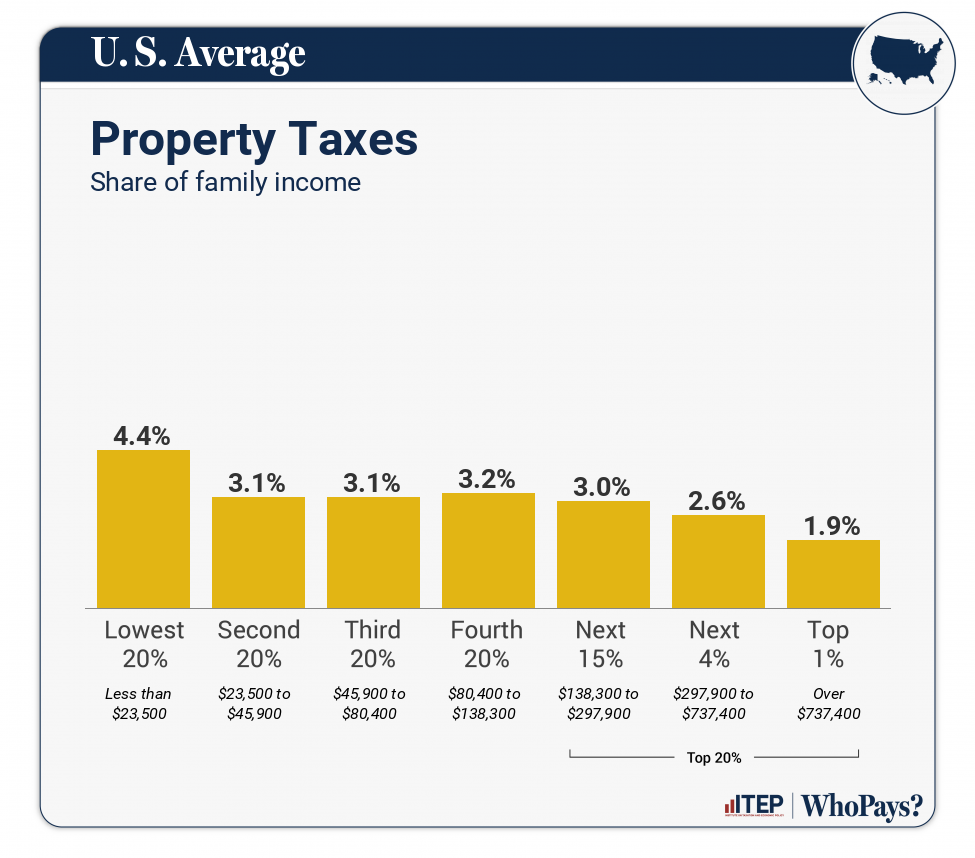
| Income Group | Lowest 20% | Second 20% | Middle 20% | Fourth 20% | Next 15% | Next 4% | Top 1% |
| Income Range | Less than $23,500 | $23,500 to $45,900 | $45,900 to $80,400 | $80,400 to $138,300 | $138,300 to $297,900 | $297,900 to $737,400 | Over $737,400 |
| Average Income in Group | $13,600 | $34,700 | $62,200 | $108,100 | $186,800 | $428,800 | $1,889,900 |
| Sales & Excise Taxes | 7% | 5.7% | 4.8% | 3.9% | 3% | 1.9% | 1% |
| General Sales–Individuals | 3.3% | 3.1% | 2.7% | 2.2% | 1.7% | 1% | 0.3% |
| Other Sales & Excise–Ind | 2.1% | 1.3% | 0.9% | 0.6% | 0.4% | 0.2% | 0.1% |
| Sales & Excise–Business | 1.5% | 1.4% | 1.2% | 1.1% | 0.9% | 0.7% | 0.7% |
| Property Taxes | 4.4% | 3.1% | 3.1% | 3.2% | 3% | 2.6% | 1.9% |
| Home, Rent, Car–Individuals | 3.8% | 2.6% | 2.6% | 2.7% | 2.5% | 2% | 0.6% |
| Other Property Taxes | 0.6% | 0.5% | 0.5% | 0.5% | 0.5% | 0.7% | 1.3% |
| Income Taxes | -0.2% | 1.4% | 2.4% | 3.1% | 3.3% | 3.6% | 4.1% |
| Personal Income Taxes | -0.3% | 1.3% | 2.4% | 3% | 3.2% | 3.5% | 4% |
| Corporate Income Taxes | 0.1% | 0.1% | 0.1% | 0.1% | 0.1% | 0.1% | 0.1% |
| Other Taxes | 0.2% | 0.2% | 0.2% | 0.1% | 0.1% | 0.1% | 0.1% |
| TOTAL TAXES | 11.3% | 10.4% | 10.5% | 10.3% | 9.5% | 8.3% | 7.2% |
| Individual figures may not sum to totals due to rounding. | |||||||
ITEP Tax Inequality Index
ITEP’s Tax Inequality Index measures the effects of each state’s tax system on income inequality. States with negative Index values have regressive tax codes that widen income inequality. States with positive Index values do not add to income inequality and, in fact, actually lessen inequality between at least some groups. The average state and local tax code receives an Index value of -3.8%, indicating that it worsens inequality. (See the report methodology for additional detail.)

