Recent Work
2178 items
Trump’s Plan to Vaporize the Economy Through Mass Deportation
September 16, 2024 • By Michael Ettlinger

This op-ed originally appeared in the Boston Globe. What would happen if 22 percent of America’s farmworkers vanished from the workforce? Would workers from across the country flock to the cotton fields of Texas, the sugar fields of Florida, and the peanut farms of Georgia to take low-paying jobs in the blazing heat? Or would […]
Extending Temporary Provisions of the 2017 Trump Tax Law: Updated National and State-by-State Estimates
September 13, 2024 • By Steve Wamhoff

The TCJA Permanency Act would make permanent the provisions of the Tax Cuts and Jobs Act of 2017 that are set to expire at the end of 2025. The legislation would disproportionately benefit the richest Americans. Below are graphics for each state that show the effects of making TCJA permanent across income groups. See ITEP’s […]
Voucher Boondoggle: House Advances Plan to Give the Wealthy $1.20 for Every $1 They Steer to Private K-12 Schools
September 12, 2024 • By Carl Davis
The U.S. House Ways & Means Committee has advanced a new school voucher bill. H.R. 9462—the Educational Choice for Children Act of 2024—would create an unprecedented tax incentive designed to fund private, mostly religious, K-12 schools.
State Earned Income Tax Credits Support Families and Workers in 2024
September 12, 2024 • By Neva Butkus
Nearly two-thirds of states (31 plus the District of Columbia and Puerto Rico) have an Earned Income Tax Credit. These credits boost low-paid workers’ incomes and offset some of the taxes they pay, helping lower-income families achieve greater economic security.
State Child Tax Credits Boosted Financial Security for Families and Children in 2024
September 12, 2024 • By Neva Butkus
Fifteen states plus the District of Columbia provide Child Tax Credits to reduce poverty, boost economic security, and invest in children. This year alone, lawmakers in three states – Colorado, New York, and Utah – expanded their Child Tax Credits while lawmakers in the District of Columbia created a new credit that will take effect in 2025.
Expanded Child Tax Credit is Key to Reducing Child Poverty, New Census Data Illustrate
September 10, 2024 • By Jon Whiten
From 2021-2023, child poverty has more than doubled from 5.2 to 13.7 percent. The latest Census data make clear that lawmakers have the tools to help millions of children and their families – and it’s beyond time they take action.
After the dust settles on this year’s election, one of the most pressing issues confronting the next Congress and President will be how to deal with the expiration of the 2017 Trump tax cuts and, more specifically, who will pay for the cost of extending some or all of those cuts. Among the more widely accepted ideas circulating on the right is to raise income taxes on single parents, more than four in five of whom are women and a disproportionate share of whom are people of color.
State Rundown 9/5: Property Tax Policy Continues to Make Headlines
September 5, 2024 • By ITEP Staff
Property tax bills are undeniably a concern for many low- and moderate-income households across the nation...
The IRS has opened its free tax filing service called Direct File to every state for the 2025 tax filing season. Direct File was made possible by President Biden’s Inflation Reduction Act, which provided new resources for the IRS to improve customer service and ensure taxpayers claim the benefits and deductions for which they are […]
The no tax on tips idea isn't a new one, but it's always been abandoned because it's practically impossible to do without creating new avenues for tax avoidance. Despite its embrace by the candidates from both major parties, this policy idea would do little to help the roughly 4 million people who work in tipped occupations while creating a host of problems.

Many cities, counties, and townships across the country are in a difficult, or at least unstable, budgetary position. Localities are responding to these financial pressures in a variety of ways with some charging ahead with enacting innovative reforms like short-term rental and vacancy taxes, and others setting up local tax commissions to study the problem.
State Rundown 8/8: States Laying the Groundwork for Future Tax Battles
August 8, 2024 • By ITEP Staff
Whether they’re in a special session, gearing up for one, or prepping for 2025, states around the country are focusing on important tax fights...
Minnesota stands apart from the rest of the country with a moderately progressive tax system that asks slightly more of the rich than of low- and middle-income families. Recent reforms signed by Gov. Tim Walz have contributed to this reality.
Sales Tax Holidays Miss the Mark When it Comes to Effective Sales Tax Reform
August 6, 2024 • By Marco Guzman

Nineteen states have sales tax holidays on the books in 2024. These suspensions combined will cost states and localities over $1.3 billion in lost revenue this year. Sales tax holidays are poorly targeted and too temporary to meaningfully change the regressive nature of a state’s tax system.
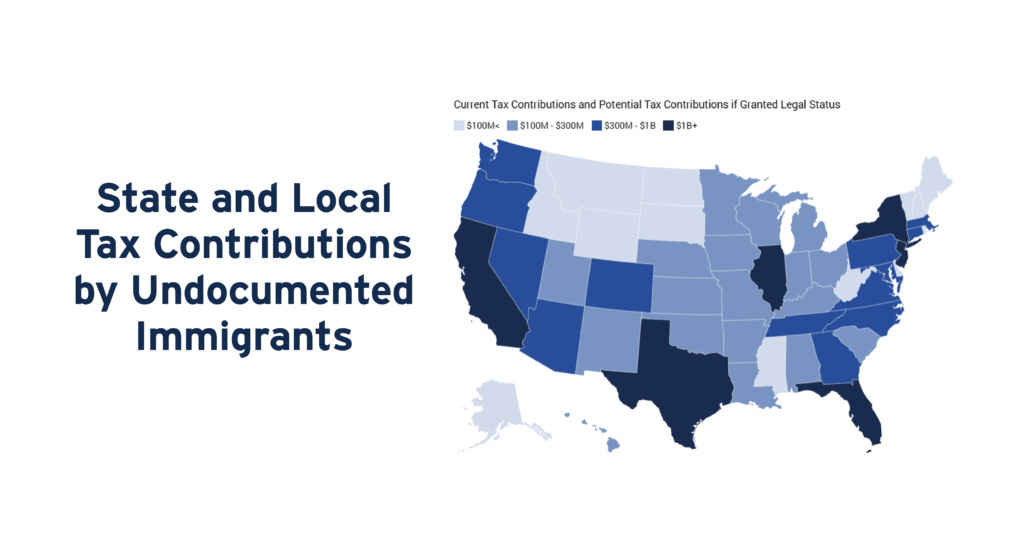
Undocumented immigrants pay taxes that help fund public infrastructure, institutions, and services in every U.S. state. Nearly 39 percent of the total tax dollars paid by undocumented immigrants in 2022 ($37.3 billion) went to state and local governments.

Institute on Taxation
and Economic Policy
ITEP is a non-profit, non-partisan tax policy organization. We conduct rigorous analyses of tax and economic proposals and provide data-driven recommendations to shape equitable and sustainable tax systems.
Subscribe to ITEP Emails
Tax research and policy news in your inbox.
Promote Fair Tax Policy
Your gift to ITEP promotes tax justice. With your help, we do research that supports taxing millionaires and billionaires, taxing big corporations and raising revenue for the things our people, our communities and our planet need.
Together, we can create a country with more economic justice, more racial justice, more climate justice… and more tax justice.