Estimating Wealth Levels and Potential Wealth Tax Bases Across States
Key Findings
▶ More than one in four dollars of wealth in the U.S. is held by a tiny fraction of households with net worth over $30 million. Nationally, we estimate that wealth over $30 million per household will reach $26 trillion in 2022 with roughly one-fifth of that amount ($4.5 trillion) held by billionaires.
▶ A nationwide tax of 2 percent on wealth over $30 million could have raised nearly $415 billion if it were in effect this year, while a similar tax applying only to wealth in excess of $1 billion could have raised $62 billion. This tax would affect just 1 in 400 households nationwide, or 0.25 percent of the population. No state would see more than 0.5 percent of its population affected by such a tax.
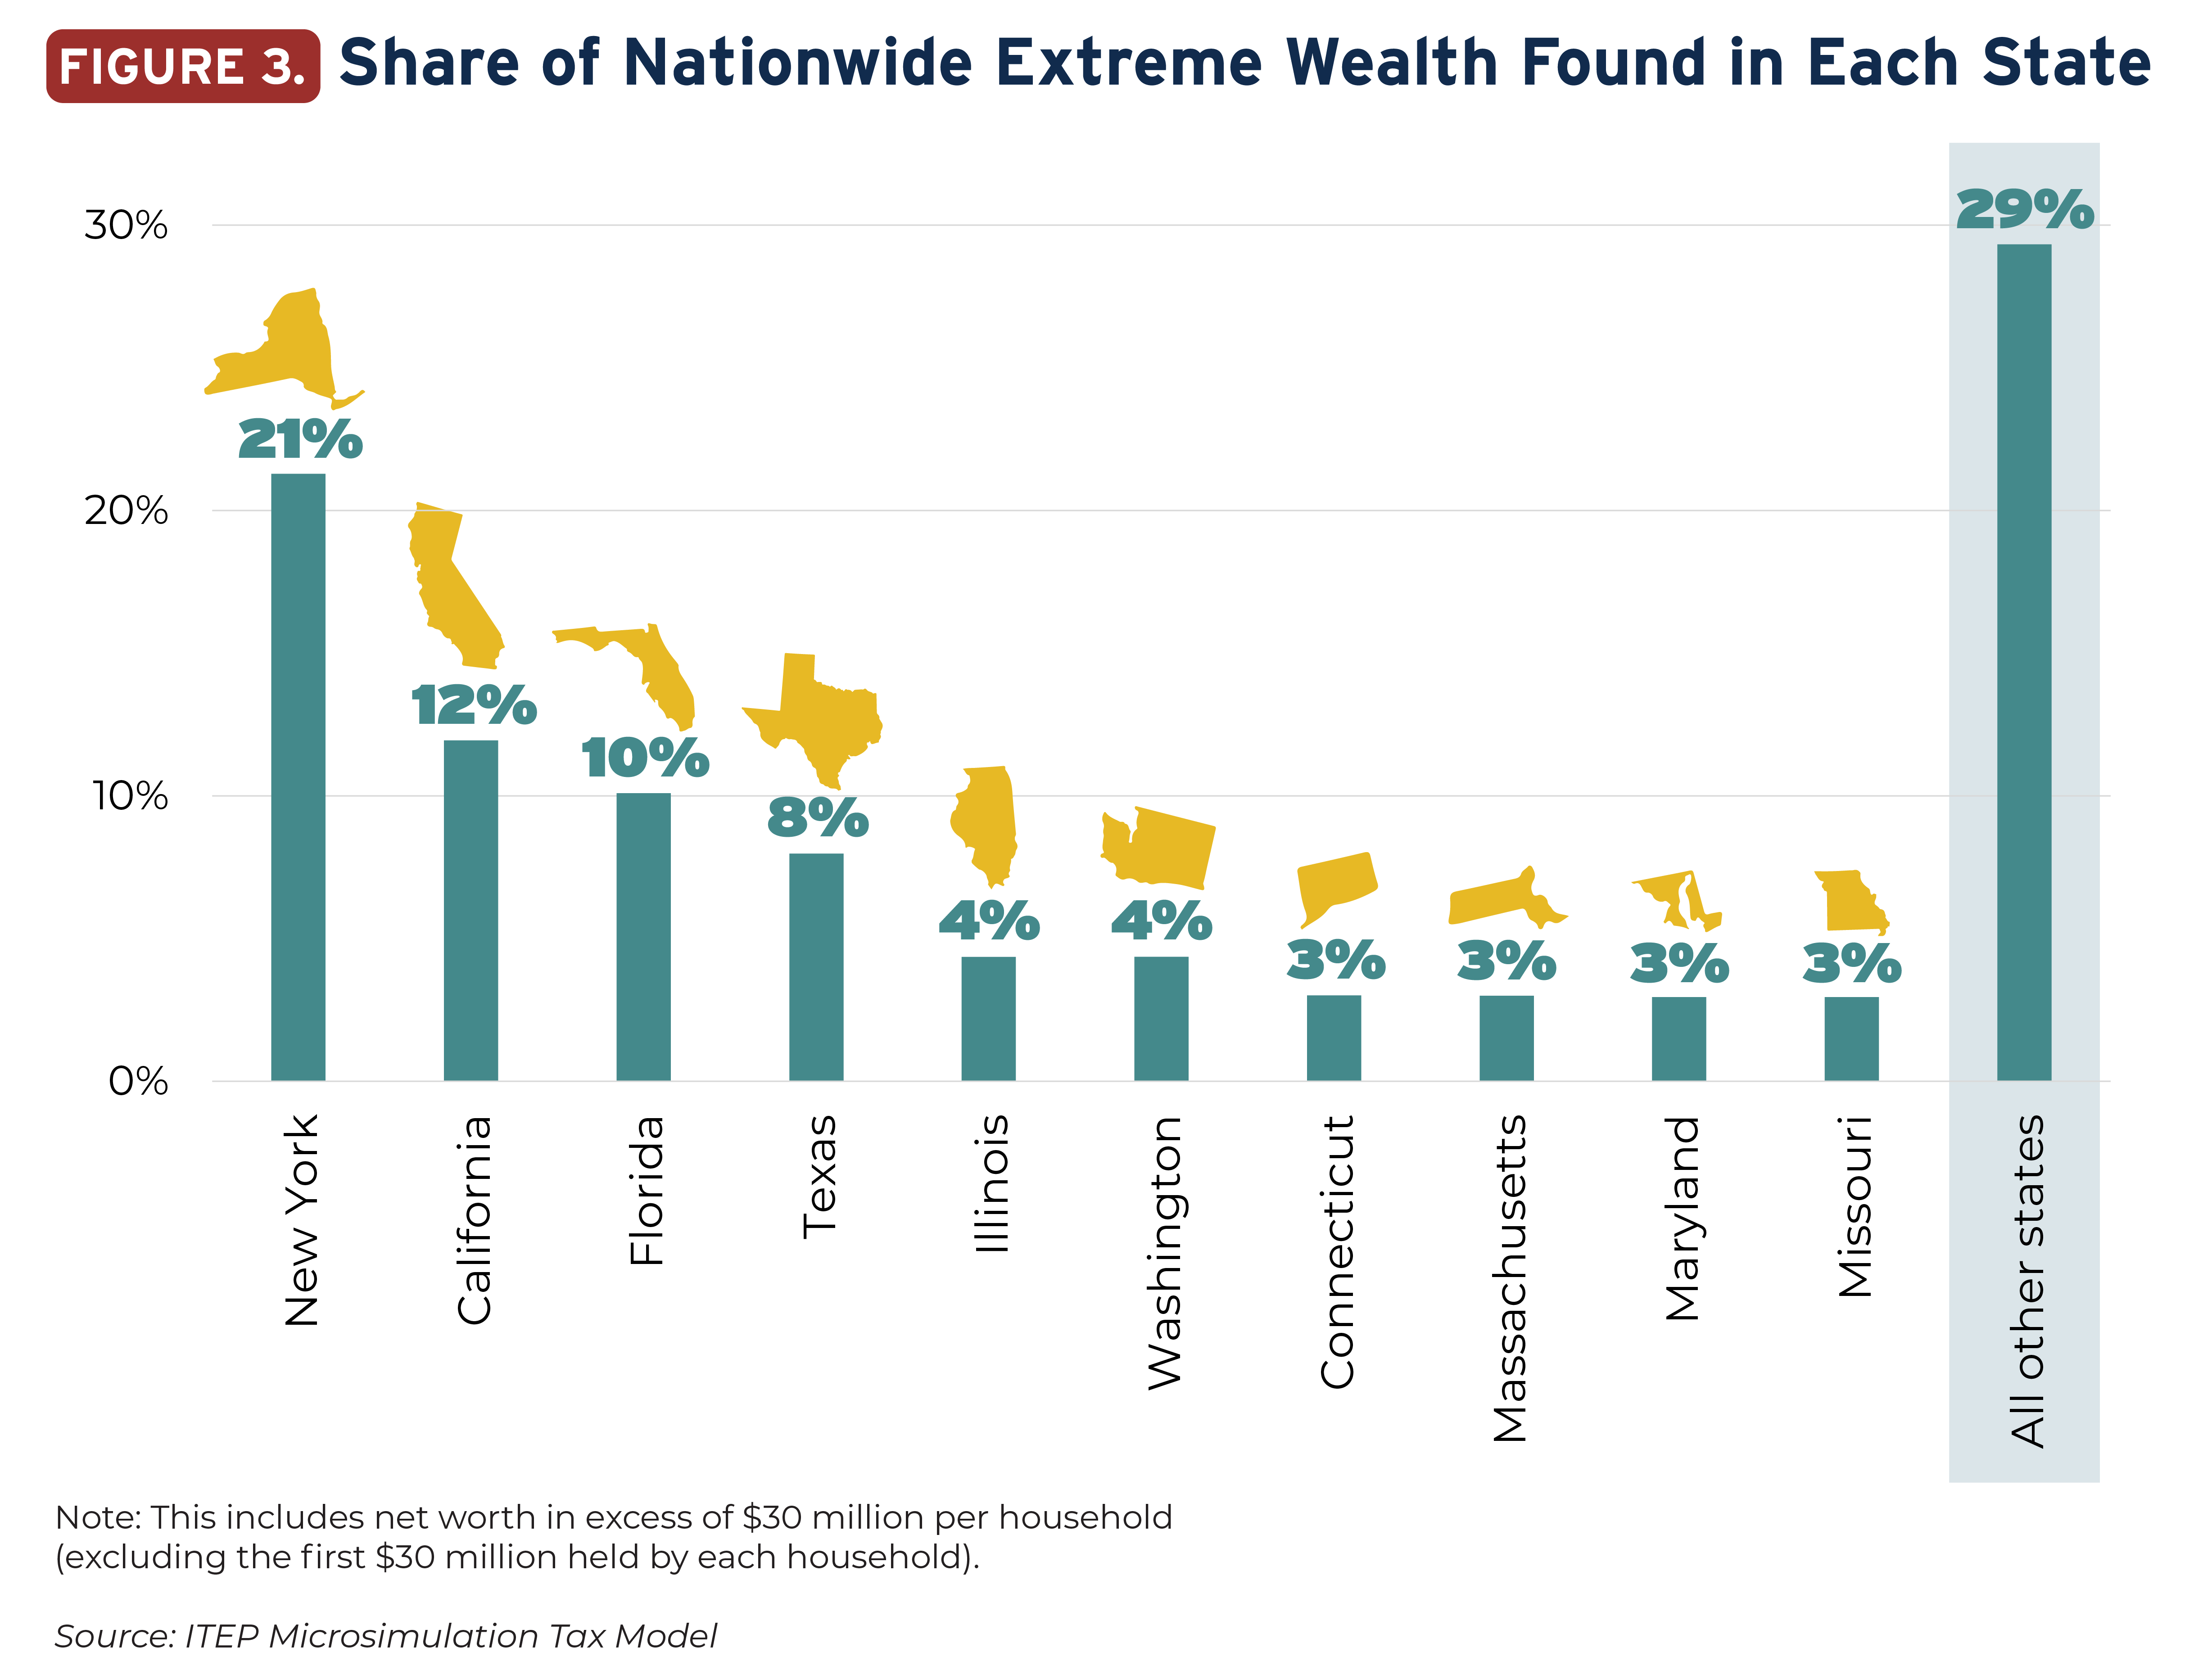
▶ New York is home to the highest concentration of extreme wealth in the nation. Of all wealth over $30 million per household found in the U.S., more than 1 in 5 of those dollars can be found in New York. This finding points to the outsized importance of Wall Street as a source of extreme wealth in the U.S. and to the economic clout of New York City more broadly. (For more about the novel methodology behind this finding, see Appendix E.)
▶ Other states with an outsized concentration of extreme wealth achieve that distinction through a variety of means, including industry mix and the location decisions of a small number of billionaires. Other states with above-average shares of wealth in excess of $30 million are Arkansas, California, Connecticut, Florida, Hawaii, Illinois, Maryland, Massachusetts, Missouri, Nebraska, Nevada, Washington state, Wyoming and the District of Columbia.
▶ The Northeast is home to a higher concentration of extreme wealth than any other region and would therefore pay a significant share of a tax on wealth over $30 million per household. The Midwest and South would be least affected by such a tax as these regions possess smaller amounts of extreme wealth.
▶ A large share of extreme wealth is held in the form of unrealized capital gains, meaning investment income on which these families have yet to pay tax (and may never pay tax under current law). Nationally, among families with more than $30 million in wealth, an estimated 43 percent of that wealth takes the form of unrealized gains.
▶ Lawmakers could consider taxing the existing stock of unrealized capital gains either as part of a transition to taxing such gains on an annual basis or under a standalone, one-time tax. A one-time tax on the current stock of unrealized capital gains over $10 million per household could generate between $529 billion and $3.9 trillion depending on the parameters chosen for the tax.
▶ The federal government and states have no shortage of options for taxing extreme wealth, including net worth taxation, mark-to-market taxation, ending stepped-up basis, raising rates on realized capital gains and strengthening or creating estate and inheritance taxes. Notably, many options that the federal government might pursue in taxing extreme wealth would also be helpful to states seeking to diversify their own revenue streams to include extreme wealth within their tax bases.
Wealth Inequality is a Growing National Problem
Economic inequality in the U.S. is large, growing and highly unpopular.[1] Excessive concentration of wealth runs counter to our national aspiration for genuine equality of opportunity, and it saps the vitality of our democracy through the consolidation of power and influence. Tax policy offers a powerful means of beginning to address our nation’s stark level of inequality, but current law is clearly falling short of its potential. Federal and state tax codes include little in the way of direct taxes on the wealth holdings of extremely affluent families and instead often favor sources of income that are derived from wealth.
In recent years an increasing amount of attention has been paid to issues of economic and wealth inequality, including analyses of national wealth inequality over time and by race and ethnicity.[2] This report adds to that discussion by offering a look at geographic distribution of extreme wealth in the U.S. It includes estimates of the amount of wealth in excess of $30 million and $1 billion per household in each state as well as data on unrealized capital gains in excess of $10 million per household.[3]
Nationally, 30 percent of wealth (totaling $39 trillion in 2022) is held by a relatively small number of households with total wealth over $30 million.
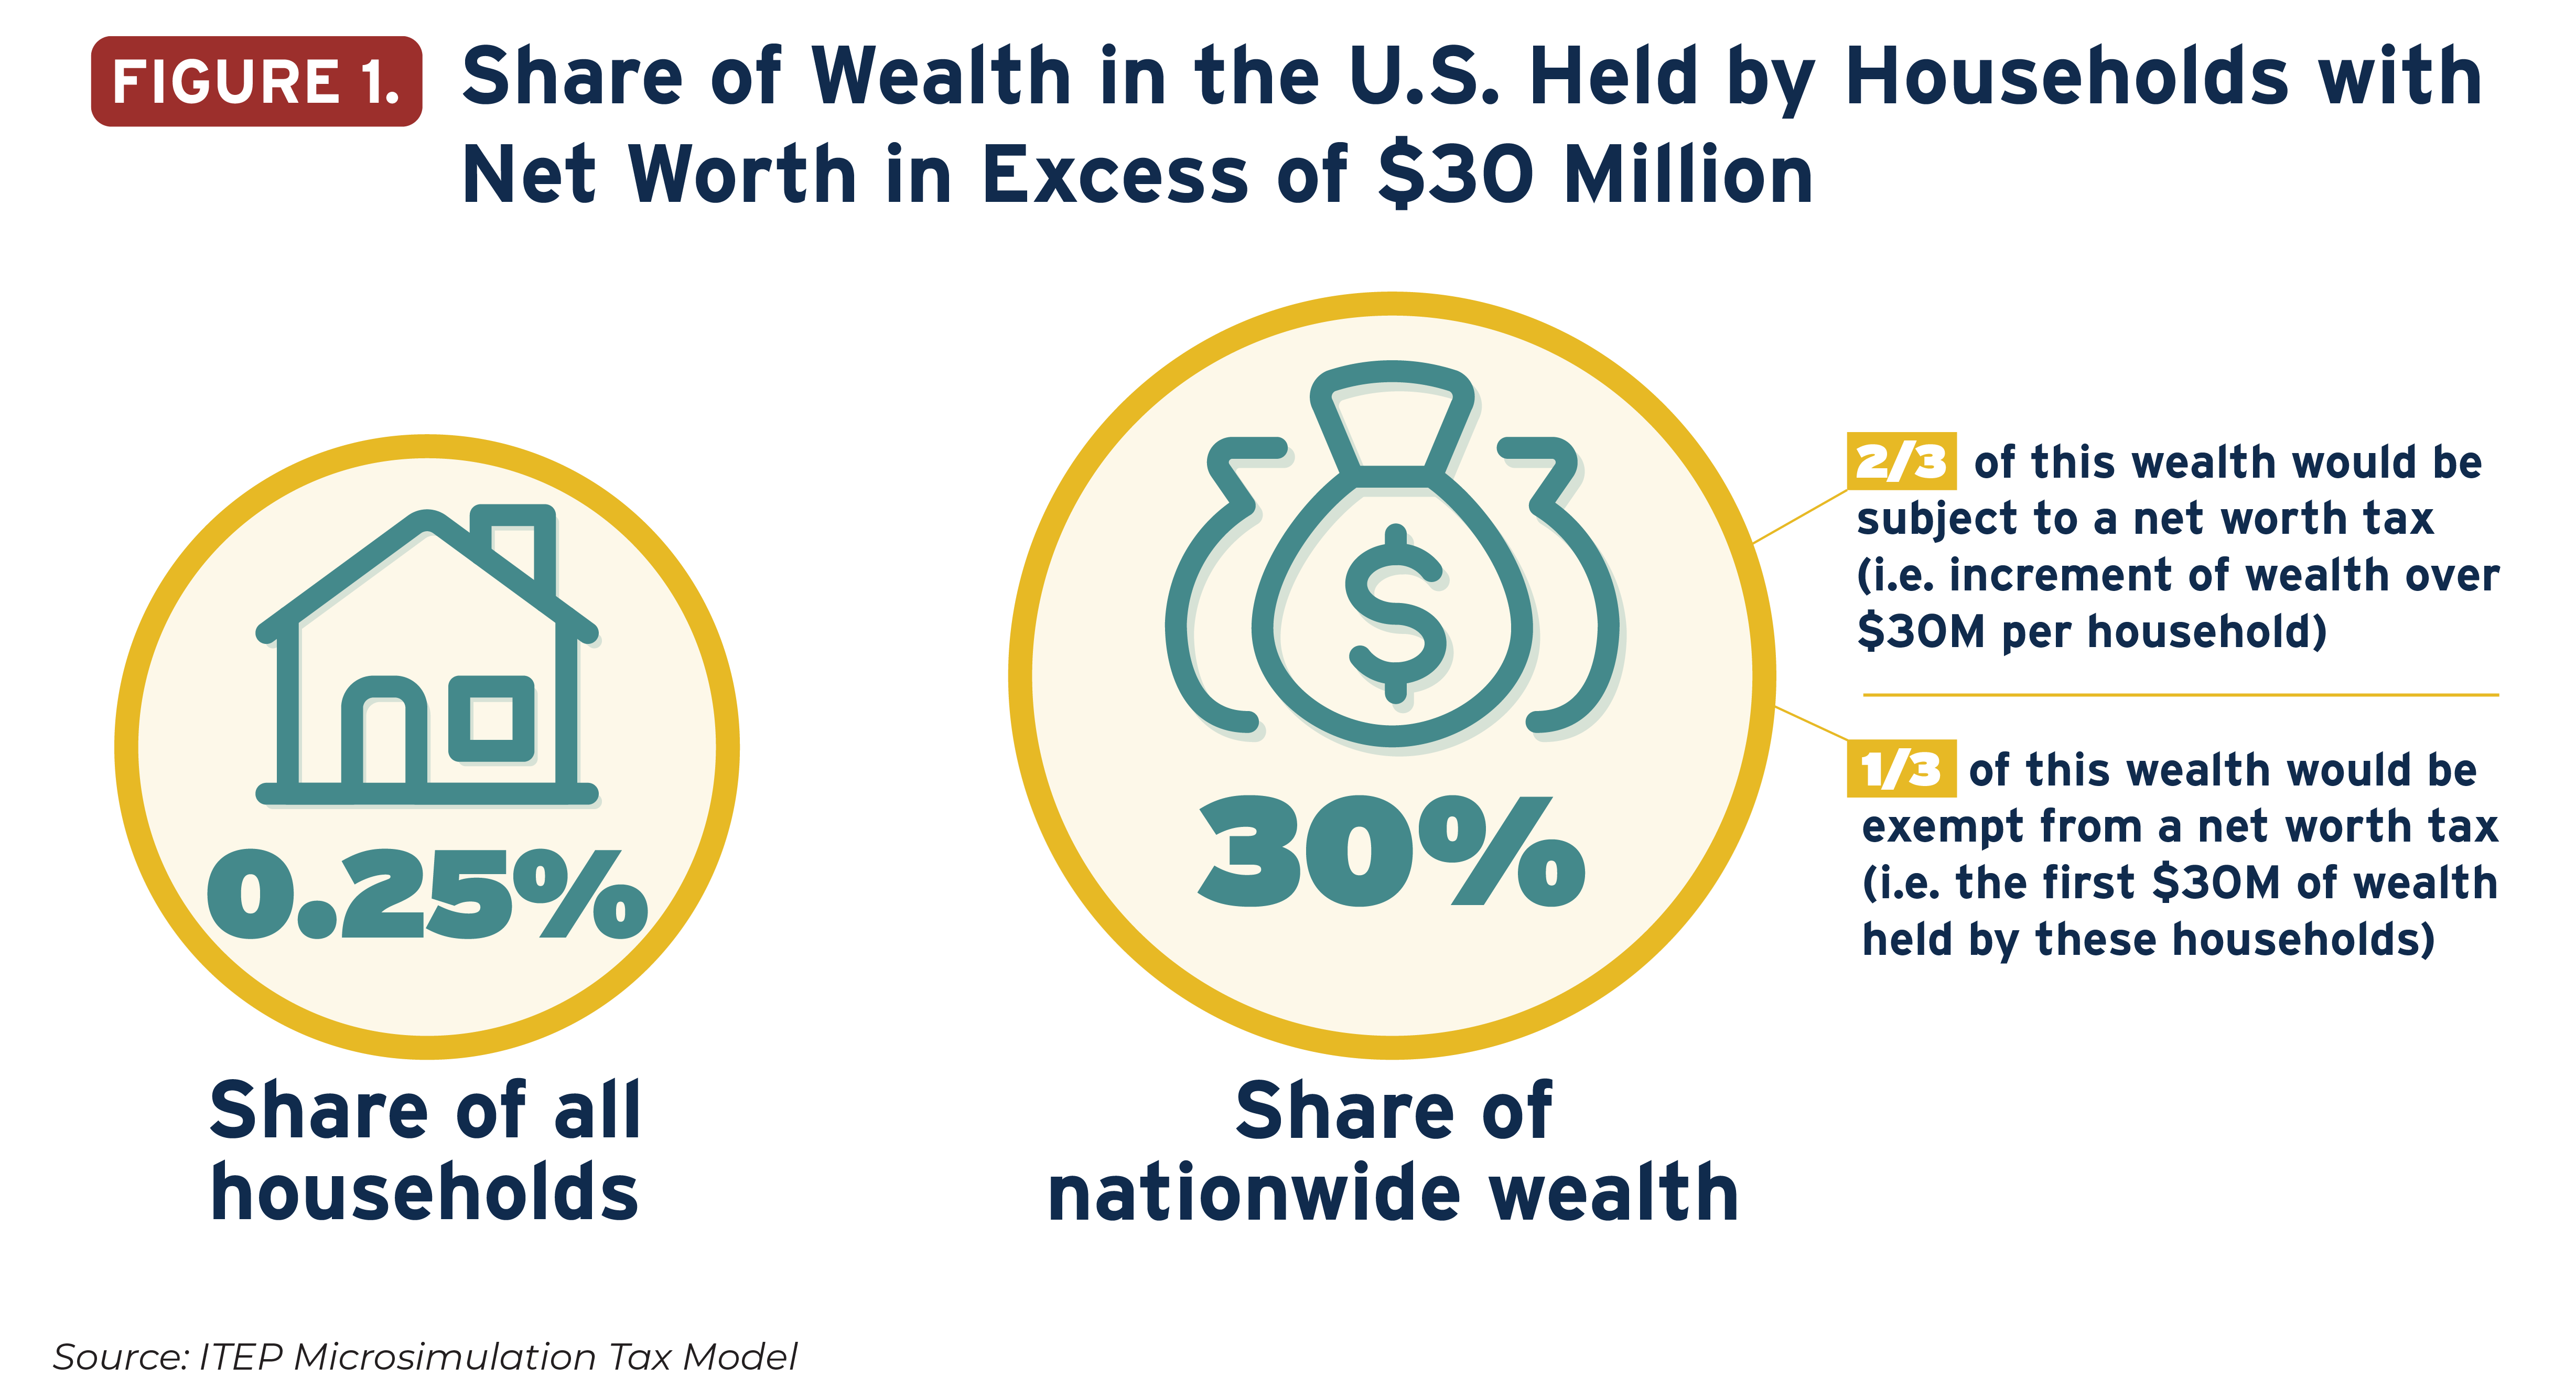
Because most proposals to tax extreme wealth include an exemption level that shelters most wealth from taxation, we also examine the fraction of wealth exceeding $30 million per household. Exempting the first $30 million in wealth from taxation would shelter roughly one-third of this group’s wealth from taxation entirely. The other two-thirds of this group’s wealth, meaning the $30,000,001st dollar and above held by each household, would be subject to taxation, representing a potential tax base of $26 trillion.[4] Roughly one-fifth of that ($4.5 trillion) is held by billionaires, with the remainder held by multimillionaire households with a net worth greater than $30 million but less than $1 billion.
A large share of extreme wealth is held in the form of unrealized capital gains. This is a type of income that has yet to be recognized on any tax form and that, in many cases, never will be recognized as taxable under current law because of the stepped-up basis benefit (for more detail see below). As an example, an individual owning nothing but one share of stock worth $100 that they originally purchased for just $30 would have a net worth of $100 and an unrealized capital gain of $70.
Of the $39 trillion in total wealth held by families with net worth above $30 million, almost $17 trillion of that—or 43 percent of the total—takes the form of unrealized capital gains. (See Appendix C for a state-by-state breakdown.)
Extreme Wealth Reflects and Perpetuates Racial Inequality
White, non-Hispanic families own 86 percent of the total wealth in the United States, while Black, non-Hispanic families own just 3 percent, our analysis of data from the SCF indicates. This is the result of historic and ongoing racism and discrimination—including in our public policies—that advantaged white communities and systemically marginalized Black, brown and Indigenous communities.[5]
Racial inequality is even more pronounced among the ultra-wealthy. Ninety-two percent of the total wealth held by families with net worth over $30 million is owned by white, non-Hispanic families. As stark as this number is, it may be an understatement because the SCF does not include the top 400 wealthiest families. Information compiled by Forbes reveals similar disparities at the extreme end of the wealth distribution, with just nine Black billionaires on their list of more than 700 U.S. billionaires in total.[6]
Unrealized capital gains are similarly concentrated among white, non-Hispanic families. We previously found that 89 percent of all unrealized gains above $2 million per household are held by white families, despite this group accounting for just 65 percent of U.S. families overall.[7] That analysis also shows that just 1 percent of such gains are held by Black families and less than 1 percent are held by Hispanic families.
Shortcomings in our nation’s tax code contribute to this alarming level of inequality. America has long taxed income from wealth more lightly than it taxes income from work, which makes it easier for those with substantial assets to build even more wealth. Measures to tax extreme wealth would directly counteract some of the racial inequality we see today, while also helping to level the playing field so that it is not as tilted in favor of the already-wealthy.
Extreme Wealth by State
Existing data on high-wealth individuals provide a useful overview of the national distribution of extreme wealth. We merge those national wealth data with state-level tax and economic data to reveal how that wealth is distributed across the country. (See Appendix E for a more detailed discussion of the methodology underlying this report.)
In estimating the amount of extreme wealth in each state, the number of high-income households and amount of income they report are important variables. So too, however, is their composition of income and their age.
California, for instance, is home to a very large number of high-income households, but those households tend to be younger than average and their income profile skews toward salaries and wages to a greater degree than is typical of high-income households in other states—likely due to very highly-paid positions at major tech and entertainment companies that cannot be found in most states.
Wyoming, on the other hand, has little in the way of highly-paid professional opportunities and its high-income households derive the bulk of their income from their wealth, in the form of capital gains and dividends produced by their investments. As a result, while both these states have above-average concentrations of extreme wealth, Wyoming has a more outsized concentration than California because the greater relative importance of investment income flows in that state points to larger wealth holdings among high-income families.
In all, fourteen states and the District of Columbia are home to an above-average concentration of extreme wealth, meaning that their share of nationwide wealth over $30 million per household is greater than their share of the nation’s population. This includes a diverse set of states who are in this group for very different reasons.[8]
Connecticut, Illinois and New York, for example, likely find themselves on this list in part through the fortunes generated by their financial industries. In New York’s case, the influence of Wall Street is particularly apparent. The tech industry, on the other hand, is responsible for a larger share of California and Washington state’s largest fortunes.
In many of these states, the location decisions of an exceedingly small number of billionaires are a major contributing factor. This is most obvious in Nebraska (home to Warren Buffet) and Arkansas (home to the Walton family, of Walmart fame), though it is also a factor in Hawaii, Washington, Wyoming, California and Nevada. Nationwide, billionaires hold 17.5 percent of net worth over $30 million. Across the seven states just named, that share ranges from a low of 20 percent in Nevada to a high of 66 percent in Hawaii.
Extreme wealth is highly concentrated geographically. Nearly a third of the $26 trillion in total wealth exceeding $30 million per household is held by families living in just two states: New York and California. Another 18 percent belongs to residents of Texas and Florida. In total, this means that more than half of nationwide extreme wealth is held by the residents of just four states. The top 10 states account for more than 7 in 10 dollars of the nation’s extreme wealth. These states are home to less than half (46 percent) of the U.S. population.
There are also strong regional trends in the distribution of extreme wealth, with higher concentrations in the Northeast and lower concentrations in the South and Midwest. These regional trends are explored in greater detail in the next section. (A full accounting of extreme wealth by state, along with wealth tax revenue estimates based on that measure of wealth, can be found in Appendices A and B.)
Revenue Potential of Net Worth Taxation
The U.S. is confronting staggering wealth inequality across economic and racial groups.[9] Tax policy at all levels of government—federal, state and local—is falling short of its potential to curb this inequality. A recent analysis by economists at the White House Council of Economic Advisors and the Office of Management and Budget, for example, concluded that the wealthiest 400 families in the nation pay an average federal individual income tax rate of just 8.2 percent when measured against a relatively comprehensive measure of income that includes unrealized capital gains.[10] Recent investigative reporting by ProPublica has uncovered even lower tax rates for many billionaires.[11]
The federal tax system is focused almost entirely on taxing income. It taxes wealth only when it is transferred as a gift or bequest, and such wealth transfer taxes account for a tiny fraction of federal revenue. This is exacerbated by income tax preferences that tend to treat income derived from wealth more favorably than income derived from labor.
There is no shortage of options for addressing this under-taxation of extreme wealth in the U.S. Many specific types of reforms are discussed briefly in the next section.
Perhaps the most direct and intuitive option is to create a nationwide tax on extreme wealth, often referred to as a “net worth tax” or, simply, a “wealth tax.” Applying a 2 percent tax to assets over $30 million per household could have raised more than $414 billion if it were in effect this year. A tax rate of 5 percent could have been expected to yield almost $1 trillion this year. Estimates of how those payments would be distributed across states are provided in Appendix A. These calculations assume a compliance rate of 80 percent, which is slightly lower than the 83.7 percent rate of overall federal tax compliance and the 86 percent rate seen under the estate tax.[12] It is also in line with the compliance rate used by a team of experts who evaluated the revenue potential of a state-level wealth tax in California.[13]
Regional Impact of a Tax on Extreme Wealth
A plurality of the revenue (31 percent) raised by a tax on wealth over $30 million would come from the Northeast, even though this region is home to just 17 percent of the overall U.S. population. Affluent taxpayers in New York, Connecticut and Massachusetts would contribute the bulk of the revenue coming from the Northeast.
The Midwest and South would be less affected by such a tax as these regions possess smaller amounts of extreme wealth. The Midwest is home to 21 percent of the U.S. population and yet just 16 percent of the total tax dollars paid under a national wealth tax would come from affluent taxpayers living in this region. The South, as defined by the U.S. Census Bureau, is home to 38 percent of the U.S. population and yet would pay just 30 percent of the net worth tax examined in this report. Using a more restrictive definition of the Southeast that may better conform with most people’s understanding of the South, we find that affluent taxpayers in this region would pay just 18 percent of the tax despite these states representing 26 percent of the nationwide population.
Affluent taxpayers in the western U.S. along with Alaska and Hawaii would contribute a share of the overall revenue (23 percent) that is very close in line with those states’ combined share of the overall U.S. population (24 percent).
Options for Taxing Unrealized Capital Gains
We also estimate the size of unrealized capital gains both nationally and by state. In future research we hope to be able to estimate the flow of unrealized capital gains over time, but for now we present information only on the existing stock of such gains.
The current stock of such gains is relevant because proposals to apply a mark-to-market system of taxation to the annual flow of unrealized gains typically include a measure to gradually tax the current stock of unrealized gains as well. Some experts have also proposed applying a one-time tax to unrealized gains as a way of accelerating some of the revenue collections expected to eventually be raised upon realization.[14]
Families with total unrealized gains over $10 million have more than $18 trillion in total unrealized gains, with most of that ($13 trillion) representing amounts over $10 million per household. (Appendix D has a state-by-state breakdown of these gains.) Just 0.31 percent of all households nationwide have unrealized gains at this level, meaning it is a group that is quite like the 0.25 percent of households we find to have net worth over $30 million.
The amount of revenue that could be raised by taxing the stock of unrealized gains would depend on the parameters chosen for such a tax. Under the most modest of proposals, lawmakers could pursue a partial deemed realization, meaning that only a portion of unrealized gains would be considered to be realized for tax purposes (taxpayers would later pay tax on the remainder of their gains if they realize them during their lifetimes). More ambitious proposals, on the other hand, would apply to the full stock of unrealized gains above some baseline exemption level.
A tax on the stock of unrealized gains in 2022 could be expected to raise between $529 billion and $3.9 trillion depending on the tax rate chosen and the percentage of gains deemed to be realized. Appendix D has detail on the revenue estimates for six different policy options. Each assumes that the first $10 million in unrealized gains would remain exempt from tax (until the taxpayer chooses to realize them). Crucially, the revenue amounts presented in Appendix D would be a one-time event as proposals to tax unrealized gains as income would only apply to that income once, though ongoing taxes on future flows of unrealized gains could raise additional revenue. Particularly under the more ambitious proposals with higher tax rates, there is also a case to be made for allowing tax payments to be made across a span of multiple years to avoid any liquidity problems.
Other Federal Wealth Tax Policy Considerations
While the most direct approach to taxing extreme wealth is an annual tax on net worth over a certain level, there are many other ways to strengthen the taxation of extremely wealthy people at the federal level.
Unlike workers who pay income tax regularly basis through paycheck withholdings, wealthy investors can enjoy significant returns on their stock and other property holdings for many years without having to pay tax until they sell their assets. These unrealized capital gains make up 43 percent of all extreme wealth. Recent proposals such as Sen. Ron Wyden’s Billionaires Income Tax and President Biden’s Billionaires’ Minimum Income Tax would lessen this disparity by annually taxing at least some of the investment gains of extremely wealthy individuals.[15] This is what is known as “mark-to-market taxation” or “anti-deferral accounting,” which simply means that capital gains taxes must be paid each year, rather than deferred until a much later date when the assets producing those gains are finally sold. For administrative simplicity, such proposals nearly always focus on a small subset of the nation’s wealthiest households and would exempt the vast majority of families.
Ending stepped-up basis
Under current law, capital gains are taxable only if the asset generating those gains is sold during the taxpayer’s lifetime. That is, if the gain is “realized” while the owner is alive. Again, this allows investors to watch their assets produce gains for decades without ever having to set aside anything for taxes – unlike regular workers. If those investors hold onto their assets until death—which typically only very wealthy people can afford to do on a significant scale—all the income generated by their investments is sheltered from income tax forever. For example, if an asset is originally purchased at a value of $50 million and is then passed to an heir at a current value of $100 million, the heir can immediately sell the asset for $100 million without reporting any capital gain. Neither the original owner nor the heir to that property will pay income tax on the gain and the gain will never appear on federal (or state) income tax forms. Ending this feature of law, known as stepped-up basis, would ensure that capital gains are subject to income taxation at some point, rather than allowing them to be handed down through generations tax-free. Notably, President Biden has proposed drastically curtailing this provision for extremely wealthy people by allowing only the first $5 million of unrealized gains (or $10 million for married couples) to enjoy the stepped-up basis benefit.[16]
Raising rates on realized capital gains
Federal law taxes long-term realized capital gains income (gains on assets that were sold after being held longer than a year) at a significantly lower rate than other types of income. Correcting this imbalance and taxing realized gains at the same rates applied to other income would raise taxes significantly on high-wealth households. The Congressional Budget Office has estimated that three-fourths of the benefits of this provision go to the top 1 percent of households by income level.[17] This reform would be most effective if paired with repeal of stepped-up basis or implementation of mark-to-market taxation to prevent wealthy households from deferring tax for decades or sidestepping it entirely by holding their assets until death.
Strengthening the estate tax
The estate tax—which is meant to apply when an extremely wealthy person dies and passes their assets on to their heirs—is an essential tool for curbing the accumulation of dynastic wealth across generations. But several loopholes in the estate tax dramatically reduce its effectiveness. For example, one of the most well-known of these loopholes is a grantor retained annuity trust (GRAT). This is a type of trust into which extremely wealthy people can place their assets to benefit their heirs, and much of the gains on those assets over time are never subject to estate or gift taxes. ProPublica reports that the strategy has been used by more than half of the nation’s 100 richest individuals and a recent survey of 70 randomly selected S&P 500 companies revealed that more than half had executives and top shareholders who used GRATs.[18] Closing the GRAT loophole and other related tax avoidance schemes is vital to ensuring that paying the estate tax is not optional for families with extreme levels of wealth.[19]
Creating an inheritance tax
Shifting away from the current estate tax and toward a robust tax on inheritances instead offers another potential avenue for strengthening the taxation of extreme wealth. Advocates for such a shift have noted that it could better consider heirs’ ability to pay, reduce compliance costs and encourage philanthropic donors to give more broadly.[20] Such proposals typically include a significant exemption level that would keep most families from paying the tax and focus instead on extremely wealthy heirs.
Easing the Path to State-Level Wealth Taxation
State and local tax systems are overwhelmingly regressive when measured as a share of household income and would surely be even more regressive if measured relative to household wealth.[21] State lawmakers seeking to fix this imbalance in their tax codes have several readily available options such as implementing new top income tax rates, raising rates on realized capital gains income, enacting progressive taxation of real estate wealth, strengthening taxation of corporate profits and reinstating or enhancing estate and inheritance taxes, among other measures.
As a practical matter, state tax systems tend to conform to major features of the federal tax code to ease tax administration and compliance. This points to another major benefit of federal efforts to strengthen the taxation of extreme wealth: creating a pathway toward diversifying state revenue streams to include taxation of extreme wealth.
Reforming the federal tax code to include unrealized capital gains in the definition of Adjusted Gross Income (AGI) would greatly help states as they largely rely on that definition to administer their own income taxes.[22] The current definition of taxable capital gains omits more than half of the gains flowing to extremely wealthy families—thereby leaving an enormous hole in both federal and state tax systems that damages economic and racial equity.[23] This could be done either by including unrealized gains received by extremely wealthy households each year through a mark-to-market system of taxation, or by including those gains in AGI at death through repeal of stepped-up basis.[24]
Similarly, state-level estate taxes generally adhere closely to federal rules and efforts to crack down on GRATs and other tax shelters at the federal level would therefore significantly improve state tax equity and administration as well. Twelve states and the District of Columbia currently levy estate taxes based on the federal definition of taxable estates, though exemption levels vary across states.[25]
Other policy options such as creating a federal net worth tax or inheritance tax would also offer new conformity opportunities to states, which could create their own versions of these taxes calculated as a percentage of the federal amount. The federal government could go even further in encouraging state-level adoption of these taxes by reinstating policies like the former estate tax pickup credit, which gave households a dollar-for-dollar federal tax cut on each dollar of state-level estate tax paid. A tax credit along these lines, which offers a full match for the first increment of state wealth taxation, would be a powerful incentive for states to set up these policies. Additional, partial matching credits available at higher levels of taxation could encourage states to go beyond the bare minimum in setting their wealth or inheritance tax levels.
Extreme Wealth Taxes Could Reduce Inequality and Increase Opportunity
More than one in four dollars of wealth in the U.S. is held by a tiny fraction of households with net worth over $30 million. This report offers a unique analysis of these households by state, estimating both their overall wealth level and the portion of that wealth held in the form of unrealized capital gains. This extreme wealth is geographically concentrated, with the top 10 states accounting for more than 70 percent of nationwide extreme wealth and with New York and California alone accounting for nearly a third.
Strengthening the taxation of extreme wealth at the federal and state levels could meaningfully reduce economic inequality while raising significant new revenues to fund public services that promote more broadly shared prosperity. A net worth tax on fortunes over $30 million could raise more than $400 billion annually while affecting just 0.25 percent of the population. No state would see more than 0.5 percent of its population affected by such a tax.
Appendix A
Appendix B
Appendix C
Appendix D
Appendix E
Data and Methodology
1.0 Data
This analysis combines data from the ITEP Microsimulation Tax Model, survey data from the Survey of Consumer Finances (SCF), and information on U.S. billionaires compiled by Forbes to estimate total wealth held by tax units in the United States on a state-by-state basis.
The SCF is the most comprehensive survey of U.S. household finances and wealth. It is a cross-sectional survey of U.S. household saving, asset and liability ownership and financial attitudes, and is conducted by the Federal Reserve every three years. It is also designed to oversample wealthy households, which offers more robust coverage of the very wealthy, who are generally harder to capture in nationally representative surveys.
Despite these advantages, there are at least three notable challenges associated with the SCF. The first is that it does not sample members of the Forbes 400 list, a list of the 400 wealthiest Americans and their net worth. To fill in these gaps, we supplement the SCF data with information from the 2022 release of the Forbes Billionaires list as a final correction and include individual net worth from this list in our targets.
The second challenge is that the SCF’s sampling unit is the Primary Economic Unit (PEU) rather than the tax unit. This refers to all individuals in a household who are “financially interdependent.” In practice, the concept of a PEU is nearer to a tax unit than a Census household, for example, but it is still possible for there to exist more than one tax unit in a single PEU.[26] Unfortunately, the SCF does not have the sort of detailed demographic and economic information for each individual member of a given PEU in order to break them down into tax units the way we can do with other household surveys.
This analysis pools the two most recent survey years of the SCF, 2016 and 2019, to create a sample of 12,025 PEUs -- 6,248 from 2016 and 5,777 from 2019. By pooling two survey years, we generate a dataset with a larger sample size while also smoothing out variation in asset and liability values that occur over time. All dollar values are inflated to 2022 dollars.
The third challenge, and a particularly important one, is that the SCF does not identify the geographic location of PEUs. IRS SOI data, reported separately for each state, play a crucial role in allowing us to conduct this estimation. Those data reveal the number of high-income taxpayers residing in each state as well as their overall income levels and composition of income across various categories such as salaries, investment income, business income and retirement income. The method described below allows us to use the SOI data on the location of top incomes to estimate the location of top wealth.
2.0 Methodology
The methodology is a two-step estimation of 18 different asset and liability categories. We compile an exhaustive list of financial and demographic information that exists both in the SOI data and the SCF data, to use as explanatory variables in predicting:
- Whether a given tax unit will own an asset or liability and;
- Conditional on ownership, the value of that asset or liability.
We then calculate the value of total net worth by subtracting imputed debts from imputed assets.
The assets and liabilities we impute are listed in Table 1. Below:
For each asset and liability, we estimate models separately for married tax units and unmarried tax units.[27] Because of the nature of how missing data is dealt with in the SCF, each observation has 5 separate imputations which cannot be treated as independent observations. Instead, we run each regression for each replicate separately and use an average of the 5 coefficients.
2.1 Estimation Step One: Asset and Liability Ownership
We first employ a probit model to estimate the likelihood of owning a given asset or liability, where:
yi= {1 if PEU i owns an asset or liability; 0 otherwise
And we assume a positive amount of an asset or liability when
Pr{Yi = 1} = X1*β1 + ε1 > 0,
Where X1 is a vector of explanatory variables, β1 is a vector of coefficients, and ε1 is assumed to be a standard normal random variable. This is an important first step when imputing values for variables for which large segments of the population will have zero values.
The vector of explanatory variables is listed in Table 2 below.
Given small sample sizes for some categories of assets and liabilities, some explanatory variables were dropped due to exact multicollinearity. In addition, for some variables, we pool married and unmarried observations in the probit estimation to increase sample size.
Once we obtain an average set of coefficients (β1) from the SCF, we walk those over to the tax data side and multiply the set of coefficients with the value observed in the tax model data (X1). We use this equation to calculate the cumulative standard normal distribution function (CDF):
z = F-1(X1*β1)
The nature o f the CDF is such that we can draw a uniform random number, r, between 0 and 1, where the predicted probability of ownership is equal to 1 if z < r5.
At this point, we undergo a calibration process to ensure that the distribution of ownership in the tax data is roughly equal to the distribution of ownership which we observe in the SCF data. We apply separate adjustment factors for married and single tax units. Before the calibration process, our estimates of overall asset ownership were anywhere between less than one percentage point to 10 percentage points from reported totals in the SCF. The average difference was 3.8 percentage points.
At the end of this calibration process, the difference between the SOI tax data and the SCF data ranges from less than a percentage point to 5 percentage points for any given asset or liability category, with an average difference of less than 2 percentage points.
2.2 Estimation of Asset and Liability Values
The second estimation equation is conditional on asset/liability ownership, for all tax units where z < r using the following equation:
ln(w) = X2*β2 + ε2
Where ln(w) is equal to log value of wealth.
Similar to the process above, we perform a series of OLS regressions on the SCF data and walk the average coefficients of our OLS regressions over to our tax unit data. We then multiply the vector of coefficients β2, by the vector of values in the tax unit data X2. At this point, values are still calculated in the natural log. This is a useful transformation for non-normal data, such as income, but not meaningful for actual interpretation of our wealth data. The expected value of each asset and liability, therefore, must be re-transformed into dollar values.
Given the non-normal nature of the SCF data used for estimation, this equation normally used to transform log values into dollar values can introduce bias into the estimation equation. Instead, we follow a methodology used by the Tax Policy Center (TPC) whereby we multiply exp(X2*β2) by a constant chosen to align the sample means of the tax unit values to the sample means of the SCF data for each asset and liability. This adjustment factor is calculated separately for married and nonmarried observations.
2.3 Adding Forbes Billionaires
As mentioned above, the SCF coverage of the United States falls short at the extreme top of the income distribution. In addition to this coverage gap, there is the added challenge that wealth holding in the US has changed substantially between 2019 and 2022, particularly among the ultra-wealthy.[28]
Literature in this area generally adds Forbes observations to SCF data and adjusts weights to account for overlap between the richest observations in the SCF and the poorest members of the Forbes 400 list. Even after inflating 2019 dollars to 2022 dollars, however, even the richest observations in the 2019 SCF have values for net worth far below the poorest members of the 2022 Forbes 400 list.[29]
To correct for this and to ensure that our data accurately reflects total wealth in 2022, we add to our tax data wealth information from the broader Forbes billionaires list, and then adjust the weights of our observations to ensure we were not double-counting wealth.[30]
Because the only information we have about Forbes individuals is their overall net worth, to generate more complete data we match them to tax unit observations by state, marital status and income. Once matched, we attribute to them the same set of tax unit characteristics and a tax unit weight equal to one.
2.4 Imputing Unrealized Capital Gains
Once we have imputed a value for total net worth to each of our tax model records and to Forbes records, the process for imputing unrealized gains onto our tax model is more straightforward.
The SCF collects data on four categories of unrealized gains: Primary residence, other real estate, stocks and mutual funds and actively managed businesses. Using the SCF, we calculate ratios of unrealized gains to net worth and apply those ratios to imputed net worth in our tax model.[31]
Because the ratio of unrealized gains to wealth varies substantially by income group, we calculate separate ratios by percentile. We also calculate separate ratios for married and single units, and for units whose unrealized wealth is negative. For example, we calculate the average ratio of unrealized gains to net worth for married families in the bottom 20th percentile and apply that same ratio to married families in the bottom 20th percentile in our tax model data. The ratio is unchanged from the ratios which we observe in the SCF and are applied to our imputed values of wealth.
In calculating these ratios, we removed a small number of significant outliers from the SCF data, primarily at the very bottom of the wealth distribution.
When we apply these ratios to our tax model data, we do so conditional on their ownership of a given asset that we estimated during the probit stage. A tax unit cannot own unrealized stock and mutual fund wealth if we determined that their probability of owning stocks is zero. The same is true for primary residences, other real estate, and business ownership.
Overall, we estimate that unrealized capital gains make up roughly 35 percent of total wealth, compared to 31 percent in the SCF. This difference can be largely attributed to the inclusion of Forbes wealth in our estimates. This ratio increases at higher levels of wealth, with unrealized gains making up almost 70 percent of billionaire wealth. For billionaires in our tax model, we gave them the same wealth to unrealized gains ratio as was present for billionaires in the SCF.
Endnotes
[1] Juliana Menasce Horowitz, Ruth Igielnik, and Rakesh Kochhar, “Most Americans Say There is Too Much Economic Inequality in the U.S., but Fewer Than Half Call It a Top Priority,” Pew Research Center, January 2020. https://www.pewresearch.org/social-trends/2020/01/09/most-americans-say-there-is-too-much-economic-inequality-in-the-u-s-but-fewer-than-half-call-it-a-top-priority/.
[2] Emmanuel Saez and Gabriel Zucman, “The Rise of Income and Wealth Inequality in America: Evidence from Distributional Macroeconomic Accounts,” Journal of Economic Perspectives, Fall 2020. Aditya Aladangady and Akila Forde, “Wealth Inequality and the Racial Wealth Gap,” FEDS Notes, October 2021. https://www.federalreserve.gov/econres/notes/feds-notes/wealth-inequality-and-the-racial-wealth-gap-20211022.html. Chuck Collins, Dedrick Asante-Muhammed, Josh Hoxie et al., “The Ever-Growing Gap: Without Change, African-American and Latino Families Won’t Match White Wealth for Centuries,” Institute for Policy Studies. August 2016. https://ips-dc.org/report-ever-growing-gap/.
[3] The unit of analysis here is actually a “tax unit,” meaning a person or group of people who file one income tax return or, in the case of non-filers, who could be expected to file one return if they did file. We use the words “household” and “family” to describe these tax units because they are more familiar terms
[4] After considering the impact of some inevitable amount of tax avoidance and evasion, which we assume to equal 20 percent of the total tax base, this implies a real-world tax base just shy of $21 trillion.
[5] Carl Davis, Misha Hill, and Meg Wiehe, “Taxes and Racial Equity: An Overview of State and Local Policy Impacts,” Institute on Taxation and Economic Policy. March 2021. https://itep.org/taxes-and-racial- equity/.
[6] Avery Newmark, “Forbes: These are the world’s 15 Black billionaires,” Access Atlanta. February 2022. https://www.ajc.com/life/celebrities/forbes-these-are-the-worlds-15-black-billionaires/PRWODTCBXNHZLLSQTZOHU5Y3B4/.
[7] Joe Hughes and Emma Sifre, “Investment Income and Racial Inequality,” Institute on Taxation and Economic Policy. October 2021. https://itep.org/investment-income-and-racial-inequality/.
[8] These findings suggest that the location of extreme wealth can sometimes be counterintuitive. States typically thought of as being wealthy, because they have large populations of upper-middle class or moderately wealthy families, do not necessarily always have a higher concentration of extreme wealth within their borders. On the other hand, states that tend to be perceived as having relatively low levels of overall wealth can have high concentrations of extreme wealth if a small number of very wealthy people choose to live there.
[9] See note 1.
[10] Greg Leiserson and Danny Yagan, “What Is the Average Federal Individual Income Tax Rate on the Wealthiest Americans?,” The White House. September 2021. https://www.whitehouse.gov/cea/written-materials/2021/09/23/what-is-the-average-federal-individual-income-tax-rate-on-the-wealthiest-americans/.
[11] Jesse Eisinger, Jeff Ernsthausen, and Paul Kiel, “The Secret IRS Files: Trove of Never-Before-Seen Records Reveal How the Wealthiest Avoid Income Tax,” Pro Publica. June 2021. https://www.propublica.org/article/the-secret-irs-files-trove-of-never-before-seen-records-reveal-how-the-wealthiest-avoid-income-tax.
[12] Internal Revenue Service, “Tax Gap Estimates for Tax Years 2011-2013.” November 2021. https://www.irs.gov/newsroom/the-tax-gap. Steve Wamhoff, “The U.S. Needs a Federal Wealth Tax,” Institute on Taxation and Economic Policy. January 2019. https://itep.org/the-u-s-needs-a-federal-wealth-tax/#_edn26.
[13] Brian Galle, David Gamage, Emmanuel Saez, et al., “The California Tax on Extreme Wealth (ACA 8 & AB 310): Revenue, Economic, and Constitutional Analysis.” March 2021. https://eml.berkeley.edu/~saez/galle-gamage-saez-shanskeCAwealthtaxMarch21.pdf.
[14] David Gamage and Darien Shanske, “States Should Consider Partial Wealth Tax Reforms,” Tax Notes State, May 2020. https://papers.ssrn.com/sol3/papers.cfm?abstract_id=3633474.
[15] Steve Wamhoff, “Frequently Asked Questions and Concerns About the President Billionaires’ Minimum Income Tax,” Institute on Taxation and Economic Policy. April 2022. https://itep.org/frequently-asked-questions-and-concerns-about-the-president-billionaires-minimum-income-tax/.
[16] Steve Wamhoff and Joe Hughes, “Revenue-Raising Proposals in President Biden’s Fiscal Year 2023 Budget Plan,” Institute on Taxation and Economic Policy. April 2022. https://itep.org/revenue-raising-proposals-in-president-bidens-fiscal-year-2023-budget-plan/.
[17] Steve Wamhoff and Joe Hughes, “Revenue-Raising Proposals in the Evolving Build Back Better Debate,” Institute on Taxation and Economic Policy. January 2022. https://itep.org/revenue-raising-proposals-in-the-evolving-build-back-better-debate/.
[18] Jeff Ernsthausen, James Bandler, Justin Elliott, et al., “More Than Half of America’s 100 Richest People Exploit Special Trusts to Avoid Estate Taxes,” Pro Publica. September 2021. https://www.propublica.org/article/more-than-half-of-americas-100-richest-people-exploit-special-trusts-to-avoid-estate-taxes.
[19] Carl Davis, “Paying the Estate Tax Shouldn’t Be Optional for the Super Rich,” Institute on Taxation and Economic Policy. November 2021. https://itep.org/paying-the-estate-tax-shouldnt-be-optional-for-the-super-rich/.
[20] Lily L. Batchelder, “Taxing Privilege More Effectively: Replacing the Estate Tax with an Inheritance Tax,” The Hamilton Project, Discussion Paper 2007-07, June 2007. https://www.hamiltonproject.org/papers/taxing_privilege_more_effectively_replacing_the_estate_tax_with_an_inh.
[21] Meg Wiehe, Aidan Davis, Carl Davis, et al., “Who Pays? A Distributional Analysis of the Tax Systems in
All 50 States,” Institute on Taxation and Economic Policy. October 2018. https://itep.org/whopays/.
[22] Federation of Tax Administrators, “State Personal Income Taxes: Federal Starting Points as of January 1, 2022,” Accessed September 2022. https://www.taxadmin.org/assets/docs/Research/Rates/stg_pts.pdf.
[23] Jenny Bourne, Eugene Steuerle, Brian Raub, et al., “More Than They Realize: The Income of the Wealthy,” 71(2) National Tax Journal, 2018. https://www.journals.uchicago.edu/doi/abs/10.17310/ntj.2018.2.05?journalCode=ntj. Dorothy A. Brown, “Congress is passing up a chance to close a tax loophole – and the racial wealth gap,” Washington Post. September 16, 2021. https://www.washingtonpost.com/outlook/2021/09/16/stepped-up-basis-race/.
[24] Carl Davis, “Reforming Federal Capital Gains Taxes Would Benefit States, Too,” Institute on Taxation and Economic Policy. September 2021. https://itep.org/reforming-federal-capital-gains-taxes-would-benefit-states-too/.
[25] Elizabeth McNichol and Samantha Waxman, “State Taxes on Inherited Wealth,” Center on Budget and Policy Priorities. June 2021. https://www.cbpp.org/research/state-budget-and-tax/state-taxes-on-inherited-wealth.
[26] The pooled sample of SCF data represents a total of 127 million families, compared to the ITEP model data which represent 172 million tax units.
[27] Because the SCF data are reported at the PEU level, we cannot disaggregate two unmarried individuals who are financially interdependent and living together. For the purposes of this analysis, we treat these couples as married.
[28] Between 2016 and 2019, total U.S. wealth grew from $87 trillion to $106 trillion. Between 2019 and 2021 (the last year for which we have 4 quarters of data), total US wealth grew from $106 trillion to $135 trillion.
[29] In 2022 dollars, the wealthiest observation in the SCF is worth $2.1 billion while the least wealthy person on the Forbes 400 list is worth $2.9 billion.
[30] Of the wealth held by the Forbes billionaires, about 90 percent of wealth is held by members of the Forbes 400 wealthiest Americans.
[31] This is similar to a process used in: Emmanuel Saez and Gabriel Zucman, “How to Get $1 Trillion from 1000 Billionaires: Tax their Gains Now,” April 2021. https://eml.berkeley.edu/~saez/SZ21-billionaire-tax.pdf.