Executive Summary
Setting goals for Congress and the President is important to guide policy and establish benchmarks for holding them accountable when they fail or actively thwart those goals. While tax policy is complex, the two most important goals are simple:
- The U.S. needs a tax code that is more adequate, meaning any major tax legislation should increase revenue, not reduce it.
- The U.S. needs a tax code that is more progressive, meaning any significant tax legislation should require more, not less, from those most able to pay.
The U.S. needs to increase, not reduce, the revenue it collects to finance public investments that benefit all Americans.
The U.S. collects less tax revenue as a share of its economy than most other comparable countries. The failure of Congress to raise taxes, and the periodic drive to further cut taxes, is associated with the U.S. investing less in the welfare and economic security of its people than most other comparable countries invest in theirs.
As explained in this report, the U.S. fails to raise enough revenue to pay for even the relatively limited government spending it does. The resulting budget deficit has raised concerns about its potential economic impact and is used by some lawmakers as an excuse to cut federal spending even further.
The U.S. needs to increase, not reduce, the progressivity of its tax code, meaning it needs to increase, not reduce, tax payments from those most able to pay.
The wealthy benefit more than anyone else from the society built with Americans’ tax dollars and therefore should be asked to pay more to support it. Further, the society we have created has become unbalanced, providing rewards to the wealthiest few that are many, many times more than needed to motivate investment, innovation, and work. The resulting inequality cannot be addressed without a more progressive tax system.
Progressivity has traditionally been defined in terms of income, but progressivity can be defined along other dimensions such as wealth or race as well. For example, tax breaks that favor income from wealth over other types of income favor white families who own a disproportionate share of wealth in the U.S., further exacerbating racial inequities.
Policymakers should pursue proposals that would achieve these two goals – increased revenue and increased progressivity – compared to current law.
The most sensible way to think about whether a tax proposal achieves or fails to achieve these goals is to compare the proposal to the tax code that already exists under current law. When lawmakers propose new tax legislation, would it raise revenue or reduce revenue compared to what would happen if Congress made no changes to tax law? Would it make the tax code more progressive or less progressive compared to what would happen if Congress made no changes to tax law?
While this seems straightforward, it becomes more complicated when the tax rules under current law change over time. For example, under current law, nearly all the significant changes made to the personal income tax and estate tax as part of the 2017 Trump tax law will expire at the end of 2025. Several provisions in the 2017 law that make business tax provisions less generous have begun to gradually go into effect as well. These are changes in the tax rules that are occurring or will occur because Congress wrote them into law in 2017.
President Trump and Congressional Republicans now propose to make the tax cuts they enacted permanent and repeal the meager tax increases on businesses that they enacted. This could reduce revenue by as much as $5.5 trillion over a decade, according to the Treasury Department.
Some Republicans argue that instead of acknowledging that this would cost $5.5 trillion compared to current law, they should characterize this as a continuation of “current policy” which would cost nothing.
But this would allow them to enact enormous tax cuts without taking responsibility for, or even fully debating, their true cost, which is far greater than the cost they presented to the public in 2017. (The Trump tax law, with its permanent and expiring provisions, was originally estimated to cost $1.5 trillion over the following decade.)
The two goals of tax policy discussed here, increased revenue and increased progressivity, are not the only ones possible. A potential third goal is to use the tax code as a tool to encourage behaviors and activities that benefit society and discourage those that harm society. This would include, for example, tax breaks to encourage production and use of sustainable energy, investments in low-income housing, and increased health insurance coverage. It could also include, for example, taxes on activities that contribute to climate change or harm financial markets. Taxes are one important tool to tackle these challenges, but because these policies address problems outside of tax policy, we do not discuss them in this report. Here we focus on goals that can only be directly met through tax policy – raising significant revenue and doing so in a progressive manner.
This report explains these goals in more detail, how policymakers should address them, and why the proposals of President Trump and his Congressional supporters would likely move us even further from achieving them.
The U.S. Should Raise More Revenue
There are many reasons for the federal government to raise more tax revenue than it currently does. Two stand out:
- The U.S. collects less tax revenue than other similar countries and as a result provides less investment in its people than other similar countries.
- The U.S. currently fails to raise enough revenue even to cover the meager spending it does, resulting in budget deficits that cannot practically be addressed without increased revenue.
A. The U.S. fails to raise sufficient revenue and make sufficient public investments.
The U.S. collects far less tax revenue as a share of its economy than most other economically developed countries. In 2023, the most recent year for which data are available, the U.S. collected revenue equal to 25 percent of its total economic output, while most countries in the Organisation for Economic Co-operation and Development (OECD) collected revenue equal to more than 35 percent of their economic output.
Only a handful of OECD countries collect less revenue as a share of GDP than the U.S., and they are all much smaller economies: Costa Rica, Turkey, Columbia, Ireland, Chile, and Mexico.
FIGURE 1
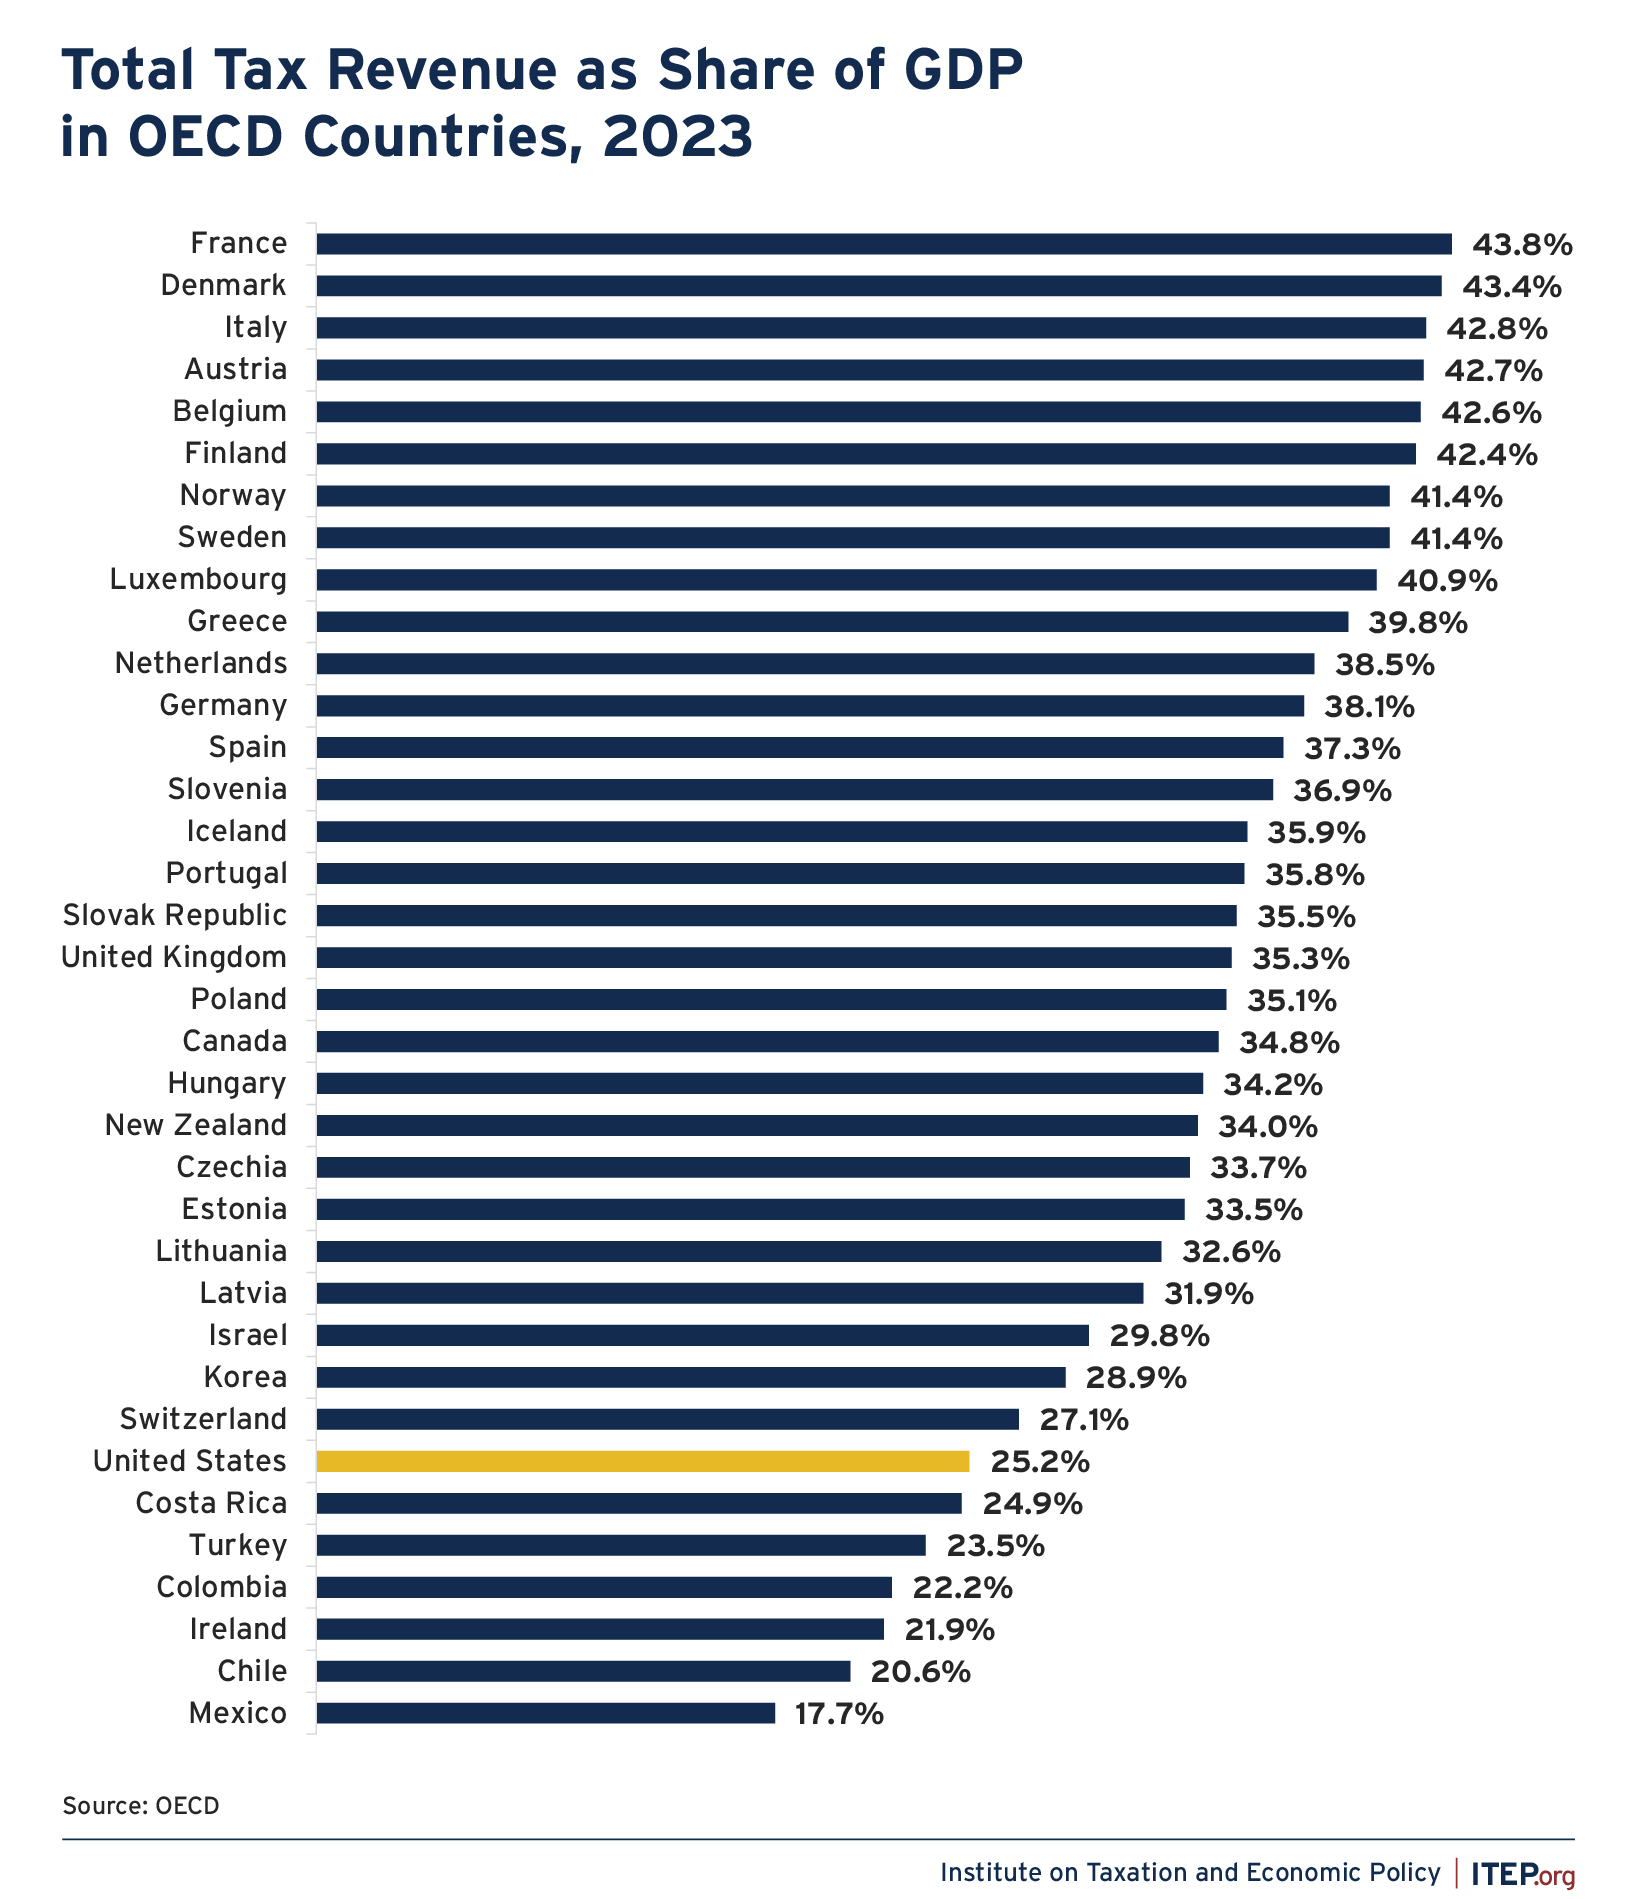
Some lawmakers claim that the U.S. is overtaxed, but this is plainly not true relative to most of the countries that we trade and compete with.
These figures include taxes that countries collect at all levels of government and therefore include federal, state, and local taxes for the U.S. While many U.S. states and localities need to raise taxes, the federal government has the greatest capacity to do so.
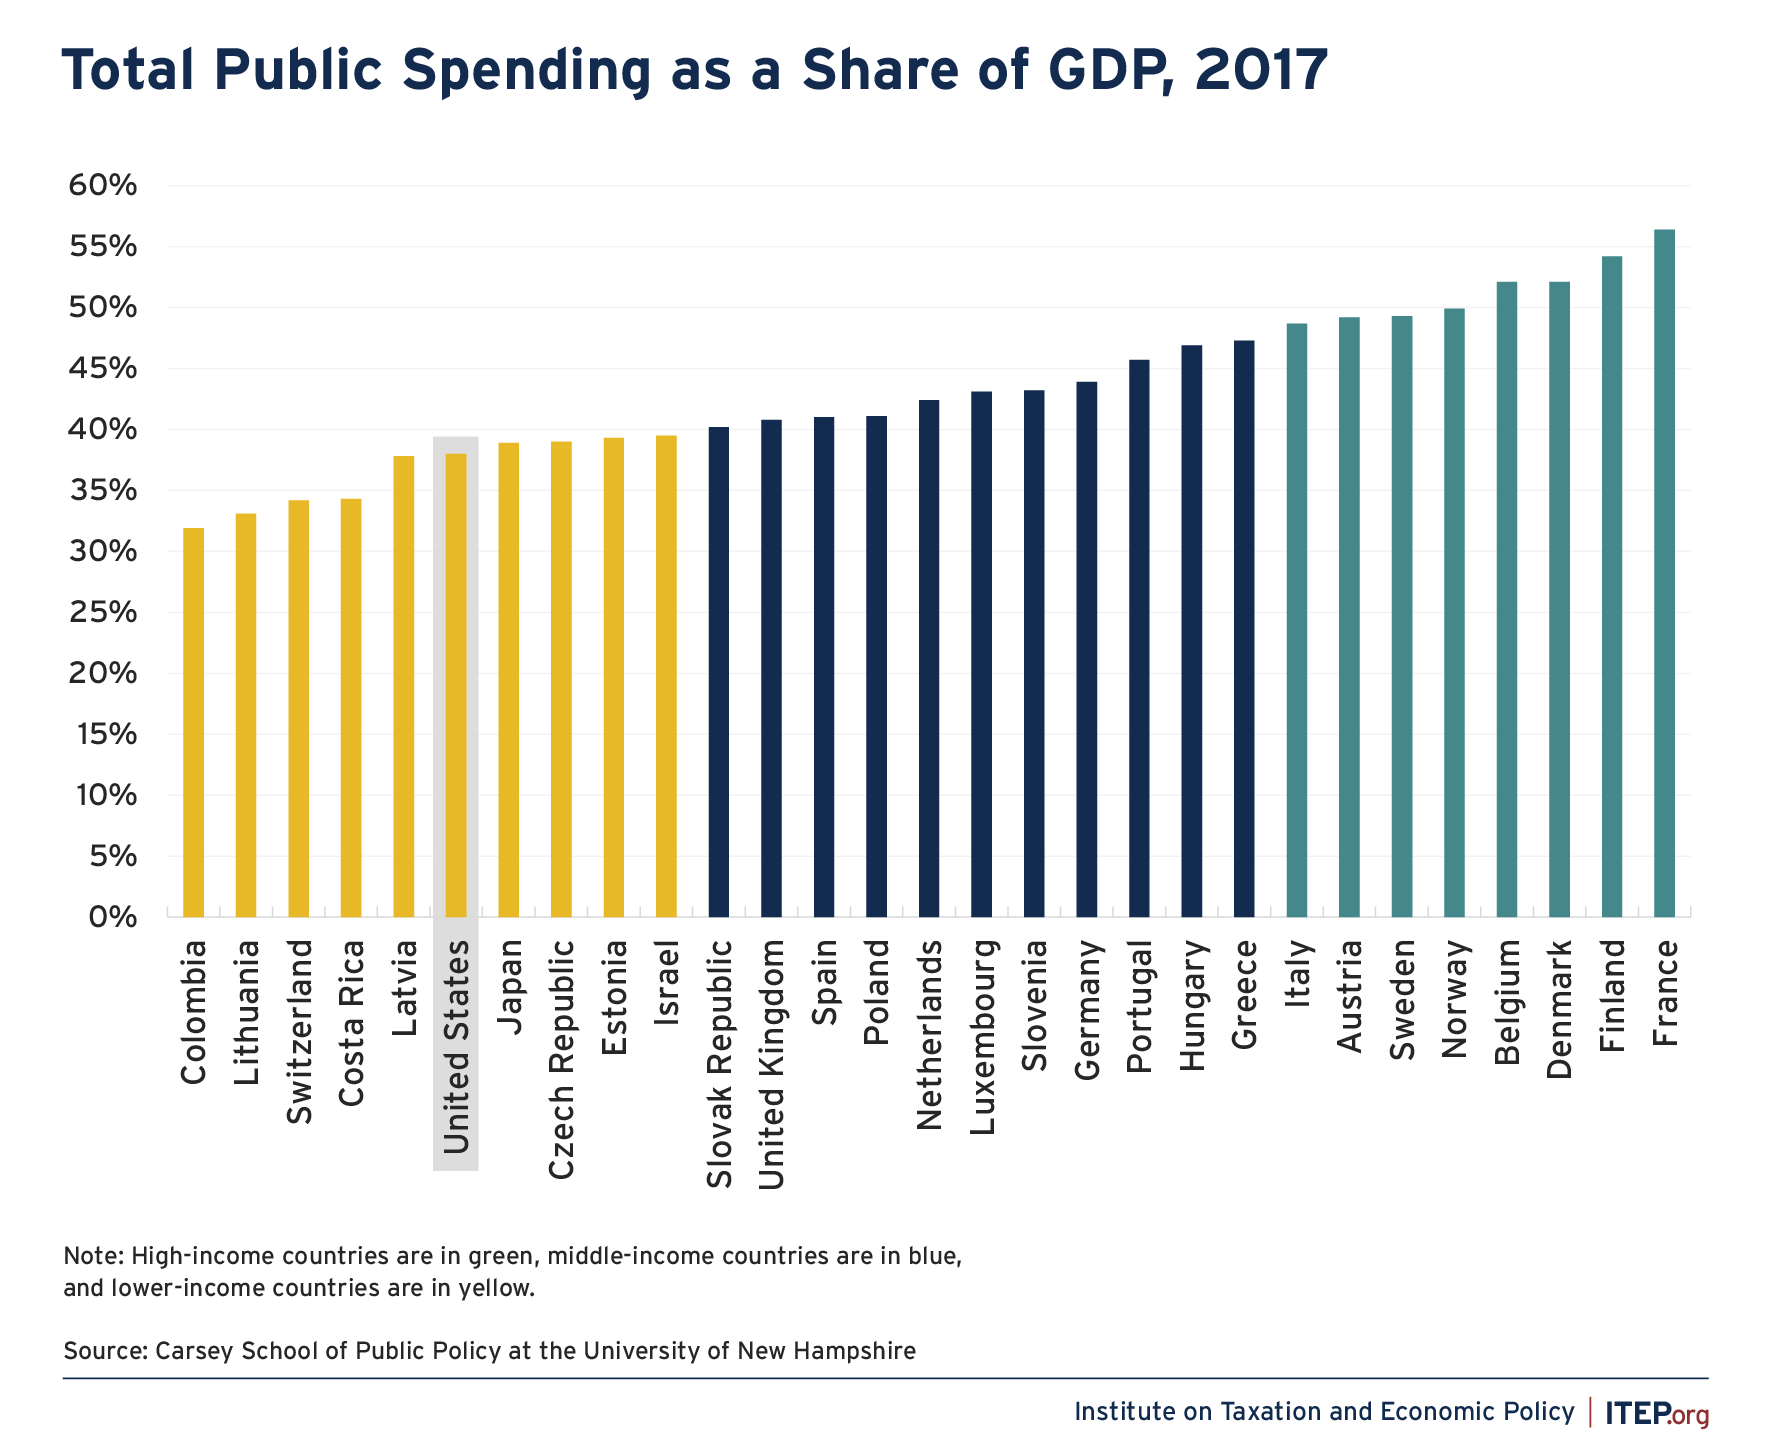
The hesitation of the federal government to raise as much revenue as comparable countries is a likely cause of its hesitation to provide as much public spending as other countries.
The U.S. provides less public spending than comparable countries whether measured as a percentage of economic output or on a per capita basis. A recent study ranked OECD countries for which public spending data was available, and the U.S. placed 24 out of 29. The only countries ranking lower were Latvia, Costa Rica, Switzerland, Lithuania, and Columbia. This method of comparing the share of economic output each country puts towards public spending reveals the choices they make about how to allocate resources.
FIGURE 2
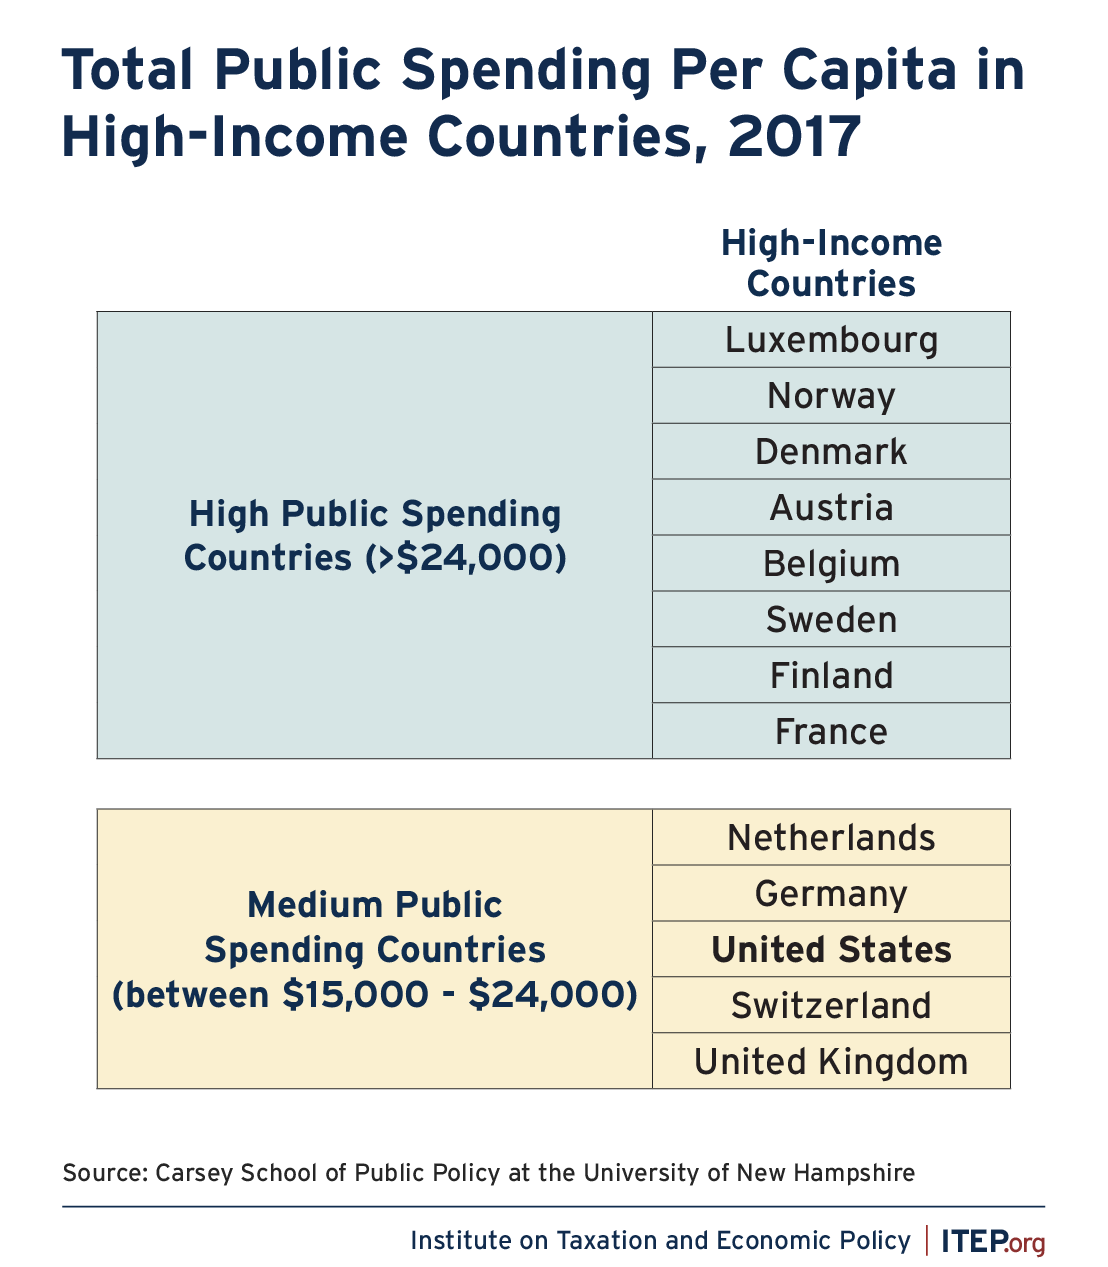
To understand the level of services that people receive from their governments, the same study grouped together countries with similar per capita (per person) incomes and compared their per capita public spending. Among the 13 OECD countries with the highest incomes, the U.S. ranks 11th on public spending per capita.
FIGURE 3
B. The U.S. fails to raise sufficient revenue to pay for the relatively limited public investments it provides, and the resulting budget deficit cannot be resolved without increased revenue.
Despite having relatively meager public investments in many areas, the U.S. also fails to raise enough tax revenue to pay for them. From 1962-2024, federal spending has averaged 20.5 percent of gross domestic product (GDP) while federal revenue collections have averaged just 17.3 percent of GDP.
FIGURE 4
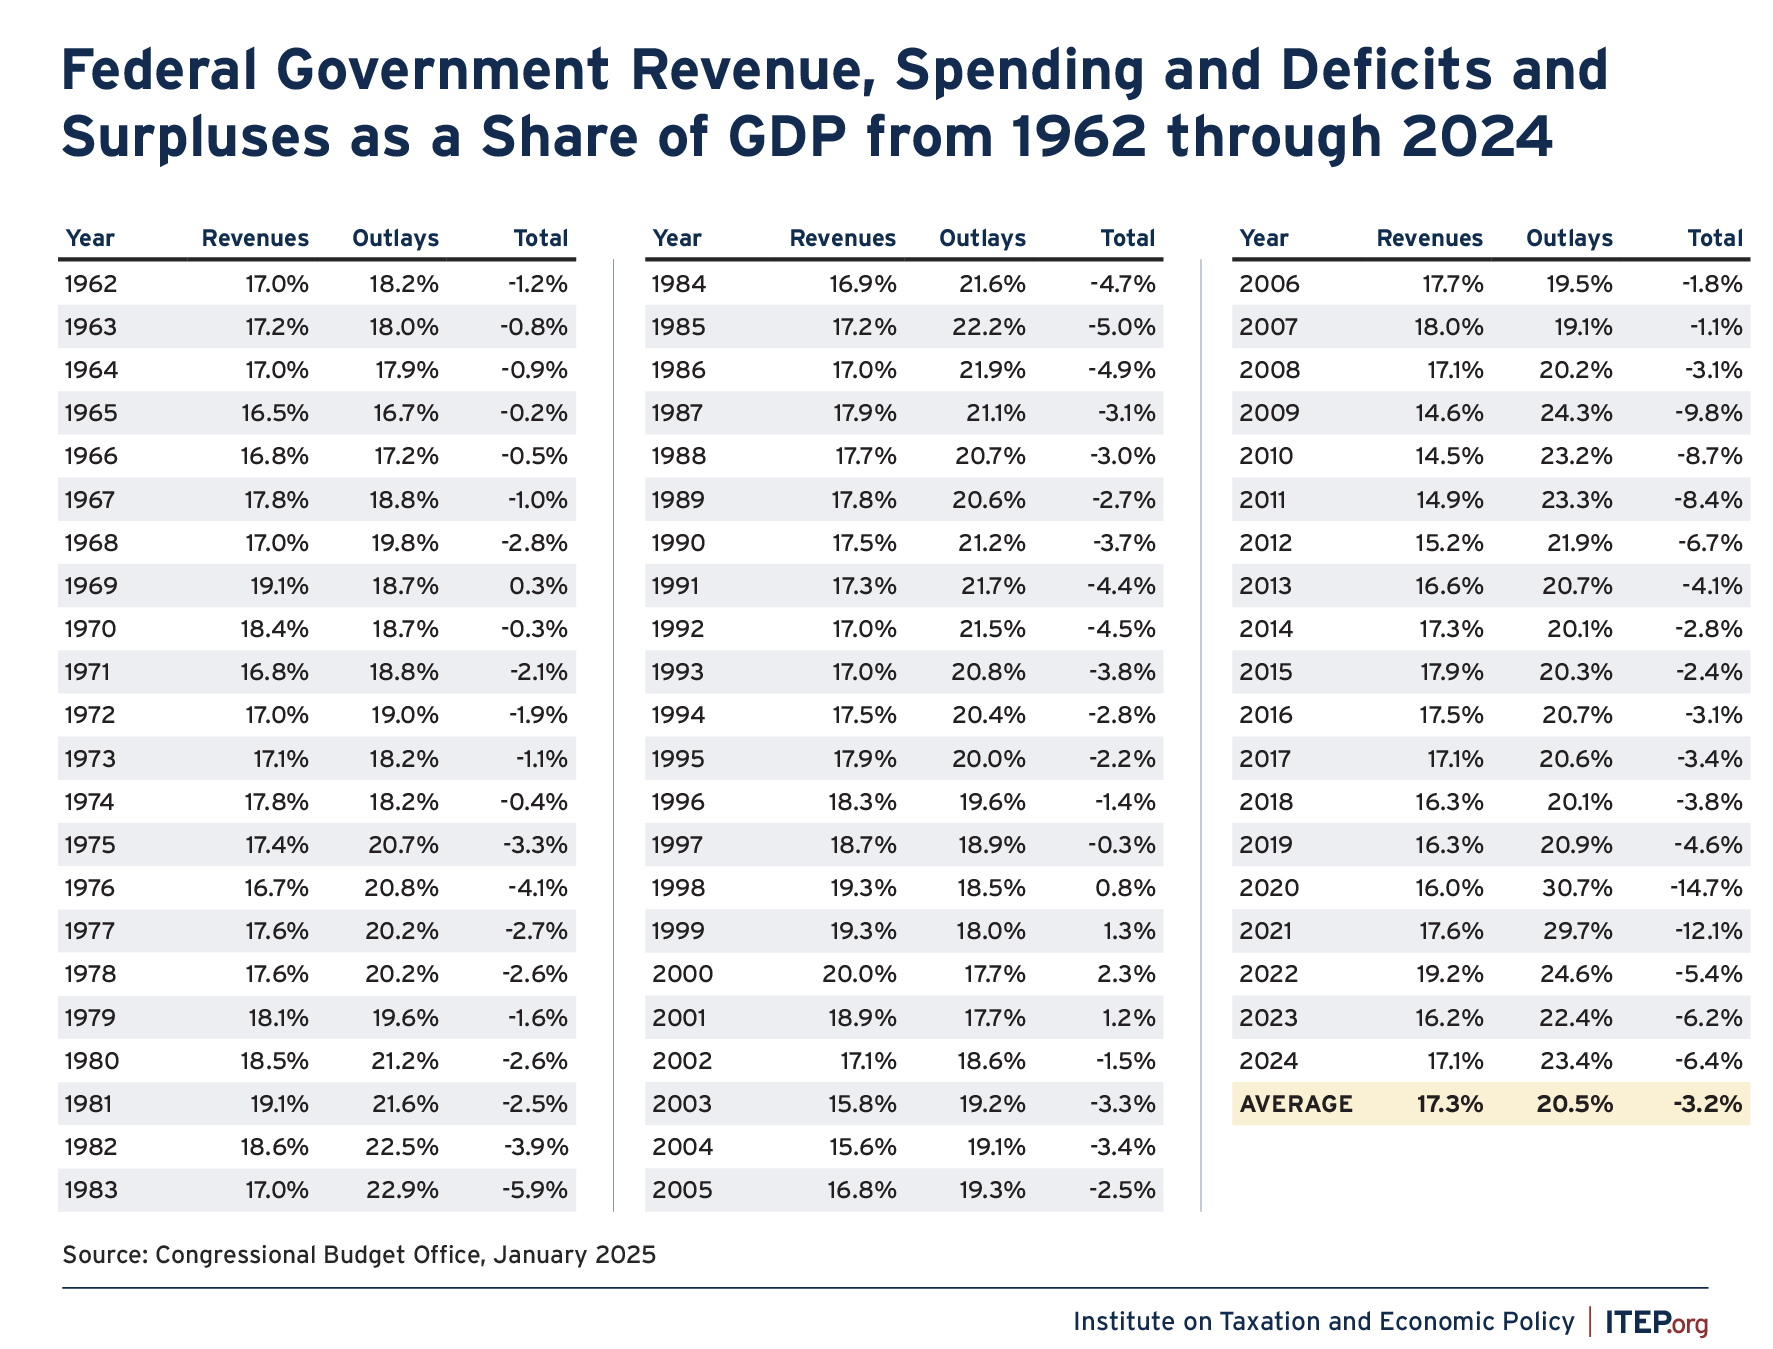
Some lawmakers have used the resulting budget deficits as a justification for cutting public spending even below its already low level. The federal budget deficit cannot be addressed without raising revenue for several reasons.
1. It is not viable to address the federal budget deficit with spending cuts.
Federal spending has averaged 20.5 percent of GDP over the past 60 years, while federal revenue has averaged just 17.3 percent over that period. American voters across the political spectrum would not support simply slashing spending to make them align. Federal spending ranged from about 21 percent to almost 23 percent of GDP during each year the White House was occupied by President Ronald Reagan, the premier champion of the conservative movement to limit the reach of government.
The vast majority of this public spending goes towards investments that the public has little interest in cutting. This includes health insurance programs such as Medicare, Medicaid and Affordable Care Act subsidies (24 percent of federal spending), Social Security (21 percent), defense (13 percent), veterans (8 percent), and education (5 percent).[1]
President Trump has said he would not cut Social Security or Medicare, which is the largest of the health insurance programs. It is difficult to imagine his party making significant cuts to spending on veterans or defense.
Another 13 percent goes towards interest payments on the national debt and Congress would likely cause cataclysmic economic havoc if it prevented the federal government from making those payments. The remaining 16 percent of federal spending is split up among much smaller programs such as transportation (2 percent), medical research (1 percent), law enforcement (1 percent), and others.
2. The only time the budget deficit has been eliminated in recent memory was when tax revenue was higher than usual.
As shown in Figure 4 above, from 1962-2024, the only years when federal revenues exceeded federal spending were the end of the Clinton administration and the following year, 1998-2001. Revenue was higher than usual, around 18 to 19 percent of GDP, in each of those years.
The budget surpluses of the Clinton administration were turned into deficits with the series of tax cuts enacted in the following years under President George W. Bush. Those tax cuts were scheduled to expire at the end of 2010, but in 2010 President Obama and Congress agreed to extend them for two years and then in 2012 they agreed to make some, but not all, of them permanent.
3. Aside from recessions, tax cuts enacted by Congress have been the main cause of budget deficits during the past 25 years.
The greatest budget deficits have occurred during recessions, when they are entirely warranted. During the Great Recession that began at the end of the George W. Bush administration and the pandemic-induced recession that began during the first Trump administration, budget deficits reached levels not seen since World War II. These recessions caused incomes (and the taxes paid on them) to collapse while federal spending increased (rightfully) to meet the rising needs.
Outside of recessions, federal budget deficits over the past 25 years have mostly been the result of tax cuts enacted by Congress. As a report from the Center for American Progress (CAP) explains, as recently as 2012 the Congressional Budget Office (CBO) projected the federal government would indefinitely collect more than enough revenue to cover federal spending outside of interest payments on the debt, meaning the debt would fall over time. (In other words, the federal government would eliminate its “primary” deficit, which excludes interest payments.)[2]
But the situation changed later in 2012 when President Obama compromised and made some, but not all, of the Bush tax cuts permanent. The nation’s fiscal outlook further deteriorated with the enactment of the Trump tax cuts in 2017. Taken together, these tax cuts have cost more than $10 trillion in the first quarter of this century, according to the CAP report, and are the cause of the current deficits.
4. Many lawmakers who claim to be concerned about federal budget deficits also support enacting more tax breaks that will dramatically increase the deficit.
CBO projects that the Republican proposal to extend the personal income tax provisions and estate tax provisions of the Trump tax law, which will otherwise expire at the end of 2025, will almost immediately increase the primary deficit by about 50 percent. (This is not even counting the possible extension of some corporate provisions that lawmakers attempted to move on a different track during the previous Congress as part of a doomed deal that would also have expanded the Child Tax Credit.)[3]
In 2027, CBO projects a primary federal budget deficit of around $600 billion, which will be about 2 percent of GDP. The bill in Congress to extend Trump’s personal income tax and estate tax provisions (the TCJA Permanency Act) would increase the primary deficit by a little more than $300 billion in 2027 alone according to CBO.[4] This would increase the primary deficit by about 1 percent of GDP, from about 2 percent of GDP to 3 percent of GDP.
FIGURE 5
Effects of Extending the 2017 Tax Provisions that Are Scheduled to Expire at the End of 2025, as a Share of GDP
| 2025 | 2026 | 2027 | 2028 | 2029 | 2030 | 2031 | 2032 | 2033 | 2034 | |
| Total Deficit (includes interest) | -6.2% | -5.5% | -5.2% | -5.7% | -5.5% | -5.9% | -5.9% | -6.0% | -6.5% | -6.1% |
| Primary Deficit | -3.0% | -2.2% | -1.9% | -2.2% | -2.0% | -2.2% | -2.2% | -2.2% | -2.5% | -2.1% |
| 2017 Tax Law Extension | 0.0% | -0.5% | -1.0% | -1.1% | -1.0% | -1.0% | -1.0% | -1.0% | -1.0% | -1.0% |
| Primary Deficit with 2017 Tax Law Extension | -3.0% | -2.7% | -2.9% | -3.3% | -3.0% | -3.3% | -3.2% | -3.2% | -3.6% | -3.2% |
Source: Congressional Budget Office, Budgetary Outcomes Under Alternative Assumptions About Spending and Revenues, May 2024. The estimates are adjusted using Congressional Budget Office, The Budget and Economic Outlook: 2025 to 2035, January 2025.
The U.S. Should Have a More Progressive Tax System
The U.S. needs to increase, not reduce, the progressivity of its tax code, meaning it needs to increase, not reduce, tax payments from those most able to pay.
A tax system is generally considered progressive to the extent that it is financed by people based on their ability to pay. Most Americans intuitively believe that those with the most resources should contribute more and have told pollsters for years that high-income Americans and profitable corporations should pay more in taxes, not less.[5]
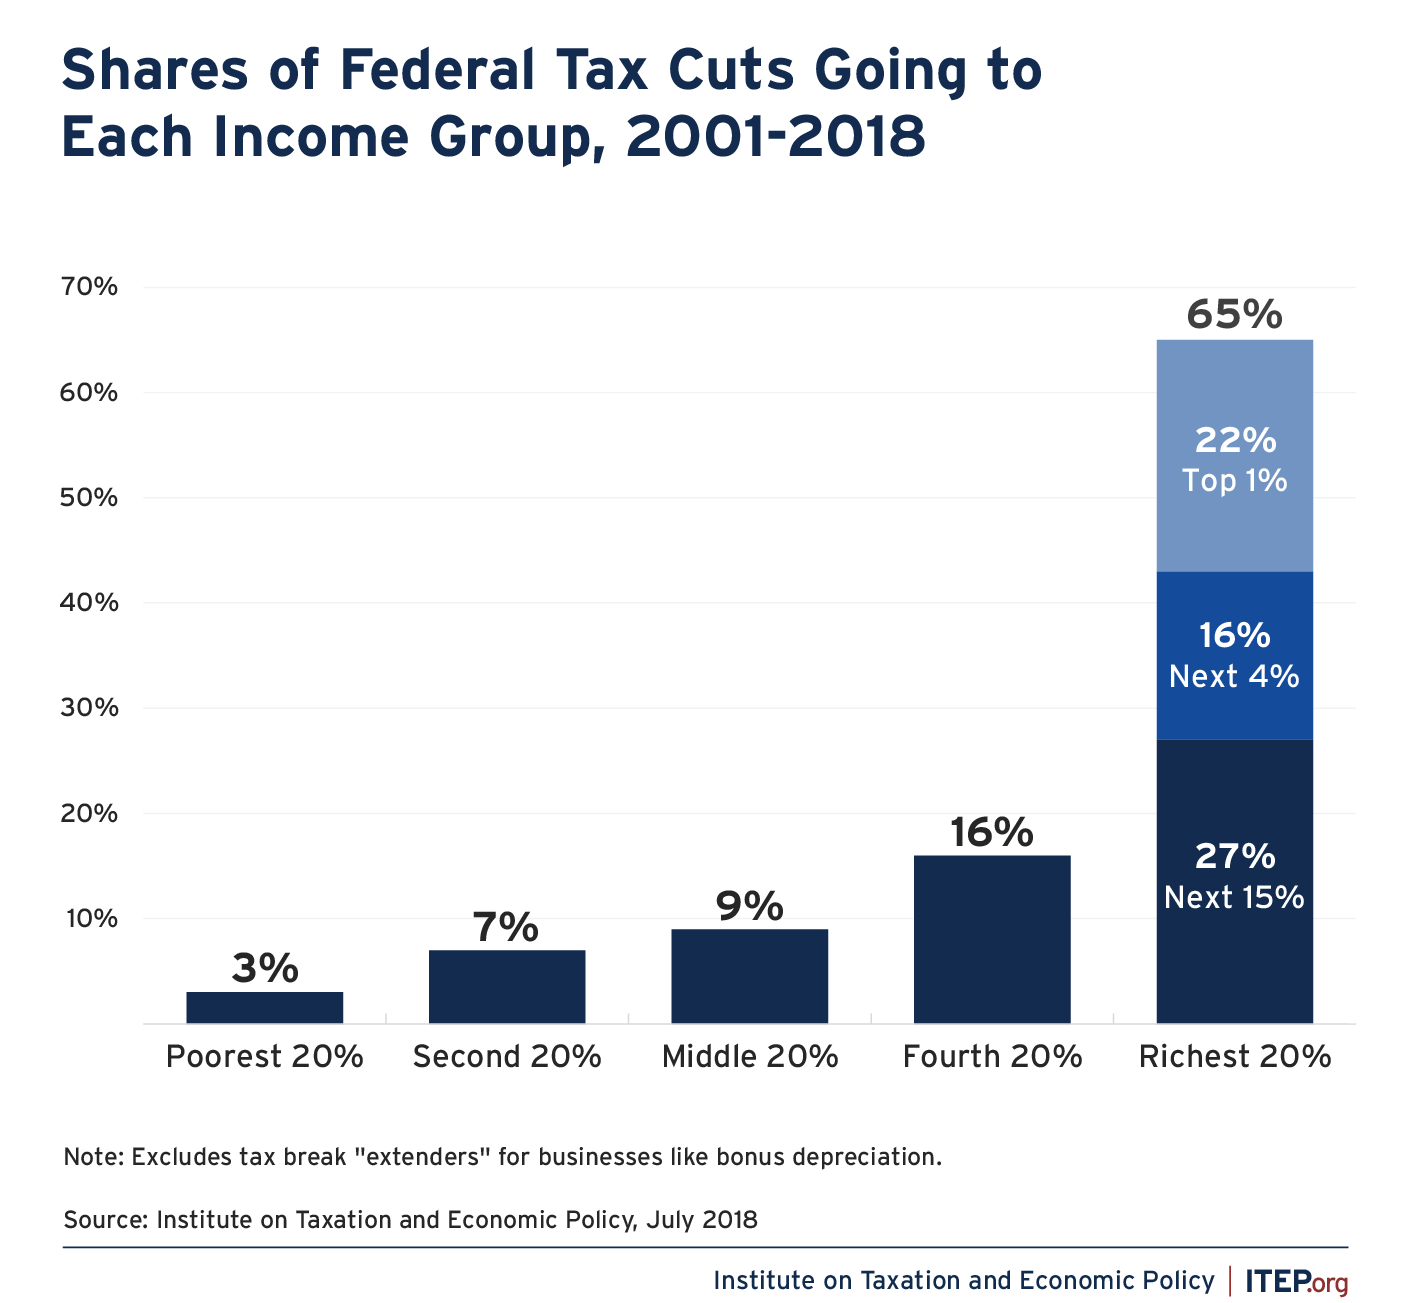
Over the past 25 years, however, our tax system has moved in the opposite direction. A 2018 ITEP report concluded that the tax cuts enacted from 2001 through that year had already cost $5.1 trillion at that point with nearly two-thirds of that amount flowing to the richest fifth of Americans and 22 percent of that amount flowing to the richest 1 percent alone.[6] Congress should reverse course.
FIGURE 6
A. Reasons Why the U.S. Should Have a More Progressive Tax Code
There are several reasons why lawmakers should make our tax code more, not less, progressive.
First, the wealthy benefit more than anyone else from the society built with Americans’ tax dollars and therefore should be asked to pay more to support it. The wealthiest Americans acquired their position because their corporations used public roads to ship goods, their companies employed the workforce created by our public education system, their customers bought products derived from government-funded research, and their investments were possible because of the courts that defined property rights and the public safety personnel who enforced those rights.
All Americans benefit from these public investments, but it is beyond doubt that Jeff Bezos, Elon Musk, Michael Bloomberg, and other billionaires have benefited more than others. It is entirely reasonable for Americans to demand a progressive tax system to ensure the lucky few pay their fair share to support these investments.
Second, a dollar is more valuable to a poor family than it is to a rich family, and the reverse is also true. For example, imagine a country where everyone pays a flat income tax of 10 percent. Paying this tax might require significant sacrifice and reduction in material well-being for a minimum-wage worker. It could mean the difference between being able to put food on the table or not. In contrast, a person earning more than $5 million a year would experience this tax as a less acute sacrifice, perhaps the difference between owning four enormous homes or three enormous homes.
Even Adam Smith, the 18th century economic philosopher who described the virtues of free markets unfettered by government, expressed this basic intuition when he wrote:
The necessaries of life occasion the great expense of the poor. They find it difficult to get food, and the greater part of their little revenue is spent in getting it. The luxuries and vanities of life occasion the principal expense of the rich … It is not very unreasonable that the rich should contribute to the public expense, not only in proportion to their revenue, but something more than in that proportion.[7]
Third, our society has become unbalanced, providing rewards to the wealthiest few that are many, many times more than needed to motivate investment, innovation, and work. The resulting inequality cannot be addressed without a more progressive tax system.
The Congressional Budget Office (CBO) recently confirmed that from 1989-2022 wealth in the U.S. became increasingly concentrated in the hands of the few.
Even when counting expected income that less wealthy families will receive from pensions and Social Security as “wealth,” CBO still found that Americans in the entire bottom half of the wealth distribution owned only a paltry 6 percent of the wealth throughout this period.
Meanwhile, the share of wealth owned by the top 10 percent rose from 56 to 60 percent during this period and the share owned by the richest 1 percent rose from 23 to 27 percent.[8] Many Americans rightfully fear that democracy cannot function well when a small number of people have vastly more resources, and thus vastly more political power, than everyone else.
B. How to Define and Measure Progressivity in Our Tax Code
To determine whether tax changes are achieving our goals, we must measure their consequences. Progressivity has traditionally been defined in terms of income, but progressivity can be defined along other dimensions as well, such as race. Many tax cuts enacted in recent years have worsened income and racial inequality.
1. Progressivity Related to Income
The progressivity or fairness of a tax system can be assessed by examining the taxes paid by various income groups relative to their income. The rest of this section describes two different ways to make this assessment.
The first includes all the taxes that Americans pay at the federal, state, and local levels and compares this total tax amount to income as it is traditionally defined in tax policy. This generally is what most people think of as income: money they receive as wages, as business profits, as Social Security payments, or as dividends, for example. This is mostly the type of income that people report on their income tax returns. The benefit of this approach is that this definition of income is easily understood, and people can quickly see where they personally fall in distribution tables.
The second approach would also compare all the taxes paid by Americans to income but would use a more complete definition of income. Along with the types of income normally reported on tax returns, this definition also includes, among other additions, “unrealized” capital gains, which is the appreciation on assets that a taxpayer has not sold. Because unrealized capital gains income flows primarily to the very wealthiest Americans, this approach has the benefit of providing a better picture of what well-off people pay in taxes relative to their true capacity to pay taxes—albeit while making the measure harder to understand because of its non-intuitive definition of income.
Both approaches have their benefits. Under either approach, including all types of taxes that people pay is important. Some politicians and pundits who are opposed to more progressive taxation claim the system is already sharply progressive and cite data on only one or two taxes that are, in fact, progressive, presenting a very misleading picture of the overall tax system.[9]
Comparing Taxes to a Traditional Definition of Income
Our tax system is just barely progressive even if one relies on the relatively traditional definition of income limited to money people receive as payments, profits or earnings and which is mostly the income reported on personal income tax returns.
America’s tax system consists of a relatively progressive federal tax system but also state and local taxes that are relatively regressive, meaning they take a larger share of income from the poor than the rich. The mostly progressive federal taxes offset the regressive effect of state and local taxes, leaving an overall tax system that is just barely progressive. Most Americans believe our tax system should be progressive, and yet it just barely meets that goal even when measured in a relatively conservative way.
A previous ITEP report using this approach found that in 2024 the richest 1 percent paid about 24 percent of all federal, state, and local taxes and received about 20 percent of the total income in the U.S. So, it is true that the share of total taxes paid by the richest 1 percent exceeds their share of total income but not by nearly as much as many lawmakers claim.
FIGURE 7
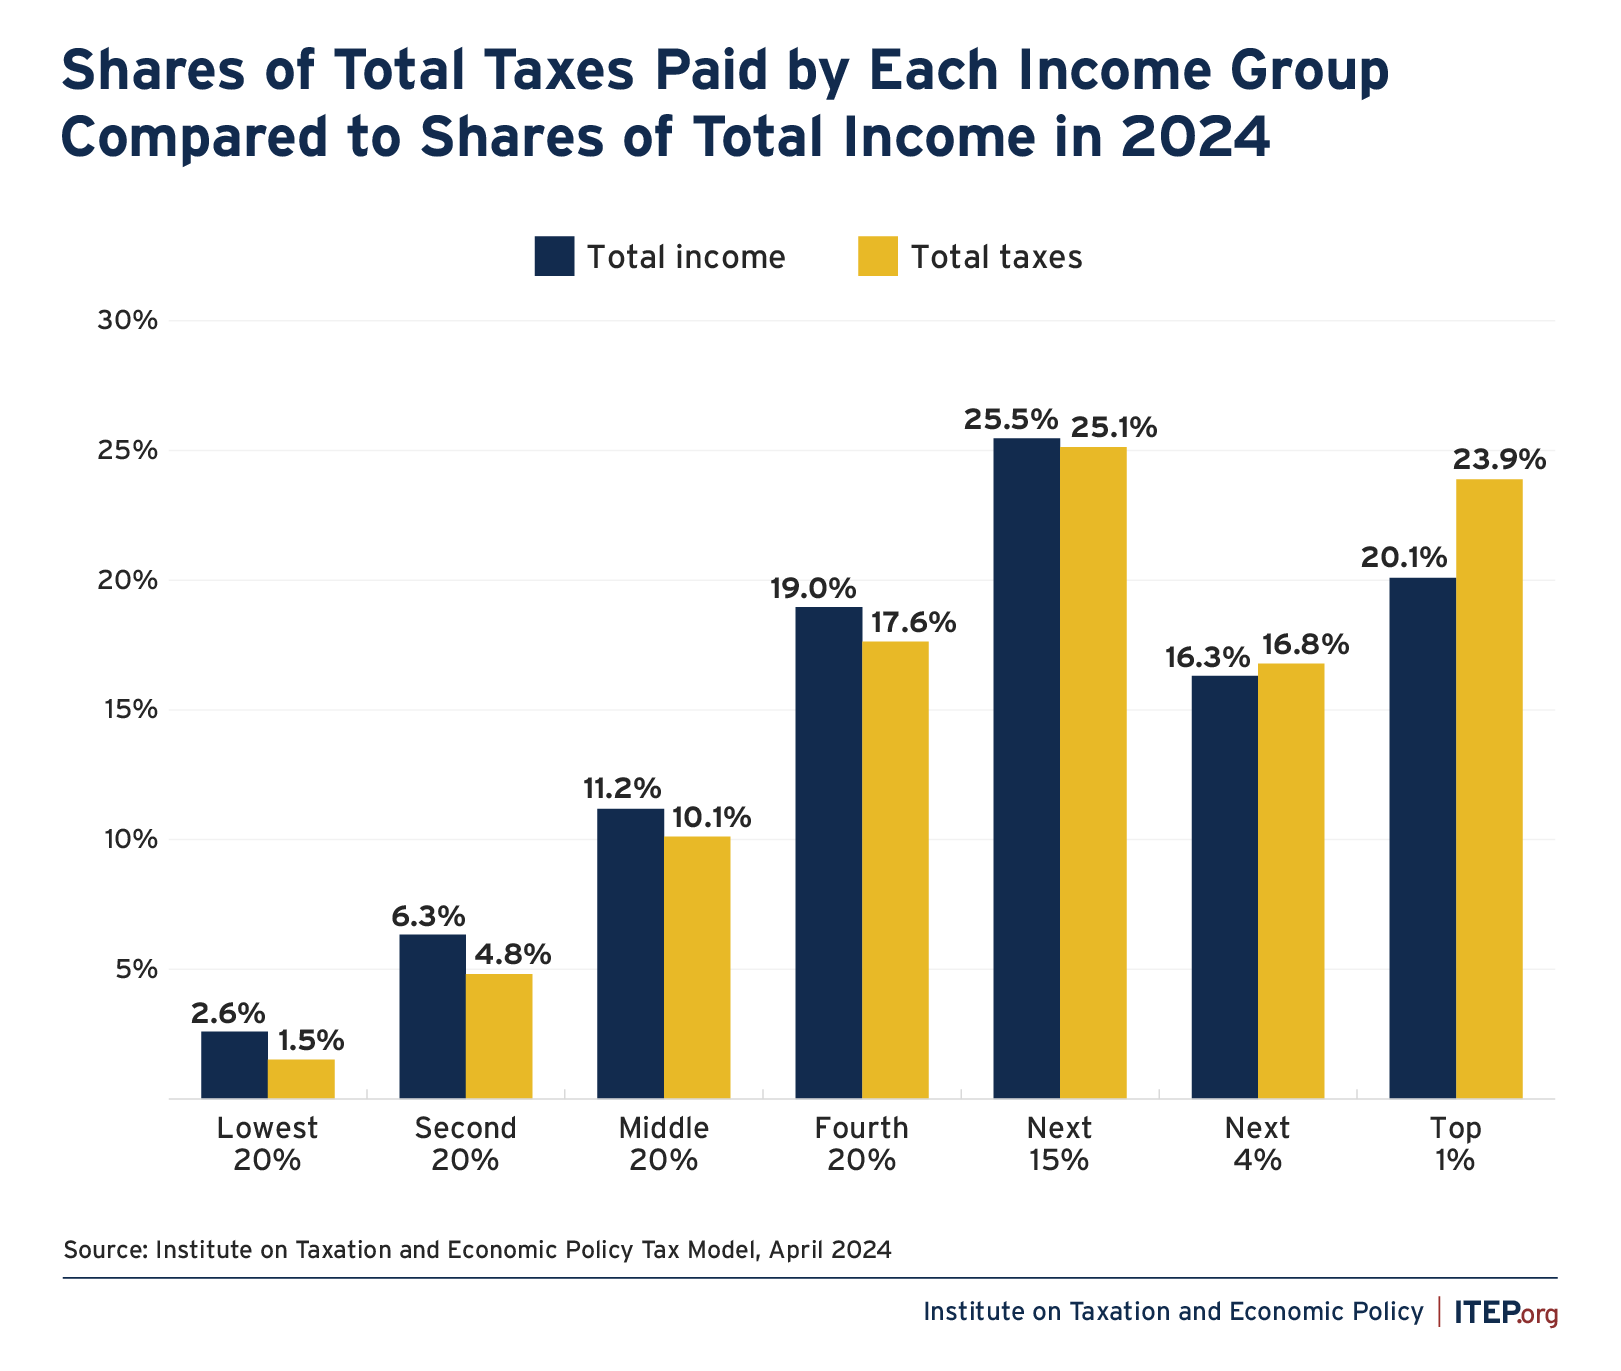
Meanwhile, the poorest fifth of Americans paid 1.5 percent of the total (federal, state, and local) taxes in the U.S. and received 2.6 percent of total income in the U.S. So, it is true that the share of total taxes paid by the poorest fifth of Americans is slightly smaller than their share of total income. But this has clearly not placed the poorest fifth of Americans in a particularly comfortable or enviable position.
The Progressivity of the Federal Tax Code Is Important but Limited
While they all need serious reform to meet their potential, our federal tax system includes several progressive taxes.
- The federal personal income tax has several progressive features, including:
- Progressive rates, meaning it applies higher marginal rates to higher levels of income
- Refundable or partly refundable credits like the Earned Income Tax Credit, which benefits low-income working people, and the Child Tax Credit, one of the few federal policies that directly addresses child poverty.
- The federal corporate income tax is progressive because it mostly affects corporate shareholders, who are disproportionately wealthy.[10]
- The federal estate tax applies to the fortunes passed down through very wealthy families. Less than 1 percent of Americans leave an estate large enough to be affected by this tax.[11]
- The taxes that (either as a statutory matter or in principle) fund Medicare are progressive when considered altogether. These include:
- A flat Medicare tax paid on earnings of individuals
- The additional Medicare tax that applies at a higher rate to top earners
- The net investment income tax which ensures that wealthy people pay a comparable tax on their investment income
But there are aspects of the federal tax system that are not progressive.
- The Social Security payroll tax applies at a flat rate on earnings up to just $176,100. This means that someone who earns $30,000 or $60,000 or $160,000 will pay the Social Security payroll tax on all their earnings while someone who earns $12 million (for example) in a single year will pay the Social Security payroll tax on only a tiny fraction of their earnings.
- Even the progressive federal taxes have loopholes and special breaks that make them less progressive than they should be. For example, the personal income tax includes several breaks that allow income generated from wealth to be taxed more lightly than income generated by work, as discussed later in this report.
Unlike most federal taxes, state and local taxes are mostly regressive. Among the 50 states and the District of Columbia, 41 states tax high-income people less than everyone else.[12] This has an enormous impact because everyone in the U.S. pays state and local taxes.
Comparing Taxes to a More Complete Definition of Income
If anything, the figures above overstate the progressivity of America’s tax system because ITEP’s analysis does not include unrealized capital gains, a type of income that is extremely significant to very well-off individuals but which does not appear in most types of tax data.
The income included in ITEP’s data is mostly the income taxpayers are required to report to the IRS. This primarily includes funds that have changed hands: wages paid from an employer to an employee, profits paid from a corporation to a shareholder, profits received by investors when they sell assets, and the like. But there is another type of income that flows in vast amounts to the wealthy, which taxpayers are not required to report to the IRS. This income is unrealized capital gains, or the increase in value of assets that people have not yet sold. If unrealized capital gains were included in ITEP’s data, this analysis would show that the tax system is even less progressive than illustrated here.
As described in an exposé from ProPublica, the wealthiest Americans have vast amounts of unrealized capital gains that are not subject to the personal income tax and therefore not included in these data.
For example, Jeff Bezos’ net worth increased by $99 billion from 2014 through 2018 because the value of his stock climbed that much. But his income as defined by the tax code was just $4.2 billion.[13] Economists consider Bezos’s $99 billion of asset appreciation (unrealized capital gains) to be income, but our current tax rules do not, so it goes untaxed.
We already have enough information to know that the very richest Americans pay very little in taxes as a share of their total income (including unrealized capital gains as well as other income). President Biden’s Council of Economic Advisers found that the wealthiest 400 families in the U.S. paid an effective federal personal income tax rate of just 8.2 percent from 2010 through 2018 if unrealized gains on corporate stocks were included in the definition of income.[14]
2. Progressivity Related to Race
While analysts have long studied the effects of tax proposals and tax policies on Americans across different income groups, only recently has substantial mainstream attention turned to their effects across racial and ethnic groups. Comprehensive data on the effects of tax policies on racial equity is limited because the IRS currently does not collect such data. But researchers have pieced together an unsettling picture of how several features of our tax system worsen racial inequity.
America’s history of slavery and the discrimination that followed have left the average income for Black households lower than the average income for white households. This means that any tax breaks that favor high-income taxpayers will disproportionately benefit white taxpayers. For example, the reductions in personal income tax rates that were enacted as part of the 2017 Trump tax law disproportionately benefit high-income people and white families, as explained in the next section.
But racial inequities in the tax code run much deeper than that. Dorothy Brown, a leading scholar on tax law and race, has demonstrated how the tax code can often treat the typical Black family less generously than the typical white family even when they have the same income.[15]
Here is just one of many examples. Wealth is even more disproportionately concentrated among white households than income, and an entire class of tax breaks specifically benefit those with wealth.
For example, realized capital gains (profits generated from selling assets) are taxed less than other types of income, like income earned from work, as explained further on. A white family is likely to pay less in personal income taxes than a Black family even if the two families have the same overall income, because the white family is statistically more likely to receive some of its income in the form of capital gains rather than work.
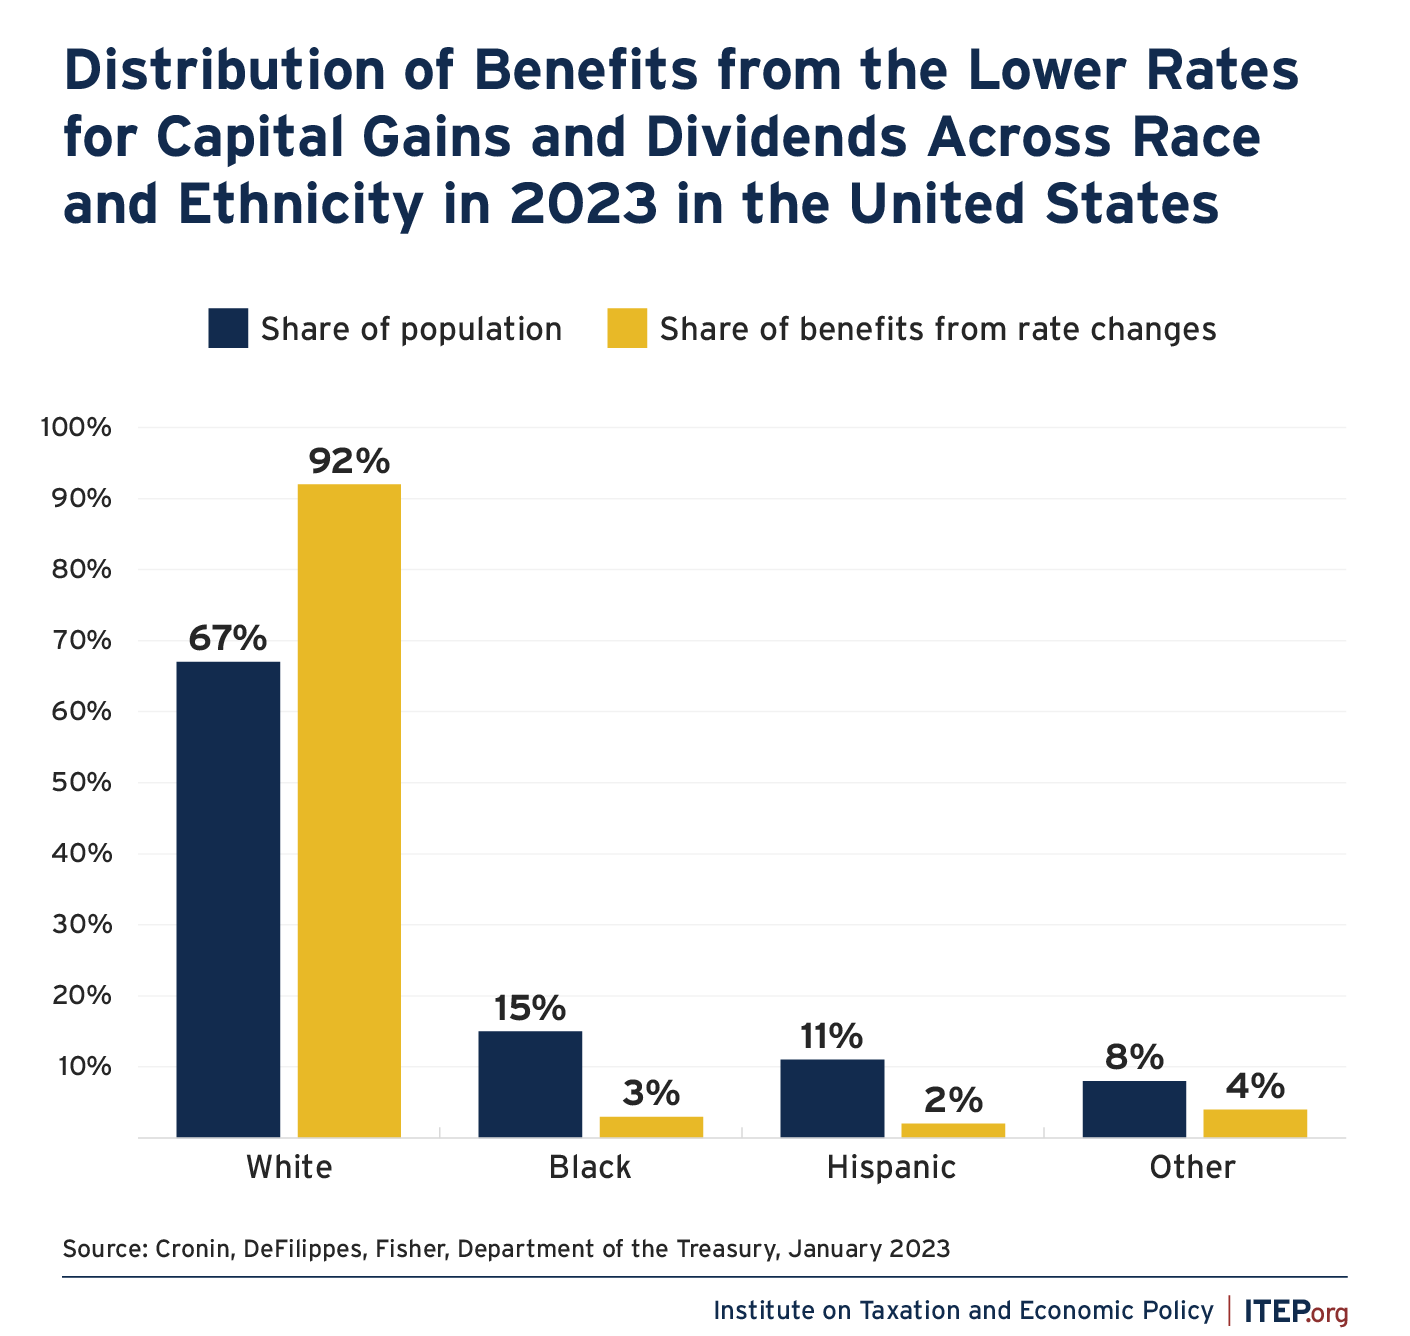
The most well-known tax break for capital gains is the lower personal income tax rates that apply to long-term capital gains that are realized (and corporate dividends). The Treasury Department recently found that while Hispanic and Black taxpayers made up 15 and 11 percent of total U.S. taxpayers in 2023, they received only 3 percent and 2 percent, respectively, of the benefits from these lower tax rates.[16]
Of course, some Black families receive capital gains and dividends, and many white families do not. But in the aggregate, capital gains, dividends, and other types of income from wealth flow disproportionately to white taxpayers, which in turn means that tax breaks for these types of income build racial inequity into our tax code rather than building the kind of progressivity that would mitigate racial inequality as well as income inequality in America.
Examples of Tax Policies that Significantly Impact Revenue and Progressivity
Congress has important choices to make this year related to the federal tax code. The tax law enacted by President Trump and Congressional Republicans in 2017 permanently cut the federal corporate income tax and made temporary changes that mostly affect the federal personal income tax and estate tax. The 2017 law scheduled the vast majority of the temporary provisions to expire at the end of 2025. As a result, many lawmakers are motivated to enact significant tax legislation during this Congress to extend all or some of these provisions before they expire. The extensions could be packaged in legislation that also includes completely new changes to the tax code.
The resulting tax debate could be an opportunity for Congress to make changes that raise revenue and enhance progressivity in our tax system. However, this is an unlikely outcome. The tax plan Trump campaigned on (which includes extending the 2017 provisions as well as many other changes) would reduce tax revenue by about $270 billion in the first year, ITEP has found. Trump’s plan would also make our tax system less progressive because it would cut taxes, on average, for the richest 5 percent of Americans while raising taxes, on average, for all other income groups.[17]
Lawmakers who are serious about raising revenue and making our tax system progressive should do two things:
- Avoid extending costly and regressive temporary tax provisions, or at least avoid extending them entirely.
- Repeal or limit costly and regressive permanent tax provisions.
A) Examples of Costly and Regressive Temporary Provisions that Congress Should Not Extend
1. Trump’s Reductions in Federal Personal Income Tax Rates
Trump proposes to extend the many provisions of his 2017 tax law that will otherwise expire as scheduled at the end of 2025. The most expensive would be the 2017 law’s changes to personal income tax rates and brackets.
FIGURE 8
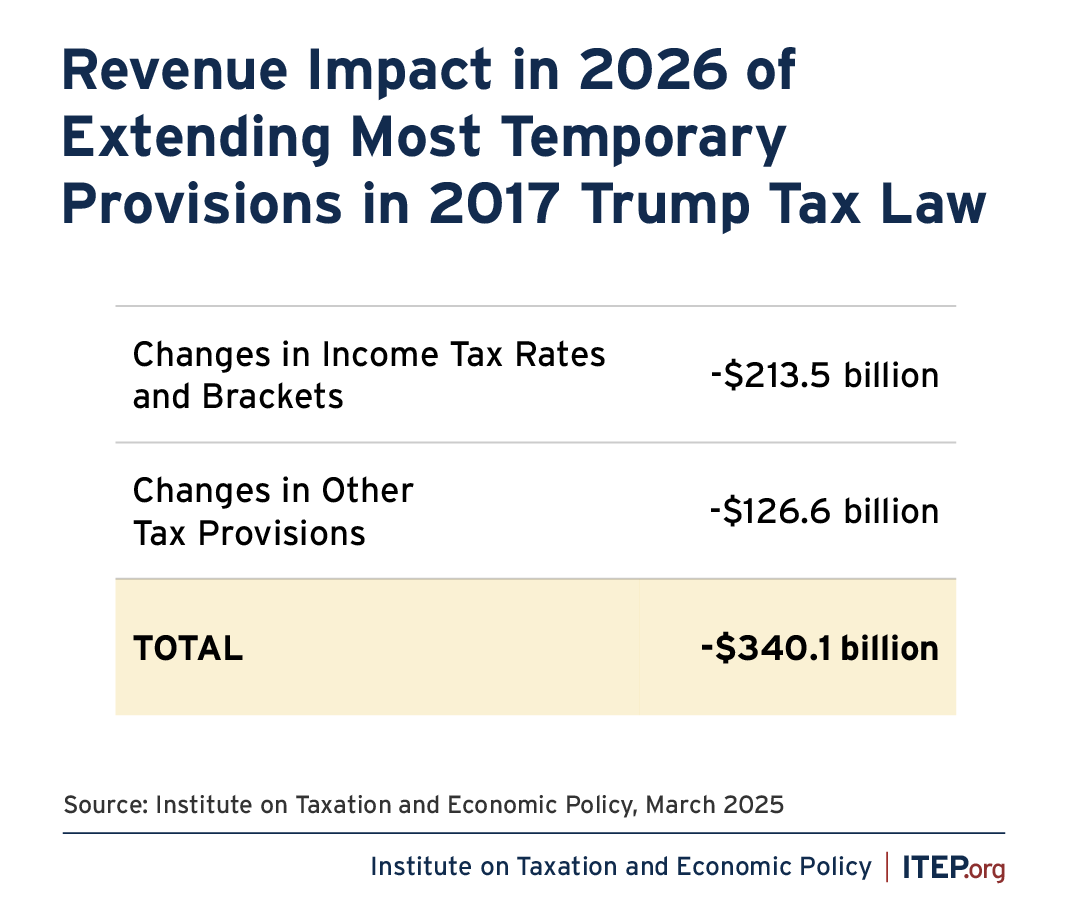
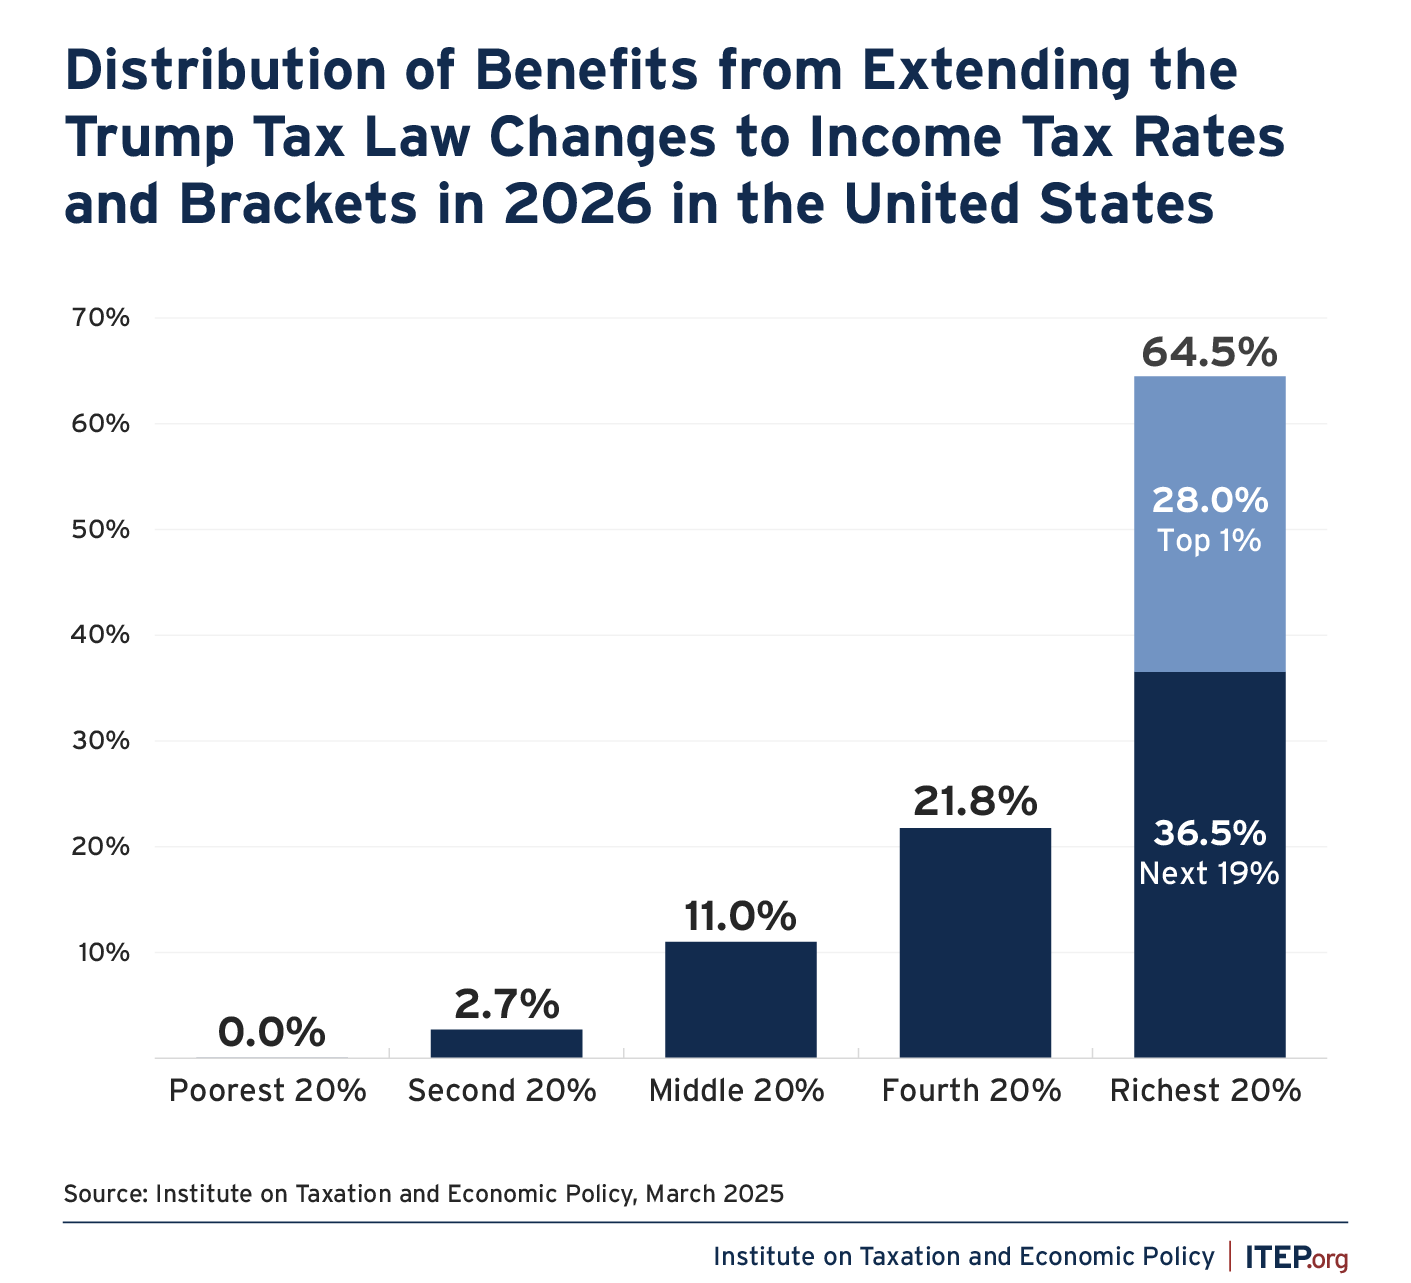
The figure below illustrates the effects of extending the rate and bracket changes in 2026, compared to current law (compared to what will happen if Congress does nothing and allows the provisions to expire as scheduled).
While these rate and bracket changes result in a tax cut for some people in all income groups, nearly two-thirds of the benefits will go to the richest fifth of taxpayers, and more than a quarter of the benefits will go to the richest 1 percent of taxpayers.
FIGURE 9
In other words, the rate and bracket changes that are part of the 2017 law clearly make our tax system less progressive because they disproportionately favor the rich in a dramatic way.
The greatest beneficiaries are very well-off households who pay the top personal income tax rate on most of their income. The 2017 law cut the top rate from 39.6 percent to 37 percent.
Meanwhile, many low- and middle-income people do not benefit at all. This includes working people who are subject to the Social Security and Medicare payroll taxes but do not earn enough to owe any personal income tax. It also includes many people who receive Social Security, which is largely exempt from the personal income tax for most recipients.
The rate and bracket changes also disproportionately favor white taxpayers at the expense of others, creating more racial inequity in our tax system.
FIGURE 10
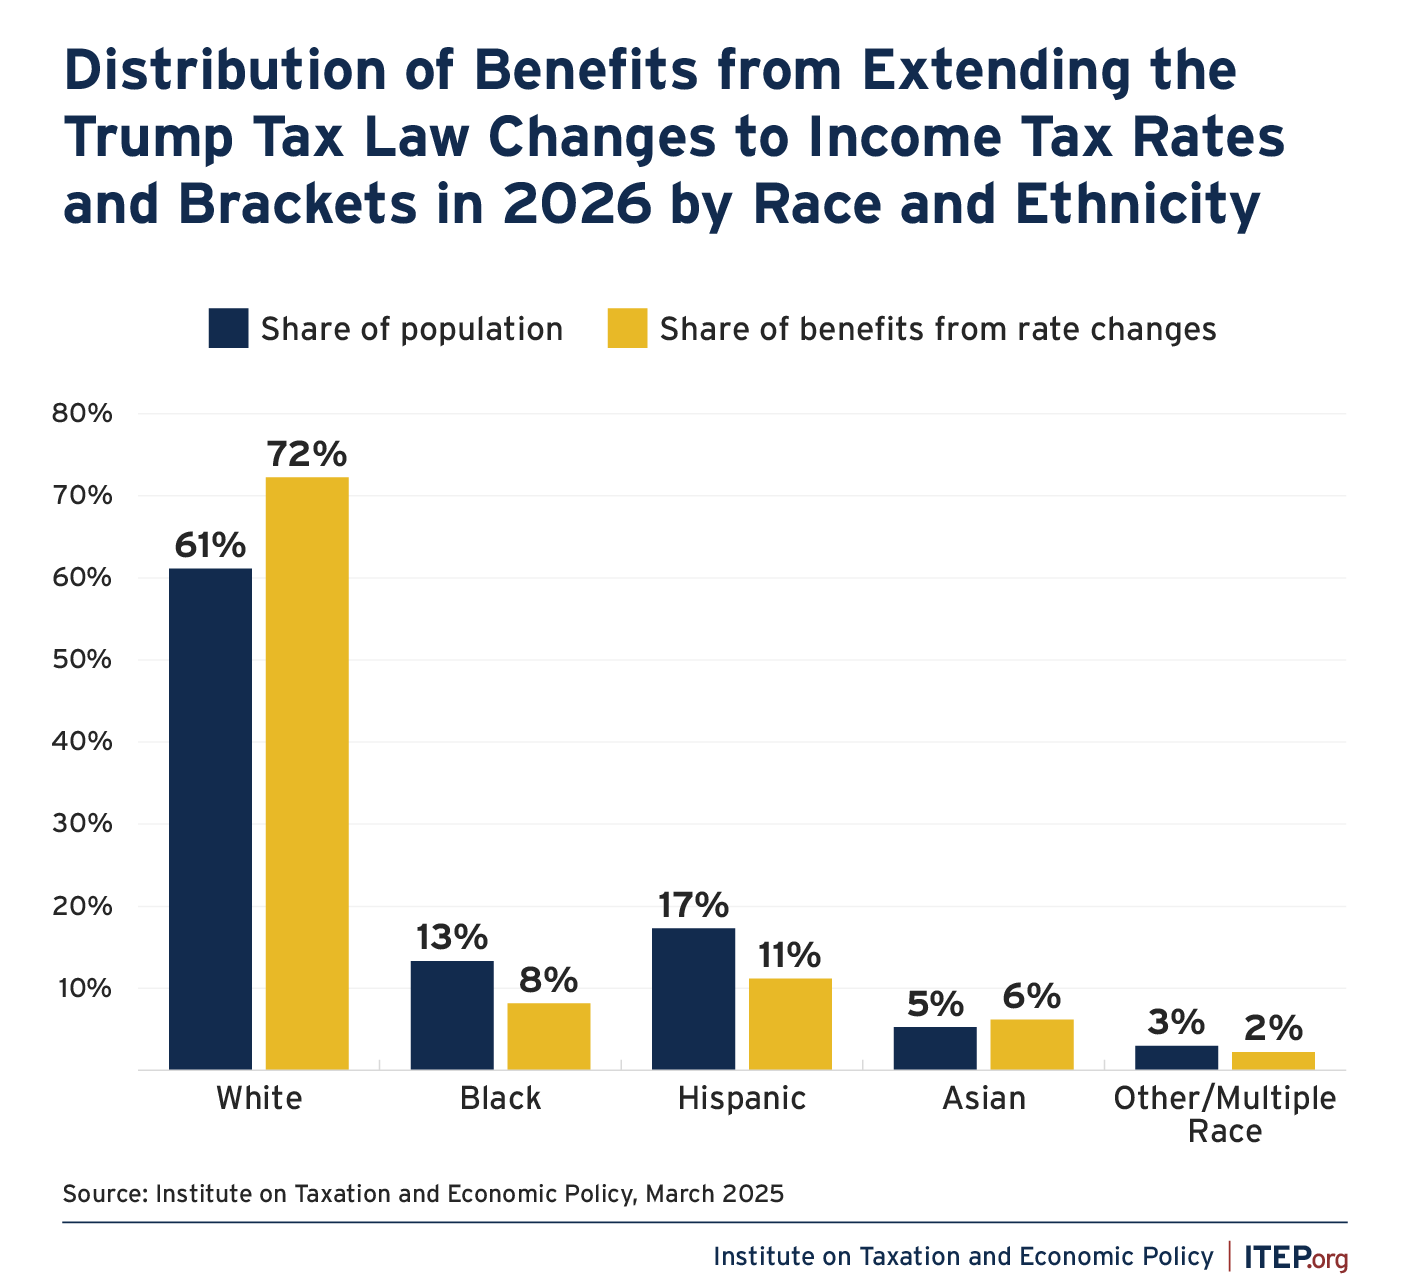
In 2026 Black taxpayers will make up 13 percent of the population but would receive only 8 percent of the benefits of the changed income tax rates and brackets if they are extended, according to our estimates. Hispanic taxpayers will make up 17 percent of the population but would receive only 11 percent of the benefits.
The next sections describe tax breaks that are even more harmful to racial equity because they provide tax breaks not just for income generally, but income from specific types of assets (business assets, corporate stocks and other investment assets) that are even more disproportionately concentrated in the hands of white Americans.
2. Trump’s Deduction for Pass-Through Business Owners
One of the most significant tax breaks for high-income people that was enacted as part of the Trump tax law is section 199A, the 20 percent deduction for income individuals receive from “pass-through” businesses. These are businesses that do not pay the corporate income tax because their profits are instead “passed through” to the individual owners and taxed as part of their personal income each year.
Proponents of this special deduction sometimes characterize it as a break for “small” businesses but the main beneficiaries are not what most Americans imagine when they think of small business owners.
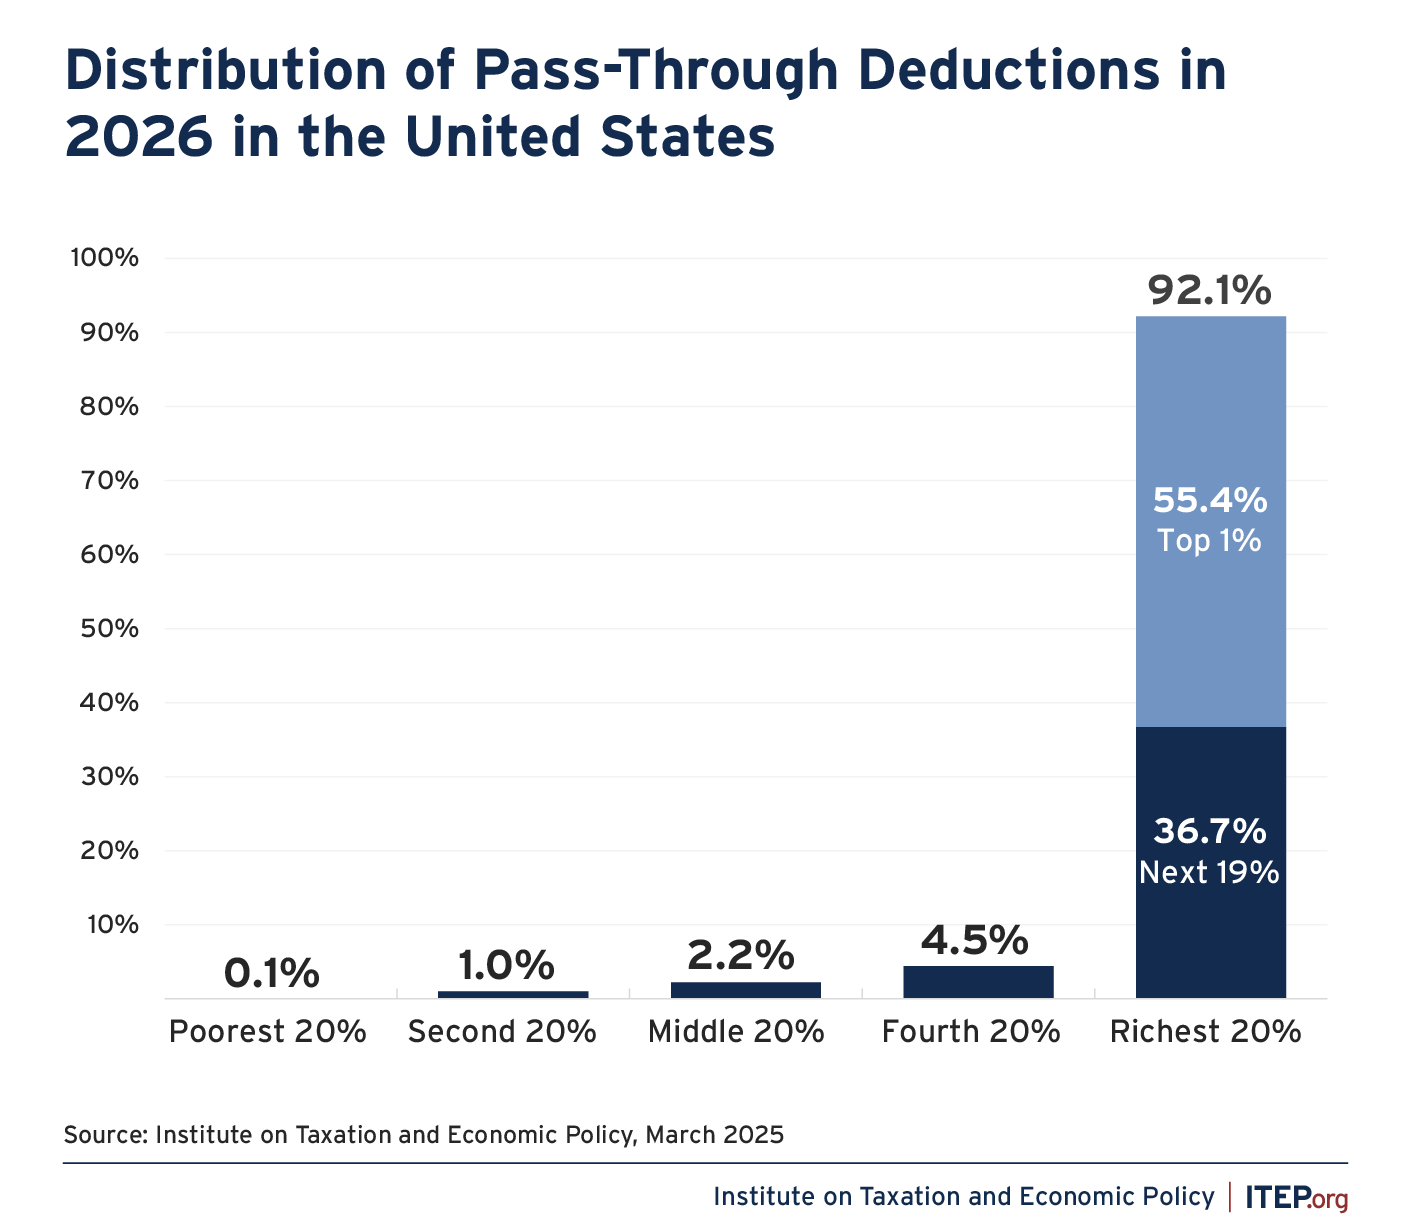
If the expiring Trump tax provisions are extended after 2025, the pass-through deduction will be one of most costly and regressive features of that extension. ITEP finds that in 2026, 92 percent of the benefits of the pass-through deduction would go to the richest 20 percent of Americans and 55 percent of the benefits would go to the richest 1 percent.
FIGURE 11
This is very similar to an analysis from the Joint Committee on Taxation finding that 55 percent of the benefits went to the richest 1 percent in 2019.[18]
The deduction has extremely complicated rules that are ostensibly supposed to limit the benefits for high-income people whose businesses are not creating jobs or improving the economy in some important way, but there is no evidence whatsoever that those rules are working.
This year, the limits on the deduction are phased in for married couples with income between $394,600 and $494,600 and single taxpayers with income between $197,300 and $247,300. But even for taxpayers with income well above those ranges, the limits apply only very loosely.
For those subject to them, the limits deny the deduction for income from certain types of businesses that are poorly defined, and the regulations issued during Trump’s first term weakened them further.[19] For those subject to them, the limits also restrict the benefit for businesses that do not hire employees or invest in capital assets. There is no evidence that these rules actually increase employment or investment and in fact the Joint Committee on Taxation recently found that 45 percent of the benefits go to owners of businesses that do not have even one employee.[20]
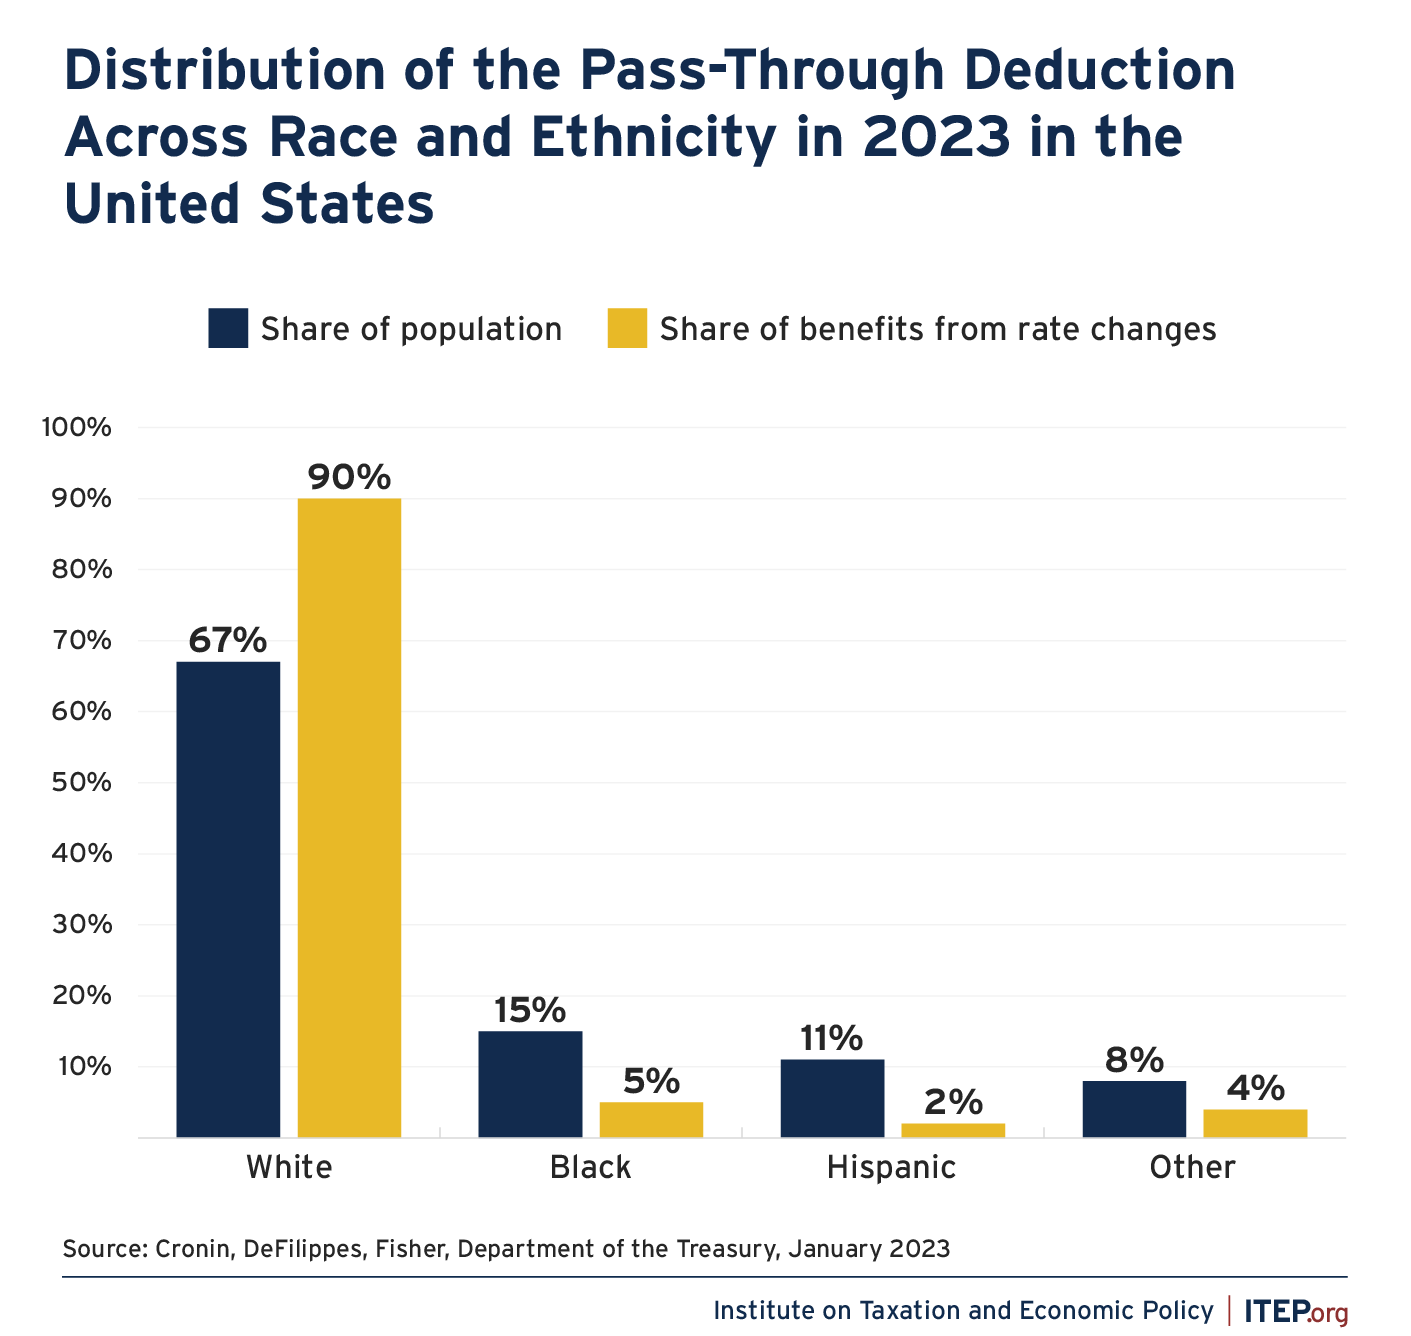
The distribution of business assets, like the distribution of most kinds of wealth in the U.S., is racially skewed, so it is unsurprising the benefits of a tax break for business profits would be as well. The Treasury Department found that Hispanic and Black taxpayers make up 15 percent and 11 percent of the U.S. population but receive only 5 percent and 2 percent of the benefits from section 199A, respectively. White taxpayers make up 67 percent of the population but receive a disproportionate 90 percent of the benefits. The special deduction for pass-through business income is therefore another tax break that creates racial inequity in our tax code.[21]
FIGURE 12
B. Examples of Costly and Regressive Permanent Tax Policies that Congress Should Limit or Repeal
1. Tax Breaks for Capital Gains
When an asset’s value increases over time, that increase is a capital gain. Capital gains are a type of income, but our system taxes them far less than other types of income. This is deeply unfair, in part because most capital gains go to very well-off people. There are three main ways that our tax code treats capital gains more generously than other types of income and each could be addressed by lawmakers who want to raise revenue in a progressive way.
- Capital gains are only included in income for tax purposes when an asset is sold and the gains are “realized,” which means the seller profits from an asset sale. Unrealized capital gains are not taxed, meaning a person who owns an asset that is worth more and more each year can defer paying income taxes on the appreciation until they sell the asset.
Unrealized capital gains are the main type of income for some very wealthy people, who can defer paying income taxes on it for years, allowing their wealth to grow much more rapidly than the wealth a middle-class person might put in a savings account where the income it generates (the interest paid on the account) is taxed each year.
- Even when capital gains are realized, they are usually taxed at lower rates than other types of income. Special low-income tax rates apply to “long-term” capital gains, which are profits from selling an asset that the taxpayer has owned for at least a year. The result is that even when wealthy investors are paying taxes on their income, they pay at lower rates than people who earn their income from work.
The personal income tax applies at a top rate of just 20 percent for long-term capital gains, whereas the top rate for other types of income will be 39.6 percent in 2026 (or 37 percent if Congress extends the 2017 provision to reduce tax rates).[22]
- There is an exemption for unrealized gains on assets that taxpayers leave to their heirs when they die. When the owner of an appreciated asset dies, under the current rules the tax code simply forgets about the unrealized capital gains forever. This means that the effective income tax rate on a great deal of unrealized capital gains is 0 percent. This exemption for unrealized gains on assets passed to heirs is often called the “stepped-up basis rule.”
If you buy an asset for $5 million, your “basis” in the asset is $5 million. If one year later you sell it for $8 million, you realize a gain equal to the $8 million you receive minus your basis of $5 million, which comes to $3 million. (People who are not tax experts would simply say you made a $3 million profit from selling the asset.) But if you die and leave the asset to your heirs, the current rules “step up” their basis to the $8 million that the asset is worth when they inherit it. That means they could sell it right away for $8 million and, under the current rules, they would realize no gains and therefore have no income from the sale of the asset to report on their tax return.
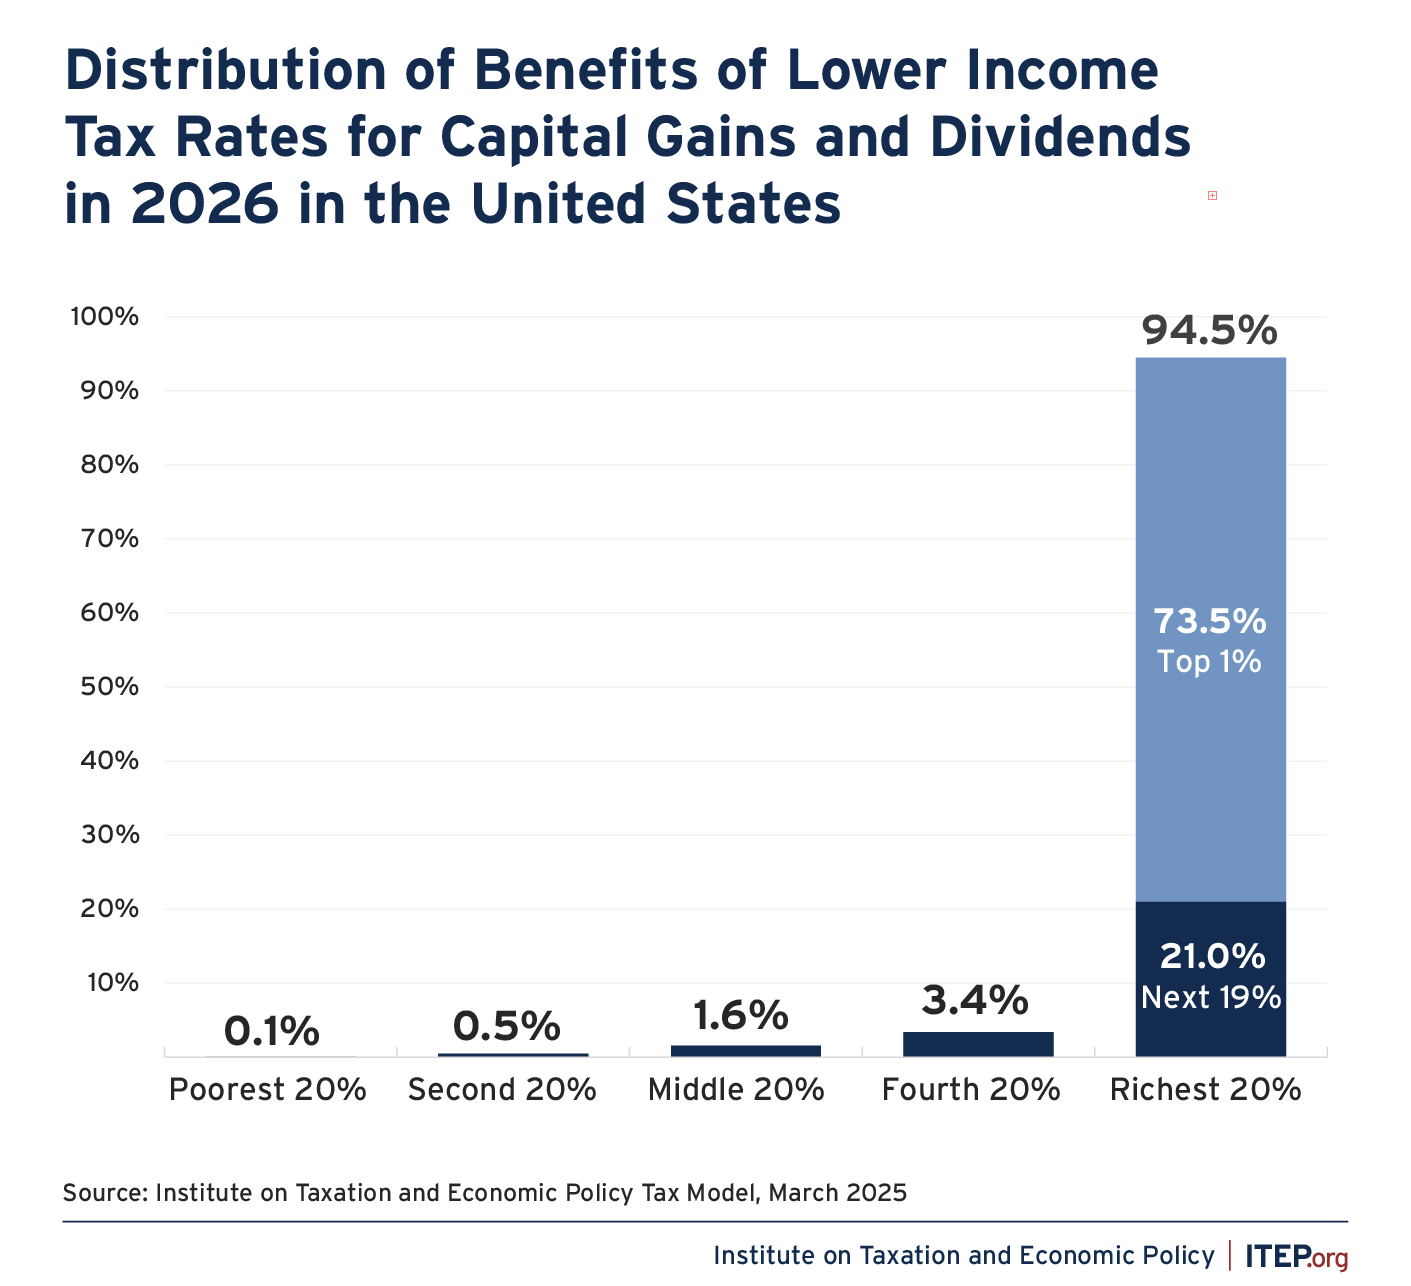
Of these three types of tax breaks for capital gains, the special, lower income tax rates for long-term capital gains are the most well-known. These rates, which apply to corporate dividends as well as long-term gains that are “realized,” mainly benefit the richest 1 percent of taxpayers.
FIGURE 13
This tax break is also a problem for progressivity related to race. As explained earlier, the Treasury Department recently found that while Hispanic and Black taxpayers make up 15 and 11 percent of total U.S. taxpayers, they only receive 3 percent and 2 percent, respectively, of the benefits from these lower tax rates.[23] White taxpayers make up 67 percent of the total taxpayer population but receive 92 percent of the benefits.
FIGURE 14
2. Corporate Tax Breaks
When corporations are allowed to pay less in taxes, the ultimate beneficiaries are mainly the owners of corporate stocks and bonds, who are overwhelmingly well-off Americans and foreign investors. For this reason, corporate tax breaks make our overall tax system less progressive. Eliminating special breaks in the corporate income tax or reversing the reduction in the corporate income tax rate enacted as part of the 2017 Trump tax law would achieve the goals of raising revenue and making our tax code more progressive.
The Trump tax law slashed the statutory corporate income tax rate from 35 percent to 21 percent (among many other changes to the corporate tax). Former President Joe Biden and Vice President Kamala Harris both proposed to partly reverse that change, bringing the rate from 21 percent to 28 percent. Estimates vary on how much revenue this would raise. The Treasury Department estimated that it would raise about $125 billion in 2026 alone. Congress’s Joint Committee on Taxation (JCT) estimated that it would raise $82 billion in 2026 alone. The mid-point between these two estimates would be roughly $100 billion in revenue in 2026.
The figure below illustrates the distribution of benefits from cutting the corporate tax by $100 billion (roughly the same amount of corporate tax cuts that the Biden-Harris proposal mentioned above would reverse) in 2026. During the first year in effect, half the benefits flow to the richest fifth of Americans while 40 percent of the benefits flow to foreign investors. The remaining 10 percent of the benefits from a corporate tax cut is split up among the bottom 80 percent of Americans.
FIGURE 15
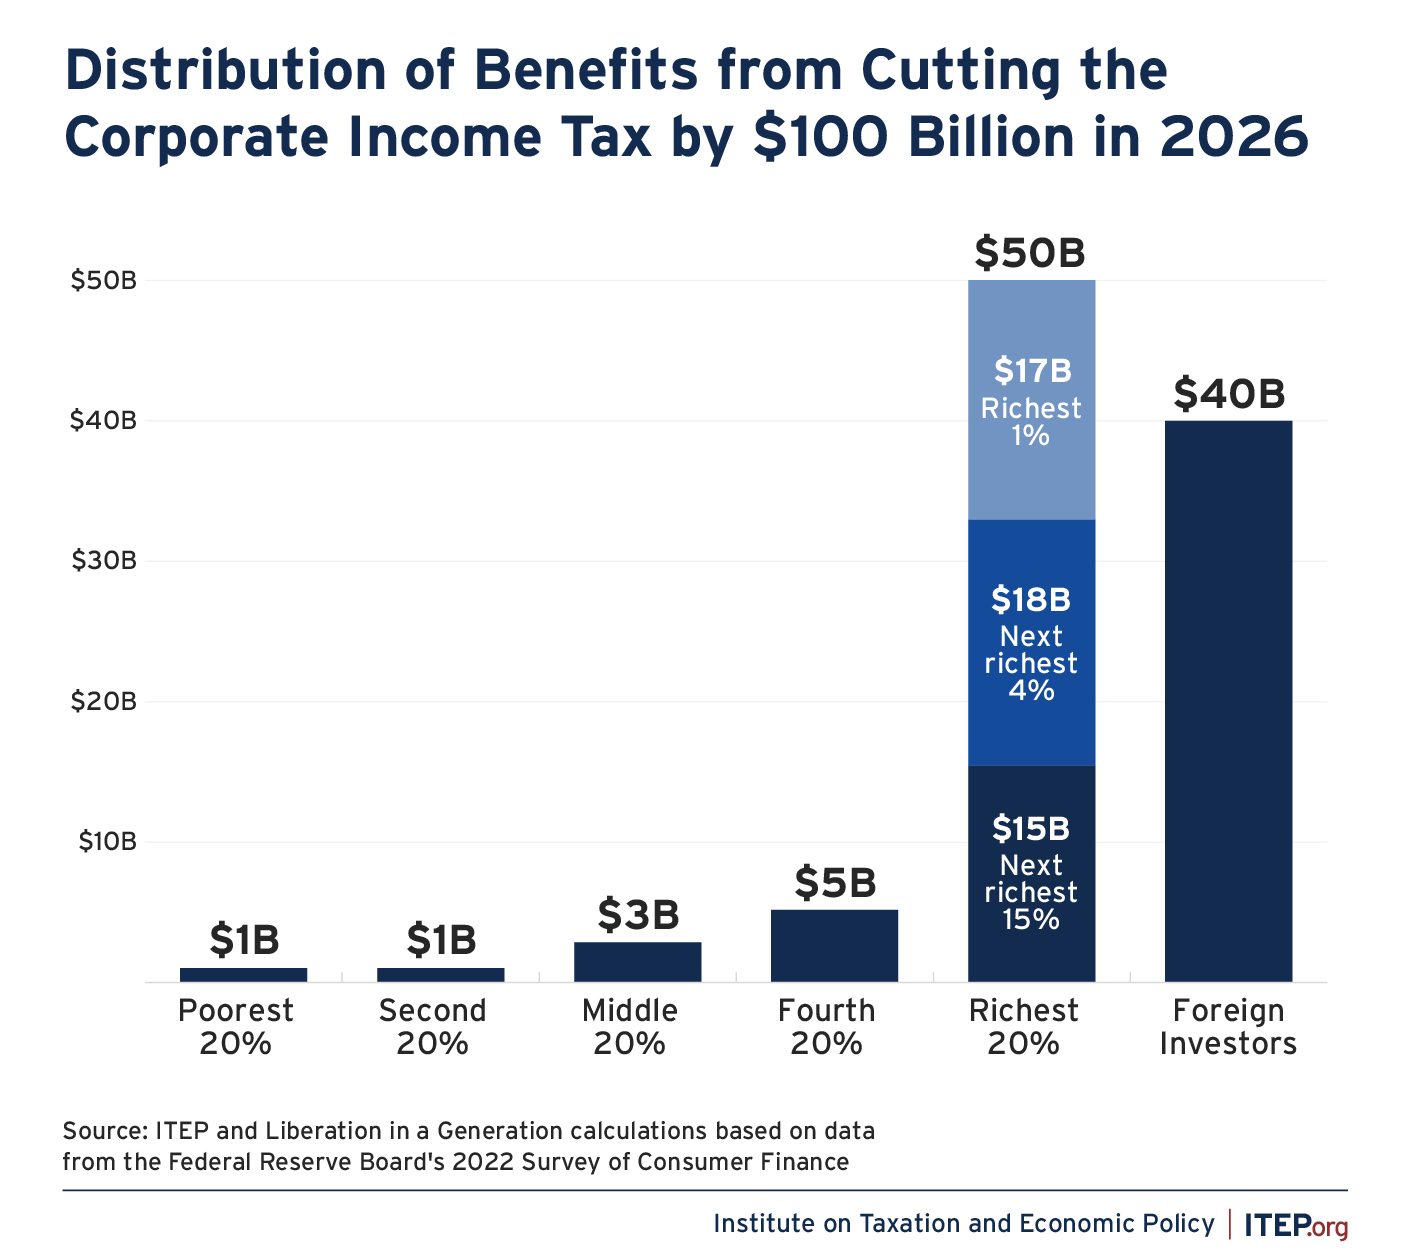
The benefits of a corporate tax cut (particularly in the first year it goes into effect) flow to the owners of stocks in American corporations. Recent research found that about 40 percent of those stocks are owned by foreign investors. Half of these stocks are owned by the richest fifth of Americans, including 35 percent owned by the richest 5 percent of Americans and 17 percent owned by the richest 1 percent alone.
When Congress cuts taxes, the result is higher income for these shareholders – in the form of increased dividends paid, more frequent stock buybacks or greater appreciation of the shares which yield larger capital gains when sold. For this reason, the figure above could be seen as the distribution of the increased income shareholders receive when Congress cuts corporate taxes.
Corporate tax cuts are therefore regressive and much of the revenue lost goes out of the U.S. altogether to foreign investors. Corporate tax cuts increase income inequality when Congress could instead use tax policy to reduce it.
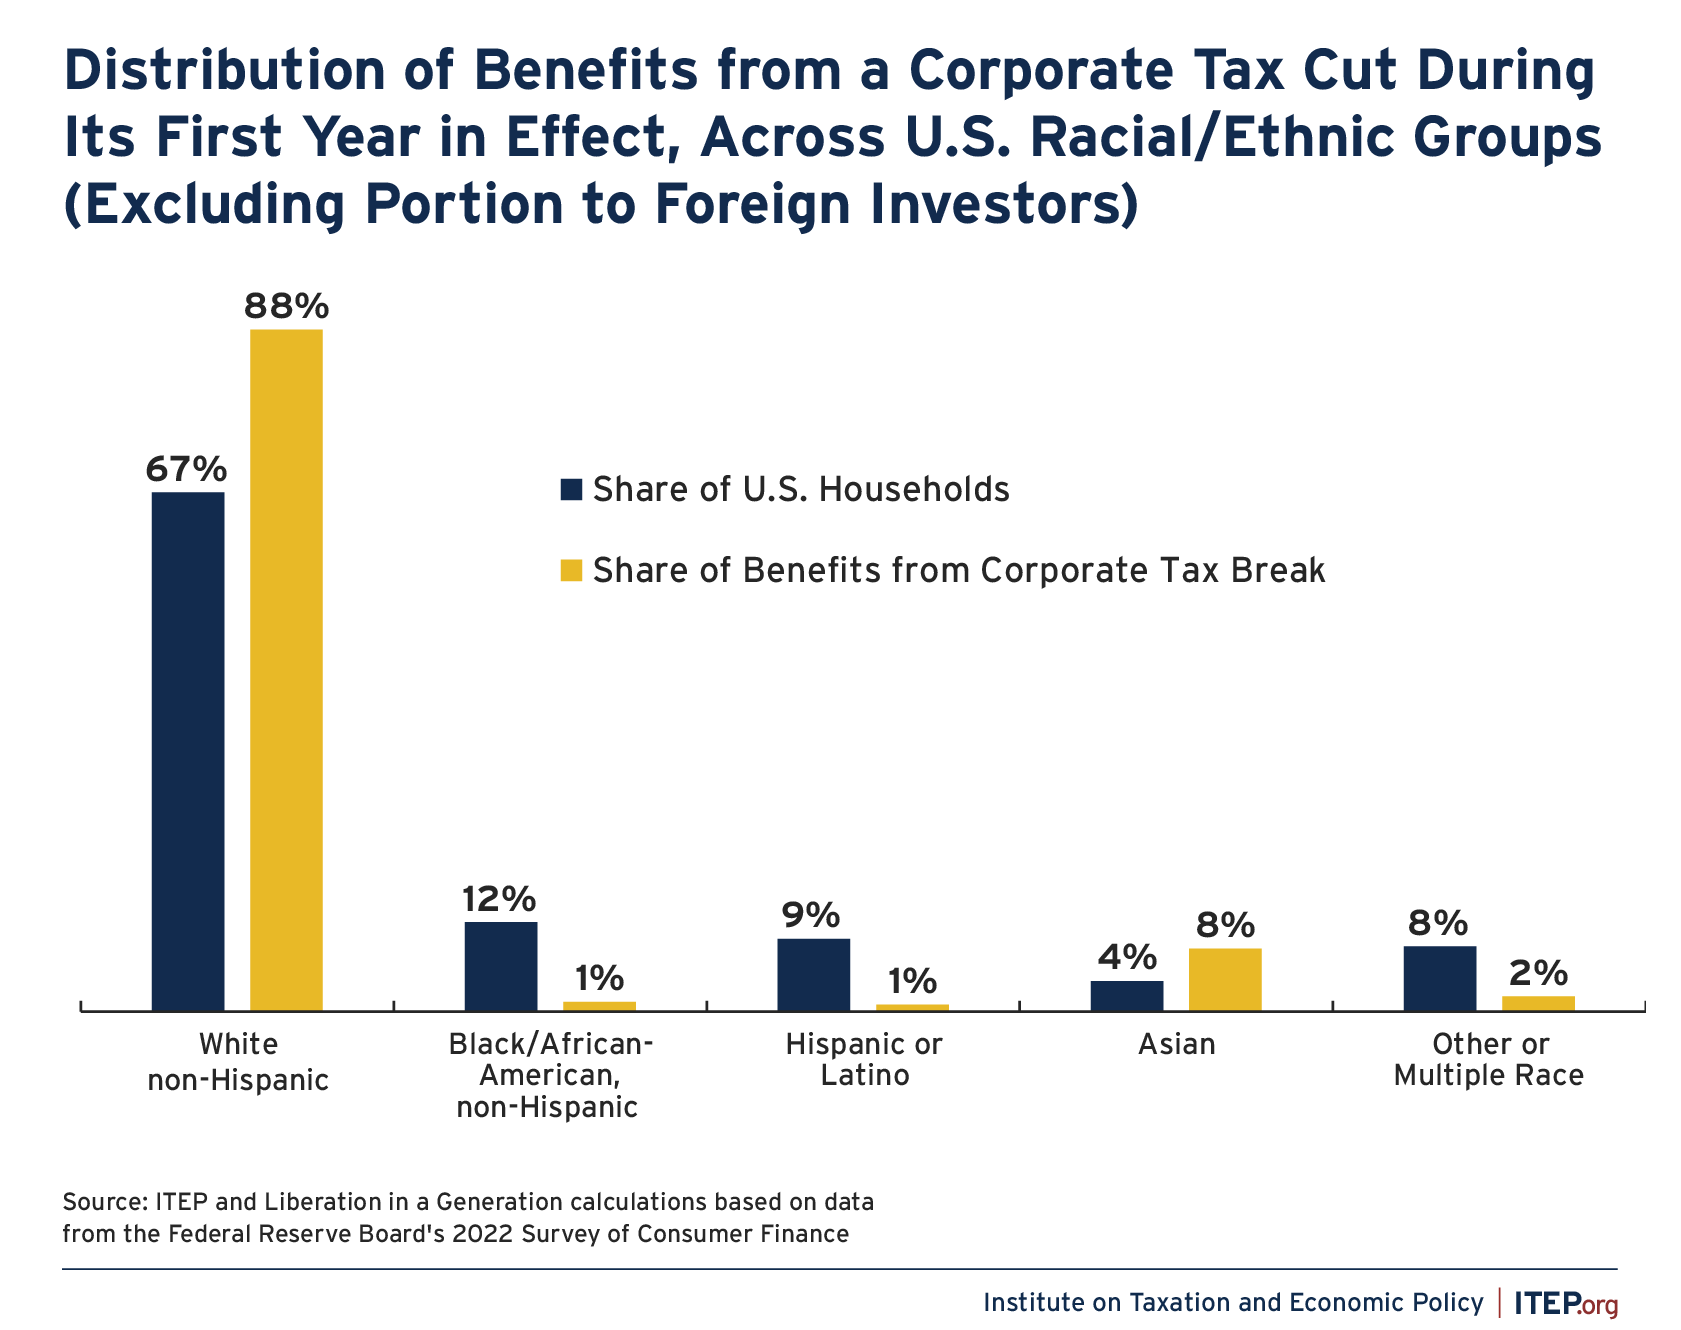
Corporate tax cuts also increase racial inequality. Because white households own a disproportionate share of corporate stocks, they disproportionately benefit. White Americans receive 88 percent of the benefits that remain in the U.S. even though they make up only 67 percent of U.S. households. In contrast, Black and Hispanic households each receive just 1 percent of the benefits despite making up 12 percent and 9 percent of households respectively.
FIGURE 16
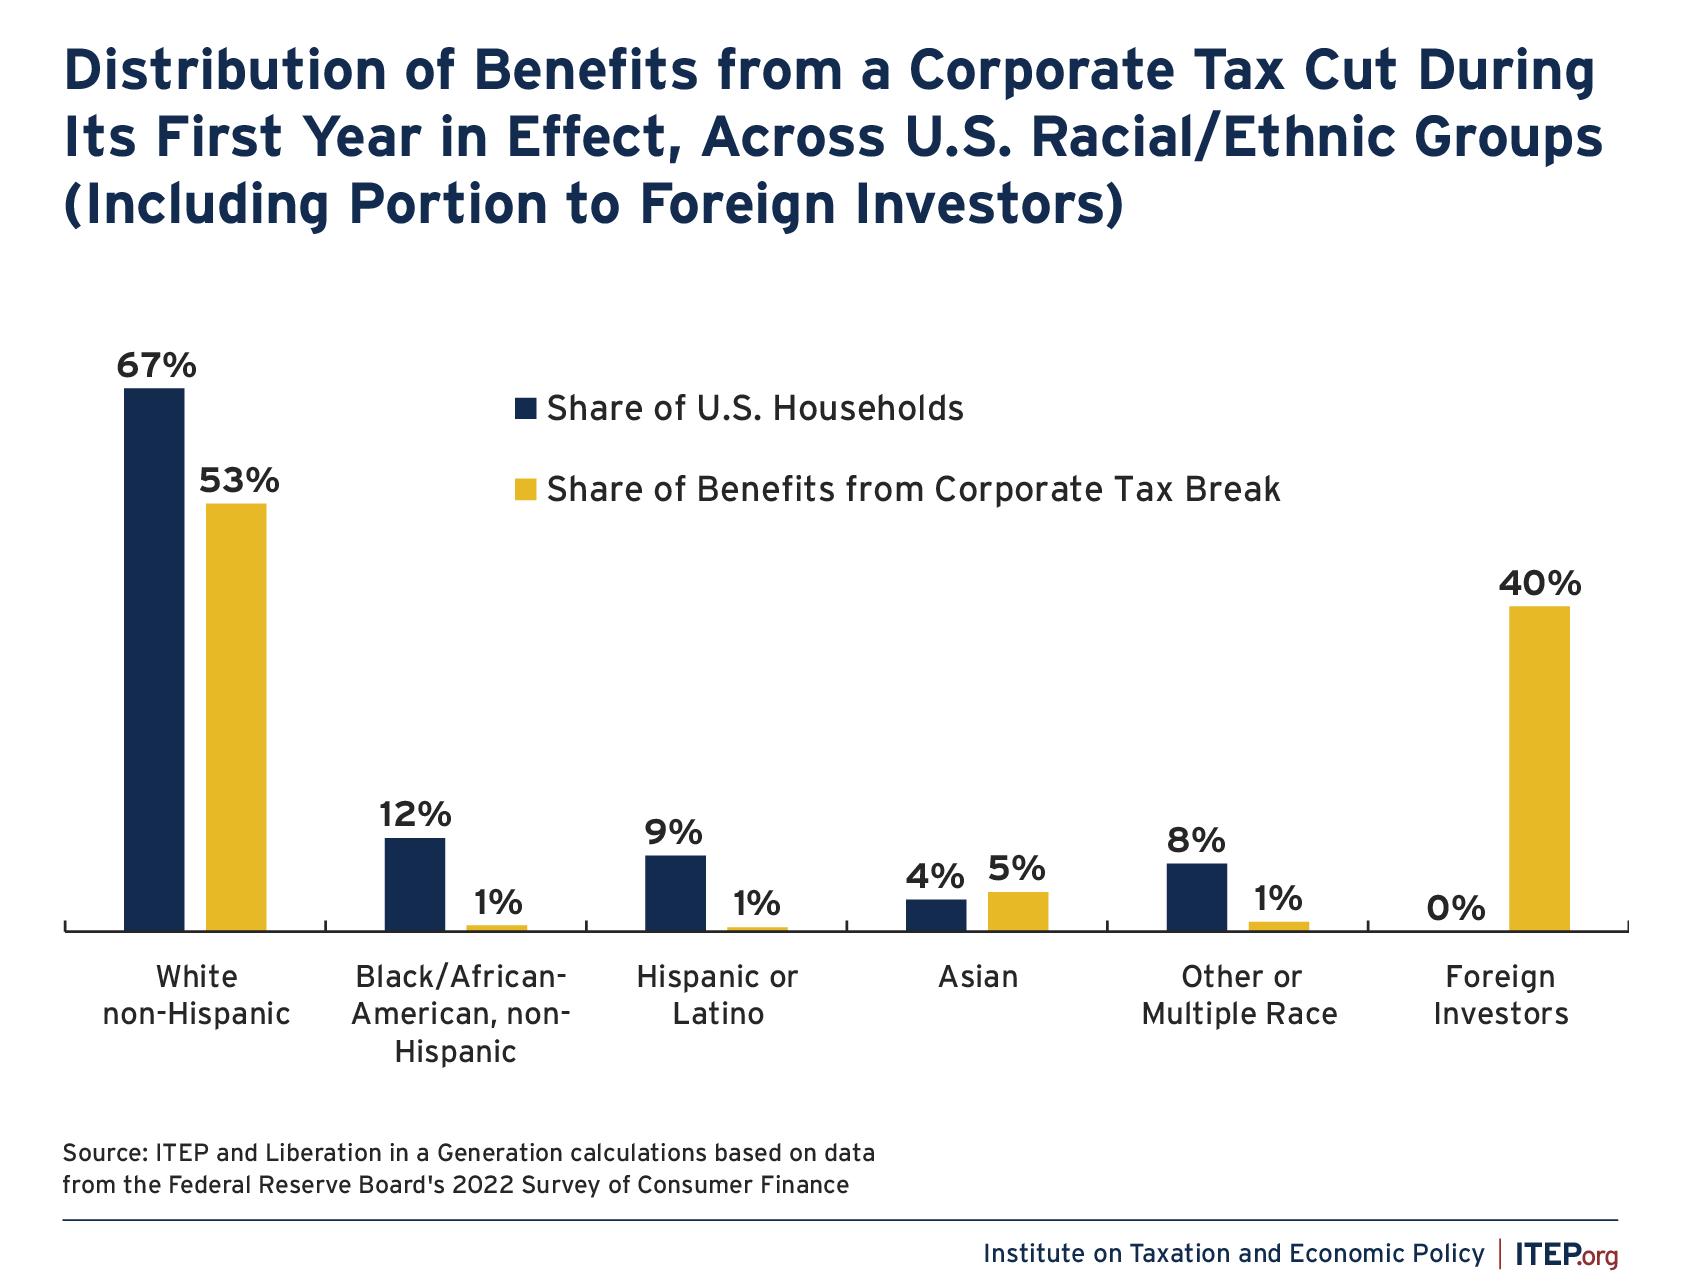
When we include the benefits that flow out of the country to foreign investors, we find that even white Americans receive a disproportionately small share of a corporate tax cut. White Americans make up 67 percent of the population but receive just 53 percent of the total benefits from a corporate tax cut. The share of benefits flowing to nearly all the major racial/ethnic groups is noticeably below their share of U.S. households, as illustrated in the figure below. Two recent reports from ITEP and Liberation in a Generation explain in greater detail how these estimates are produced.[24]
FIGURE 17
Any corporate tax break can have these effects and thus intensify income inequality and racial inequality and send resources out of the U.S. This is true for legislation that reduces the statutory corporate tax rate, and it is also true for provisions that allow corporations to pay an effective tax rate that is even lower than the statutory rate. There are so many of these provisions that few companies pay an effective tax rate that is even close to the statutory rate.
A recent ITEP report confirmed that this type of corporate tax avoidance occurred when the statutory corporate tax rate was 35 percent and still occurs now when the statutory rate is 21 percent.[25] The report examined the companies in the Fortune 500 and S&P 500 that were consistently profitable for 9 years, 2013 through 2021. During the four years before the Trump law was enacted, while the statutory tax rate was 35 percent, these 296 companies collectively paid an effective tax rate of just 22 percent. During the four years after the Trump law was enacted, when the statutory tax rate was 21 percent, these companies paid an effective tax rate of just 12.8 percent.
The total amount of taxes these 296 corporations collectively saved in the first period by paying less than 35 percent of their profits in federal income taxes totaled $248 billion. That is another way of saying these corporations received $248 billion in tax subsidies from 2013 through 2016.
In the second period, the total amount of taxes these corporations saved by paying less than 21 percent of their profits in federal income taxes was $225.6 billion. In other words, these 296 companies received $225.6 billion in tax subsidies from 2018 through 2021.
FIGURE 18
The Cost of Tax Avoidance: Tax Subsidies to 296 Companies
| Years | U.S. income | Tax at statutory rate |
Actual tax | Tax subsidies |
% of profits sheltered from tax |
| 2013 to 2016 | $1.90 trillion | $666.4 billion | $418.4 billion | $248.0 billion | 37% |
| 2018 to 2021 | $2.75 trillion | $577.0 billion | $351.5 billion | $225.6 billion | 39% |
Source: ITEP analysis of Securities and Exchange Commission filings of publicly traded corporations
Many huge corporations that are household names paid effective tax rates that were far less than the statutory rate before the Trump law and then paid even lower effective rates after it was enacted.
FIGURE 19
Before and After the Trump Tax Law for 16 Prominent Corporations
| Company | Effective tax rates from 2013-2016 |
Effective tax rates from 2018-2021 |
| Verizon Communications | 21% | 8% |
| Walmart | 31% | 17% |
| AT&T | 13% | 3% |
| Meta | 28% | 18% |
| Intel | 27% | 13% |
| Comcast | 24% | 14% |
| Walt Disney | 26% | 8% |
| Visa | 32% | 18% |
| Lockheed Martin | 33% | 15% |
| Capital One Financial | 31% | 16% |
| Target | 34% | 16% |
| Honeywell International | 23% | 6% |
| FedEx | 18% | 1% |
| Deere | 30% | 13% |
| Archer Daniels Midland | 26% | 6% |
| Domino’s Pizza | 29% | 9% |
*2017 was a transition year between the prior and post-Trump tax regimes and was thus excluded.
Source: ITEP analysis of Securities and Exchange Commission filings of publicly traded corporations
Congress could enhance the adequacy and progressivity of our tax code by shutting down the provisions that allow corporations to pay less than the statutory corporate tax rate and by reversing (at least partly) Trump’s dramatic reduction in the statutory corporate tax rate. Lawmakers should reject any proposals that move in the opposite direction by allowing profitable corporations to pay even less than they do now.
Conclusion: The Choice Before Congress
If lawmakers pass the kind of tax legislation that President Trump proposes, they will be making a choice to make our tax system less adequate and less fair. They will be making a choice to further underfund public investments and make the tax code more generous to the rich.
Congress should make other choices. The U.S. needs to raise more revenue to have public investments that are more on par with those of other similarly wealthy countries and even to fully pay for the meager public spending we do currently. The U.S. needs to make its tax system more progressive because the rules in place now have created an economy that is very out of balance, with a few extremely wealthy individuals holding enormous wealth, and the power that comes with it, and not paying their share to finance the investments that made their fortunes possible.
The policy examples presented here illustrate how lawmakers could make choices to achieve these goals. Specifically, they can choose not to fully extend expiring tax cuts and also limit or repeal special tax breaks that are permanent provisions of our tax code.
Based on his proposals, President Trump and his supporters in Congress are not likely to make these choices. Whatever the tax code looks like after this year, it is important to remember that it was not inevitable, but the result of choices made by policymakers to prioritize some goals over others.
Endnotes
[1] Center on Budget and Policy Priorities, “Policy Basics: Where Do Our Federal Tax Dollars Go?,“ Updated January 28, 2025. https://www.cbpp.org/research/federal-budget/where-do-our-federal-tax-dollars-go
[2] Bobby Kogan, “Tax Cuts Are Primarily Responsible for the Increasing Debt Ratio,” Center for American Progress, March 27, 2023. https://www.americanprogress.org/article/tax-cuts-are-primarily-responsible-for-the-increasing-debt-ratio/
[3] Steve Wamhoff and Joe Hughes, “Impacts of the Tax Relief for American Families and Workers Act,” Institute on Taxation and Economic Policy, February 2, 2024. https://itep.org/impacts-of-tax-relief-for-american-families-and-workers-act/
[4] Congressional Budget Office, “Budgetary Outcomes Under Alternative Assumptions About Spending and Revenues,” May 8, 2024. https://www.cbo.gov/publication/60114. This does not include the cost of extending tax breaks for Opportunity Zones, which were not included in the TCJA Permanency Act, the legislation that extends the tax provisions that will otherwise expire at the end of 2025.
[5] Gallup public opinion polling on taxes. https://news.gallup.com/poll/1714/taxes.aspx
[6] Steve Wamhoff and Matthew Gardner, “Federal Tax Cuts in the Bush, Obama, and Trump Years,” Institute on Taxation and Economic Policy, July 11, 2018. https://itep.org/federal-tax-cuts-in-the-bush-obama-and-trump-years/
[7] Adam Smith, The Wealth of Nations, 1776.
[8] Congressional Budget Office, “Trends in the Distribution of Family Wealth,“ 1989 to 2022, October 2, 2024. https://www.cbo.gov/publication/60807
[9] Steve Wamhoff, “State-by-State Estimates of Sen. Rick Scott’s ‘Skin in the Game’ Proposal,” Institute on Taxation and Economic Policy, March 7, 2022. https://itep.org/state-by-state-estimates-of-sen-rick-scotts-skin-in-the-game-proposal/
[10] Steve Wamhoff and Emma Sifre, “Corporate Tax Breaks Contribute to Income and Racial Inequality and Shift Resources to Foreign Investors,” Institute on Taxation and Economic Policy, July 16, 2024. https://itep.org/corporate-tax-breaks-income-and-racial-inequality/
[11] Steve Wamhoff, “The Estate Tax is Irrelevant to More Than 99 Percent of Americans,“ Institute on Taxation and Economic Policy, December 7, 2023. https://itep.org/federal-estate-tax-historic-lows-2023/
[12] Institute on Taxation and Economic Policy, “Who Pays? A Distributional Analysis of the Tax Systems in All 50 States: Seventh Edition,” January 2024. https://itep.org/whopays-7th-edition/
[13] Steve Wamhoff, “Biden’s Plan Will Stop Jeff Bezos and Elon Musk from Avoiding Billions in Taxes,” Fortune, June 9, 2021. https://fortune.com/2021/06/09/propublica-taxes-bezos-buffett-musk-bloomberg/
[14] Greg Leiserson, Council of Economic Advisers, and Danny Yagan, Office of Management and Budget, September 23, 2021, https://www.whitehouse.gov/cea/written-materials/2021/09/23/what-is-the-average-federal-individual-income-tax-rate-on-the-wealthiest-americans/. This study has been removed from the White House website but is described here: Seth Hanlon and Nick Buffie, “The Forbes 400 Pay Lower Tax Rates Than Many Ordinary Americans,” Center for American Progress, October 7, 2021. https://www.americanprogress.org/article/forbes-400-pay-lower-tax-rates-many-ordinary-americans/
[15] Dorothy Brown, The Whiteness of Wealth, 2021.
[16] Julie-Anne Cronin, Portia DeFilippes, Robin Fisher, “Tax Expenditures by Race and Hispanic Ethnicity: An Application of the U.S. Treasury Department’s Race and Hispanic Ethnicity Imputation,” Department of the Treasury, Office of Tax Analysis, Working Paper 122, January 20223, page 29, Table 5. https://home.treasury.gov/system/files/131/WP-122.pdf
[17] Steve Wamhoff et al., “A Distributional Analysis of Donald Trump’s Tax Plan,” Institute on Taxation and Economic Policy, October 7, 2024. https://itep.org/a-distributional-analysis-of-donald-trumps-tax-plan-2024/
[18] Joint Committee on Taxation, “Present Law and Background on the Income Taxation of High Income and High Wealth Taxpayers,“ JCX-51-23, November 7, 2023, page 10. https://www.jct.gov/publications/2023/jcx-51-23/
[19] For example, the legislation states that income from “financial services” is ineligible but somehow Trump’s Treasury Department determined that businesses that take deposits and make loans are not technically “financial services” and therefore their owners are eligible. The statute also states that the deduction is not available for profits from a business whose chief asset is the “skill or reputation” of the owners or employees but regulations made it clear that the restaurant of a celebrity chef somehow would be eligible for the deduction. See Steve Wamhoff, “Hearing Witness: Trump Administration Giving Tax Breaks Not Allowed by Law,” Institute on Taxation and Economic Policy, February 12, 2020. https://itep.org/hearing-witness-trump-administration-giving-tax-breaks-not-allowed-by-law/
[20] A recent report compiles several bits of data like this that point to the conclusion that section 199A has had no effect on our economy other than to provide a windfall to the richest taxpayers. See David S. Mitchell, “2017 Tax Cut for Pass-Through Business Owners Exacerbated Inequality and Failed to Deliver Economic Benefits,” Washington Center for Equitable Growth, May 1, 2024. https://equitablegrowth.org/2017-tax-cut-for-pass-through-business-owners-exacerbated-inequality-and-failed-to-deliver-economic-benefits/
[21] Julie-Anne Cronin, Portia DeFilippes, Robin Fisher, “Tax Expenditures by Race and Hispanic Ethnicity: An Application of the U.S. Treasury Department’s Race and Hispanic Ethnicity Imputation,” Department of the Treasury, Office of Tax Analysis, Working Paper 122, January 20223, page 29, Table 5. https://home.treasury.gov/system/files/131/WP-122.pdf
[22] High-income people also pay an additional 3.8 percent tax to fund health care on both earned income and investment income like capital gains, so, including that, the top rates are 23.8 percent for long-term capital gains and 43.4 percent for earned income.
[23] Julie-Anne Cronin, Portia DeFilippes, Robin Fisher, “Tax Expenditures by Race and Hispanic Ethnicity: An Application of the U.S. Treasury Department’s Race and Hispanic Ethnicity Imputation,” Department of the Treasury, Office of Tax Analysis, Working Paper 122, January 20223, page 29, Table 5. https://home.treasury.gov/system/files/131/WP-122.pdf
[24] Steve Wamhoff and Emma Sifre, “Corporate Tax Breaks Contribute to Income and Racial Inequality and Shift Resources to Foreign Investors,” Institute on Taxation and Economic Policy, July 16, 2024, https://itep.org/corporate-tax-breaks-income-and-racial-inequality/; Jeremie Greer, Emanuel Nieves, Solana Rice, Emma Sifre, and Steve Wamhoff, “Who Benefits and Who Pays: How Corporate Tax Breaks Drive Inequality,” Liberation in a Generation and Institute on Taxation and Economic Policy, June 27, 2024. https://itep.org/who-benefits-and-who-pays-how-corporate-tax-breaks-drive-inequality/
[25] Matthew Gardner, Michael Ettlinger, Steve Wamhoff, Spandan Marasini, “Corporate Taxes Before and After the Trump Tax Law,” Institute on Taxation and Economic Policy, May 2, 2024. https://itep.org/corporate-taxes-before-and-after-the-trump-tax-law/