Who Pays?
Connecticut: Who Pays? 6th Edition
October 17, 2018 • By ITEP Staff
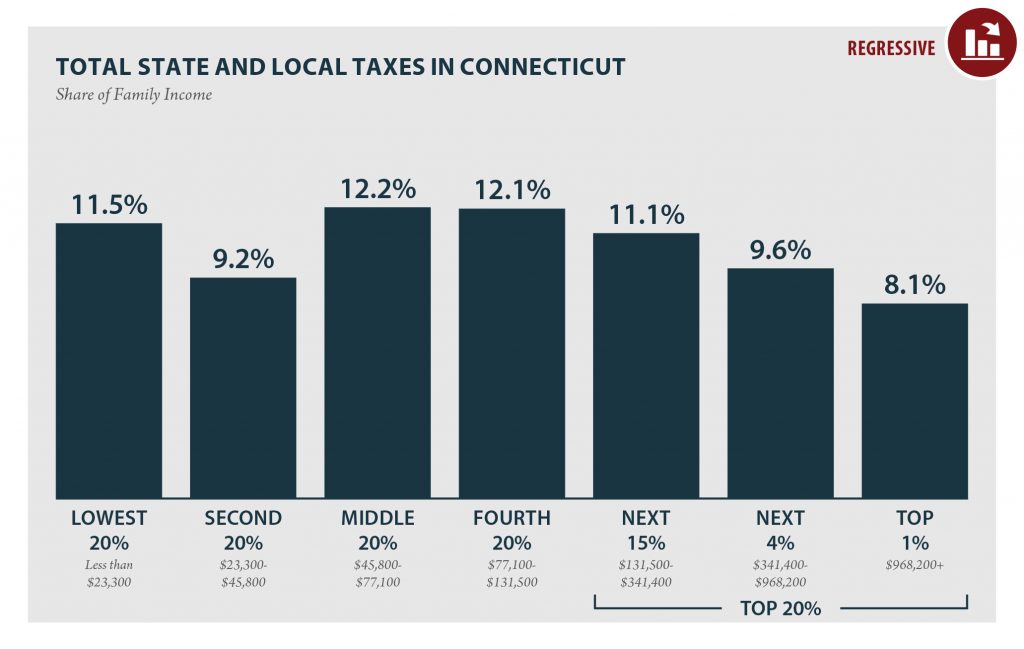
CONNECTICUT Read as PDF CONNECTICUT STATE AND LOCAL TAXES Taxes as Share of Family Income Top 20% Income Group Lowest 20% Second 20% Middle 20% Fourth 20% Next 15% Next 4% Top 1% Income Range Less than $23,300 $23,300 to $45,800 $45,800 to $77,100 $77,100 to $131,500 $131,500 to $341,400 $341,400 to $968,200 over $968,200 […]
Indiana: Who Pays? 6th Edition
October 17, 2018 • By ITEP Staff
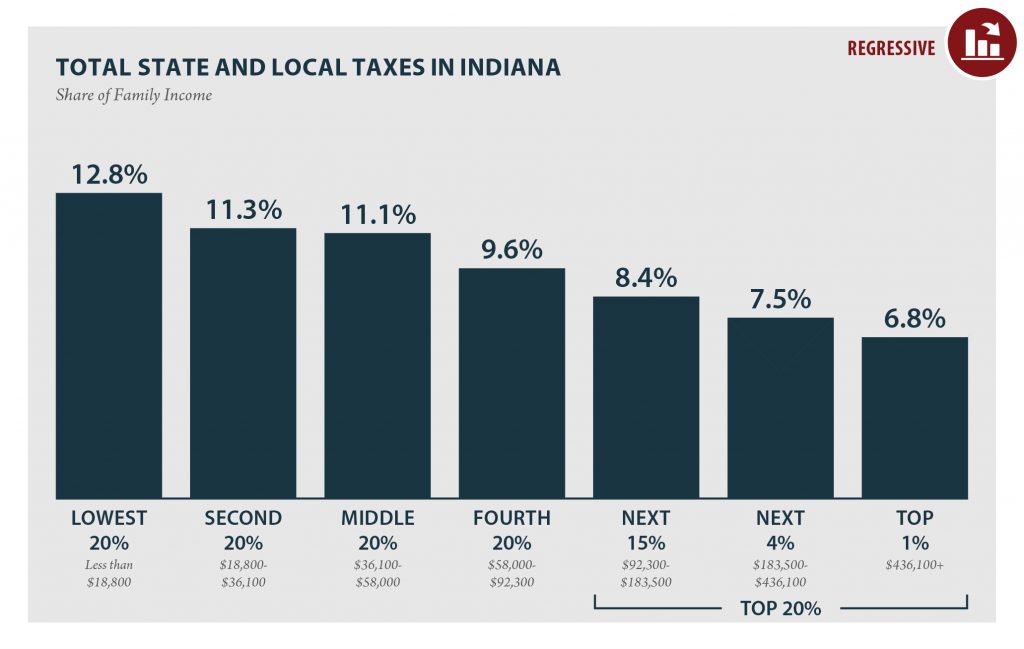
INDIANA Read as PDF INDIANA STATE AND LOCAL TAXES Taxes as Share of Family Income Top 20% Income Group Lowest 20% Second 20% Middle 20% Fourth 20% Next 15% Next 4% Top 1% Income Range Less than $18,800 $18,800 to $36,100 $36,100 to $58,000 $58,000 to $92,300 $92,300 to $183,500 $183,500 to $436,100 over $436,100 […]
Washington: Who Pays? 6th Edition
October 17, 2018 • By ITEP Staff
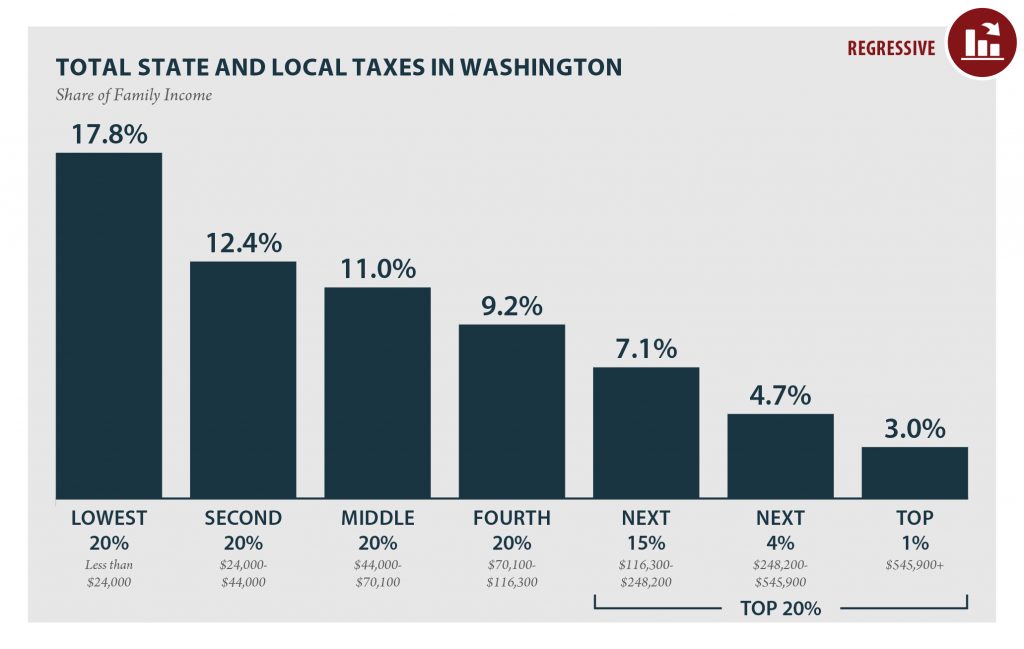
WASHINGTON Read as PDF WASHINGTON STATE AND LOCAL TAXES Taxes as Share of Family Income Top 20% Income Group Lowest 20% Second 20% Middle 20% Fourth 20% Next 15% Next 4% Top 1% Income Range Less than $24,000 $24,000 to $44,000 $44,000 to $70,100 $70,100 to $116,300 $116,300 to $248,200 $248,200 to $545,900 over $545,900 […]
Idaho: Who Pays? 6th Edition
October 17, 2018 • By ITEP Staff
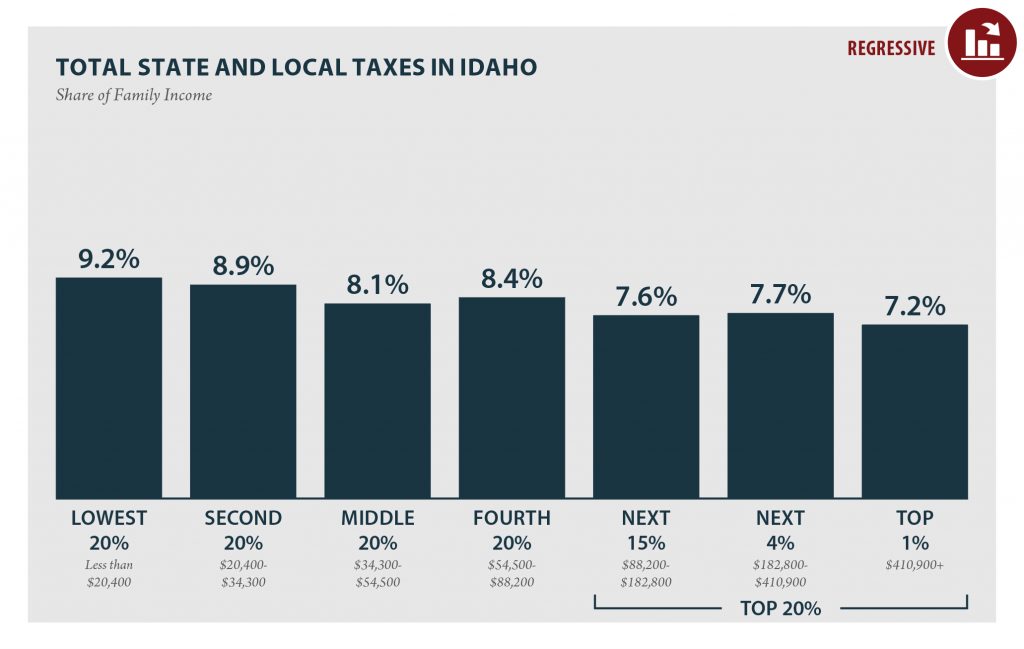
According to ITEP’s Tax Inequality Index, which measures the impact of each state’s tax system on income inequality, Idaho has the 38th most unfair state and local tax system in the country. Incomes are more unequal in Idaho after state and local taxes are collected than before.
Kansas: Who Pays? 6th Edition
October 17, 2018 • By ITEP Staff
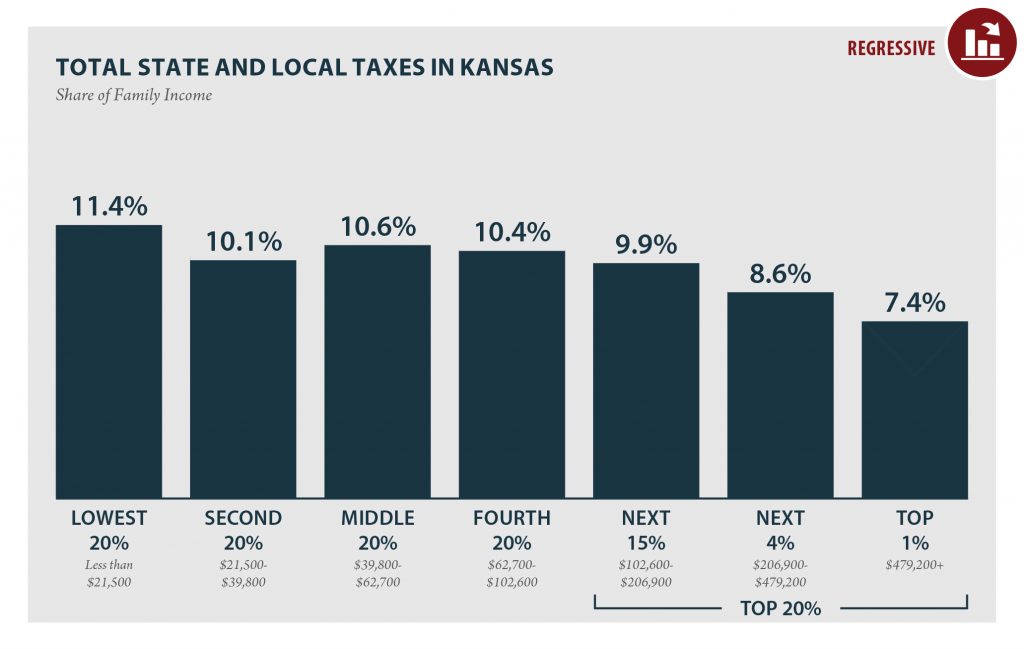
KANSAS Read as PDF KANSAS STATE AND LOCAL TAXES Taxes as Share of Family Income Top 20% Income Group Lowest 20% Second 20% Middle 20% Fourth 20% Next 15% Next 4% Top 1% Income Range Less than $21,500 $21,500 to $39,800 $39,800 to $62,700 $62,700 to $102,600 $102,600 to $206,900 $206,900 to $479,200 over $479,200 […]
South Dakota: Who Pays? 6th Edition
October 17, 2018 • By ITEP Staff
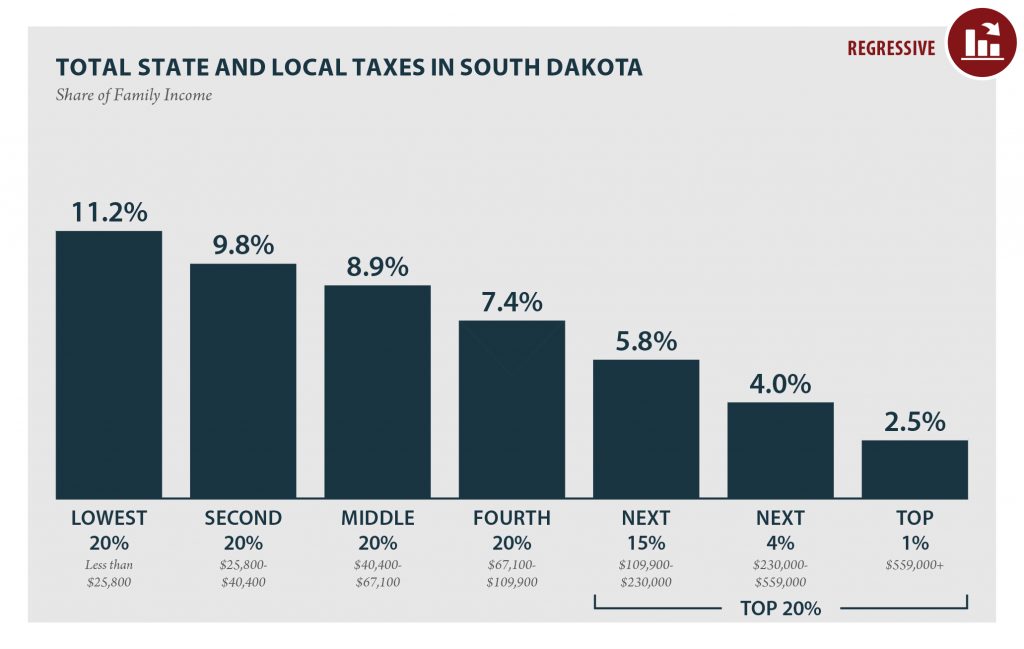
SOUTH DAKOTA Read as PDF SOUTH DAKOTA STATE AND LOCAL TAXES Taxes as Share of Family Income Top 20% Income Group Lowest 20% Second 20% Middle 20% Fourth 20% Next 15% Next 4% Top 1% Income Range Less than $25,800 $25,800 to $40,400 $40,400 to $67,100 $67,100 to $109,900 $109,900 to $230,000 $230,000 to $559,000 […]
All Americans pay taxes. Most of us pay federal and state income taxes. Everyone who works pays federal payroll taxes. Everyone who buys gasoline pays federal and state gas taxes. Everyone who owns or rents a home directly or indirectly pays property taxes. Anyone who shops pays sales taxes in most states.
While it can be hard to look away from the important federal policy debates occurring right now in Washington D.C., state lawmakers across the country will also be debating consequential fiscal policy changes in 2017 that will deserve close scrutiny. The context of those debates will vary by state: from coping with major revenue shortfalls, […]
The Little-Known Effect of State Tax Changes: More or Less Money to the Federal Government
August 24, 2016 • By Jenice Robinson
The Institute on Taxation and Economic Policy (ITEP) this week published a new policy brief whose conclusions may be surprising to those who don’t spend their days analyzing the intersection of state and federal tax policy. The brief, How State Tax Changes Affect Your Federal Taxes, outlines how the “federal offset,” or the deductibility of […]
Low Tax for Whom?: Tennessee is a “Low Tax State” Overall, But Not for Families Living in Poverty
September 17, 2015 • By Meg Wiehe
Annual data from the U.S. Census Bureau appear to lend support to Tennessee's reputation as a "low tax state," ranking it 50th nationally in taxes collected as a share of personal income.1 But focusing on the state's overall tax revenues has led many observers to overlook the fact that different taxpayers experience Tennessee's tax system very differently. In particular, the poorest 20 percent of Tennessee residents pay significantly more of their income (10.9 percent) in state and local taxes than any other group in the state. For low-income families, Tennessee is far from being a low tax state.2 In fact,…
Low Tax for Whom?: South Dakota is a “Low Tax State” Overall, But Not for Families Living in Poverty
September 17, 2015 • By Meg Wiehe
Annual data from the U.S. Census Bureau appear to lend support to South Dakota's reputation as a "low tax state," ranking it 51st nationally in taxes collected as a share of personal income, the lowest overall tax state.1 But focusing on the state's overall tax revenues has led many observers to overlook the fact that different taxpayers experience South Dakota's tax system very differently. In particular, the poorest 20 percent of South Dakota residents pay significantly more of their income (11.3 percent) in state and local taxes than any other group in the state. For low-income families, South Dakota is…
Low Tax for Whom?: Washington is a “Low Tax State” Overall, But Not for Families Living in Poverty
September 17, 2015 • By Meg Wiehe
Annual data from the U.S. Census Bureau appear to lend support to Washington's reputation as a "low tax state," ranking it 36th nationally in taxes collected as a share of personal income.1 But focusing on the state's overall tax revenues has led many observers to overlook the fact that different taxpayers experience Washington's tax system very differently. In particular, the poorest 20 percent of Washington residents pay significantly more of their income (16.8 percent) in state and local taxes than any other group in the state. For low-income families, Washington is far from being a low tax state.2 In fact,…
Low Tax for Whom?: Florida is a “Low Tax State” Overall, But Not for Families Living in Poverty
September 17, 2015 • By Meg Wiehe
Annual data from the U.S. Census Bureau appear to lend support to Florida's reputation as a "low tax state," ranking it 48th nationally in taxes collected as a share of personal income.1 But focusing on the state's overall tax revenues has led many observers to overlook the fact that different taxpayers experience Florida's tax system very differently. In particular, the poorest 20 percent of Florida residents pay significantly more of their income (12.9 percent) in state and local taxes than any other group in the state. For low-income families, Florida is far from being a low tax state.2 In fact,…
Low Tax for Whom?: Texas is a “Low Tax State” Overall, But Not for Families Living in Poverty
September 17, 2015 • By Meg Wiehe
Annual data from the U.S. Census Bureau appear to lend support to Texas' reputation as a "low tax state," ranking it 39th nationally in taxes collected as a share of personal income.1 But focusing on the state's overall tax revenues has led many observers to overlook the fact that different taxpayers experience Texas' tax system very differently. In particular, the poorest 20 percent of Texans pay significantly more of their income (12.5 percent) in state and local taxes than any other group in the state. 2 For low-income families, Texas is far from being a low tax state. In fact,…
Low Tax for Whom?: Arizona is a “Low Tax State” Overall, But Not for Families Living in Poverty
September 17, 2015 • By Meg Wiehe
Annual data from the U.S. Census Bureau appears to lend support to Arizona's reputation as a "low tax state," ranking it 37th nationally in taxes collected as a share of personal income.1 But focusing on the state's overall tax revenues has led many observers to overlook the fact that different taxpayers experience Arizona's tax system very differently. In particular, the poorest 20 percent of Arizona residents pay significantly more of their income (12.5 percent) in state and local taxes than any other group in the state.2 For low-income families, Arizona is far from being a low tax state. In fact,…
Major tax overhauls are on the agenda in a record number of states, and “Who Pays?” documents in state-by-state detail the precise distribution of state income taxes, sales and excise taxes and property taxes paid by each income group as of January 2013. It is a critical baseline against which future proposals can be measured. […]
Last week, the Institute on Taxation and Economic Policy released Who Pays?, a report that examines the state and local tax system in all 50 states. The analysis concludes that every state’s tax system is regressive, meaning the lower one’s income, the higher one’s tax rate. Not surprisingly, the report ruffled a few feathers. It’s […]
Read the Report in PDF The 2015 Who Pays: A Distributional Analysis of the Tax Systems in All Fifty States (the fifth edition of the report) assesses the fairness of state and local tax systems by measuring the state and local taxes that will be paid in 2015 by different income groups as a share […]
