Impact Of Donald Trump’s Tax Proposals by Income Group
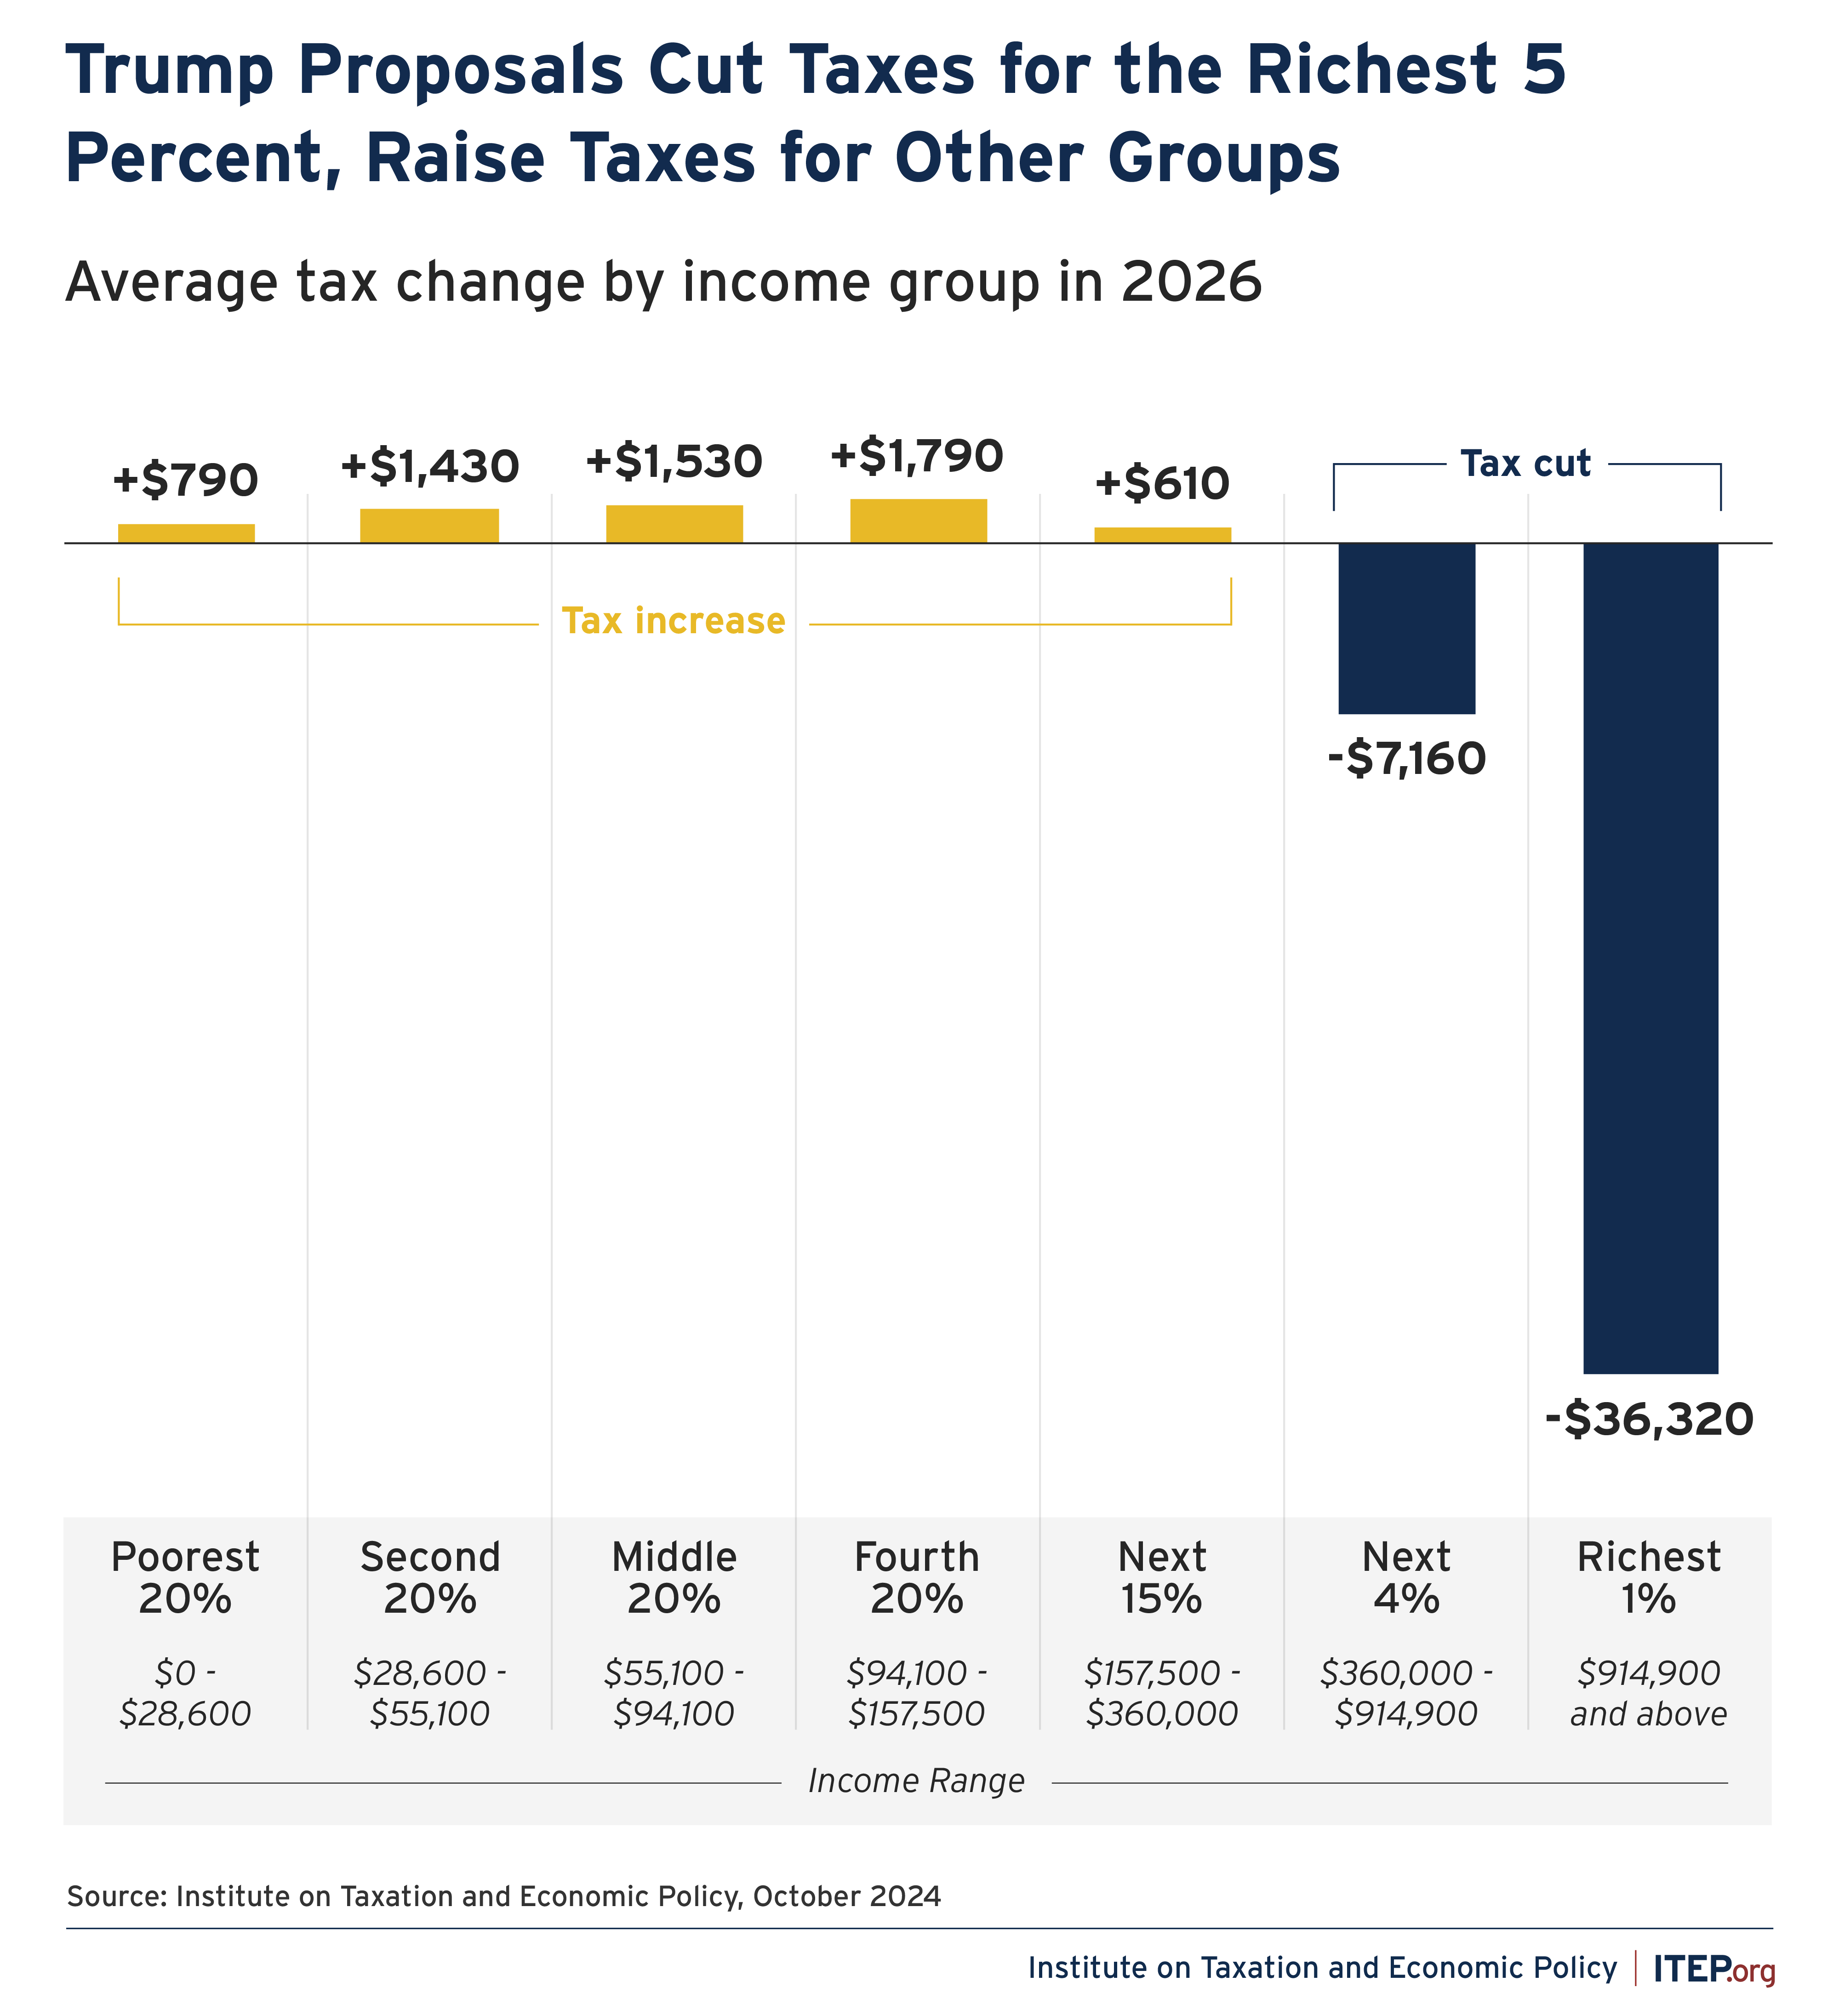
Former President Donald Trump has proposed a wide variety of tax policy changes. Taken together, these proposals would, on average, lead to a tax cut for the richest 5 percent of Americans and a tax increase for all other income groups.
If these proposals were in effect in 2026, the richest 1 percent would receive an average tax cut of about $36,300 and the next richest 4 percent would receive an average tax cut of about $7,200. All other groups would see a tax increase with the hike on the middle 20 percent at about $1,500 and the increase on the lowest-income 20 percent of Americans at about $800.
FIGURE 1
Former President Trump has offered several tax proposals, which are all included in these estimates:
- Extending the temporary provisions in Trump’s 2017 tax law that will otherwise expire at the end of 2025, except for the $10,000 cap on State and Local Tax (SALT) deductions, which Trump says he would not extend
- Exempting certain types of income from taxes (overtime pay, tips, and Social Security benefits)
- Reducing the corporate tax rate from 21 percent to 20 percent and then further reducing it to 15 percent for “companies that make their product in America”
- Repealing tax credits enacted as part of President Biden’s Inflation Reduction Act that provide incentives for the production and use of green energy
- Imposing a new 20 percent tariff on imported goods, with a higher rate of 60 percent for goods from China
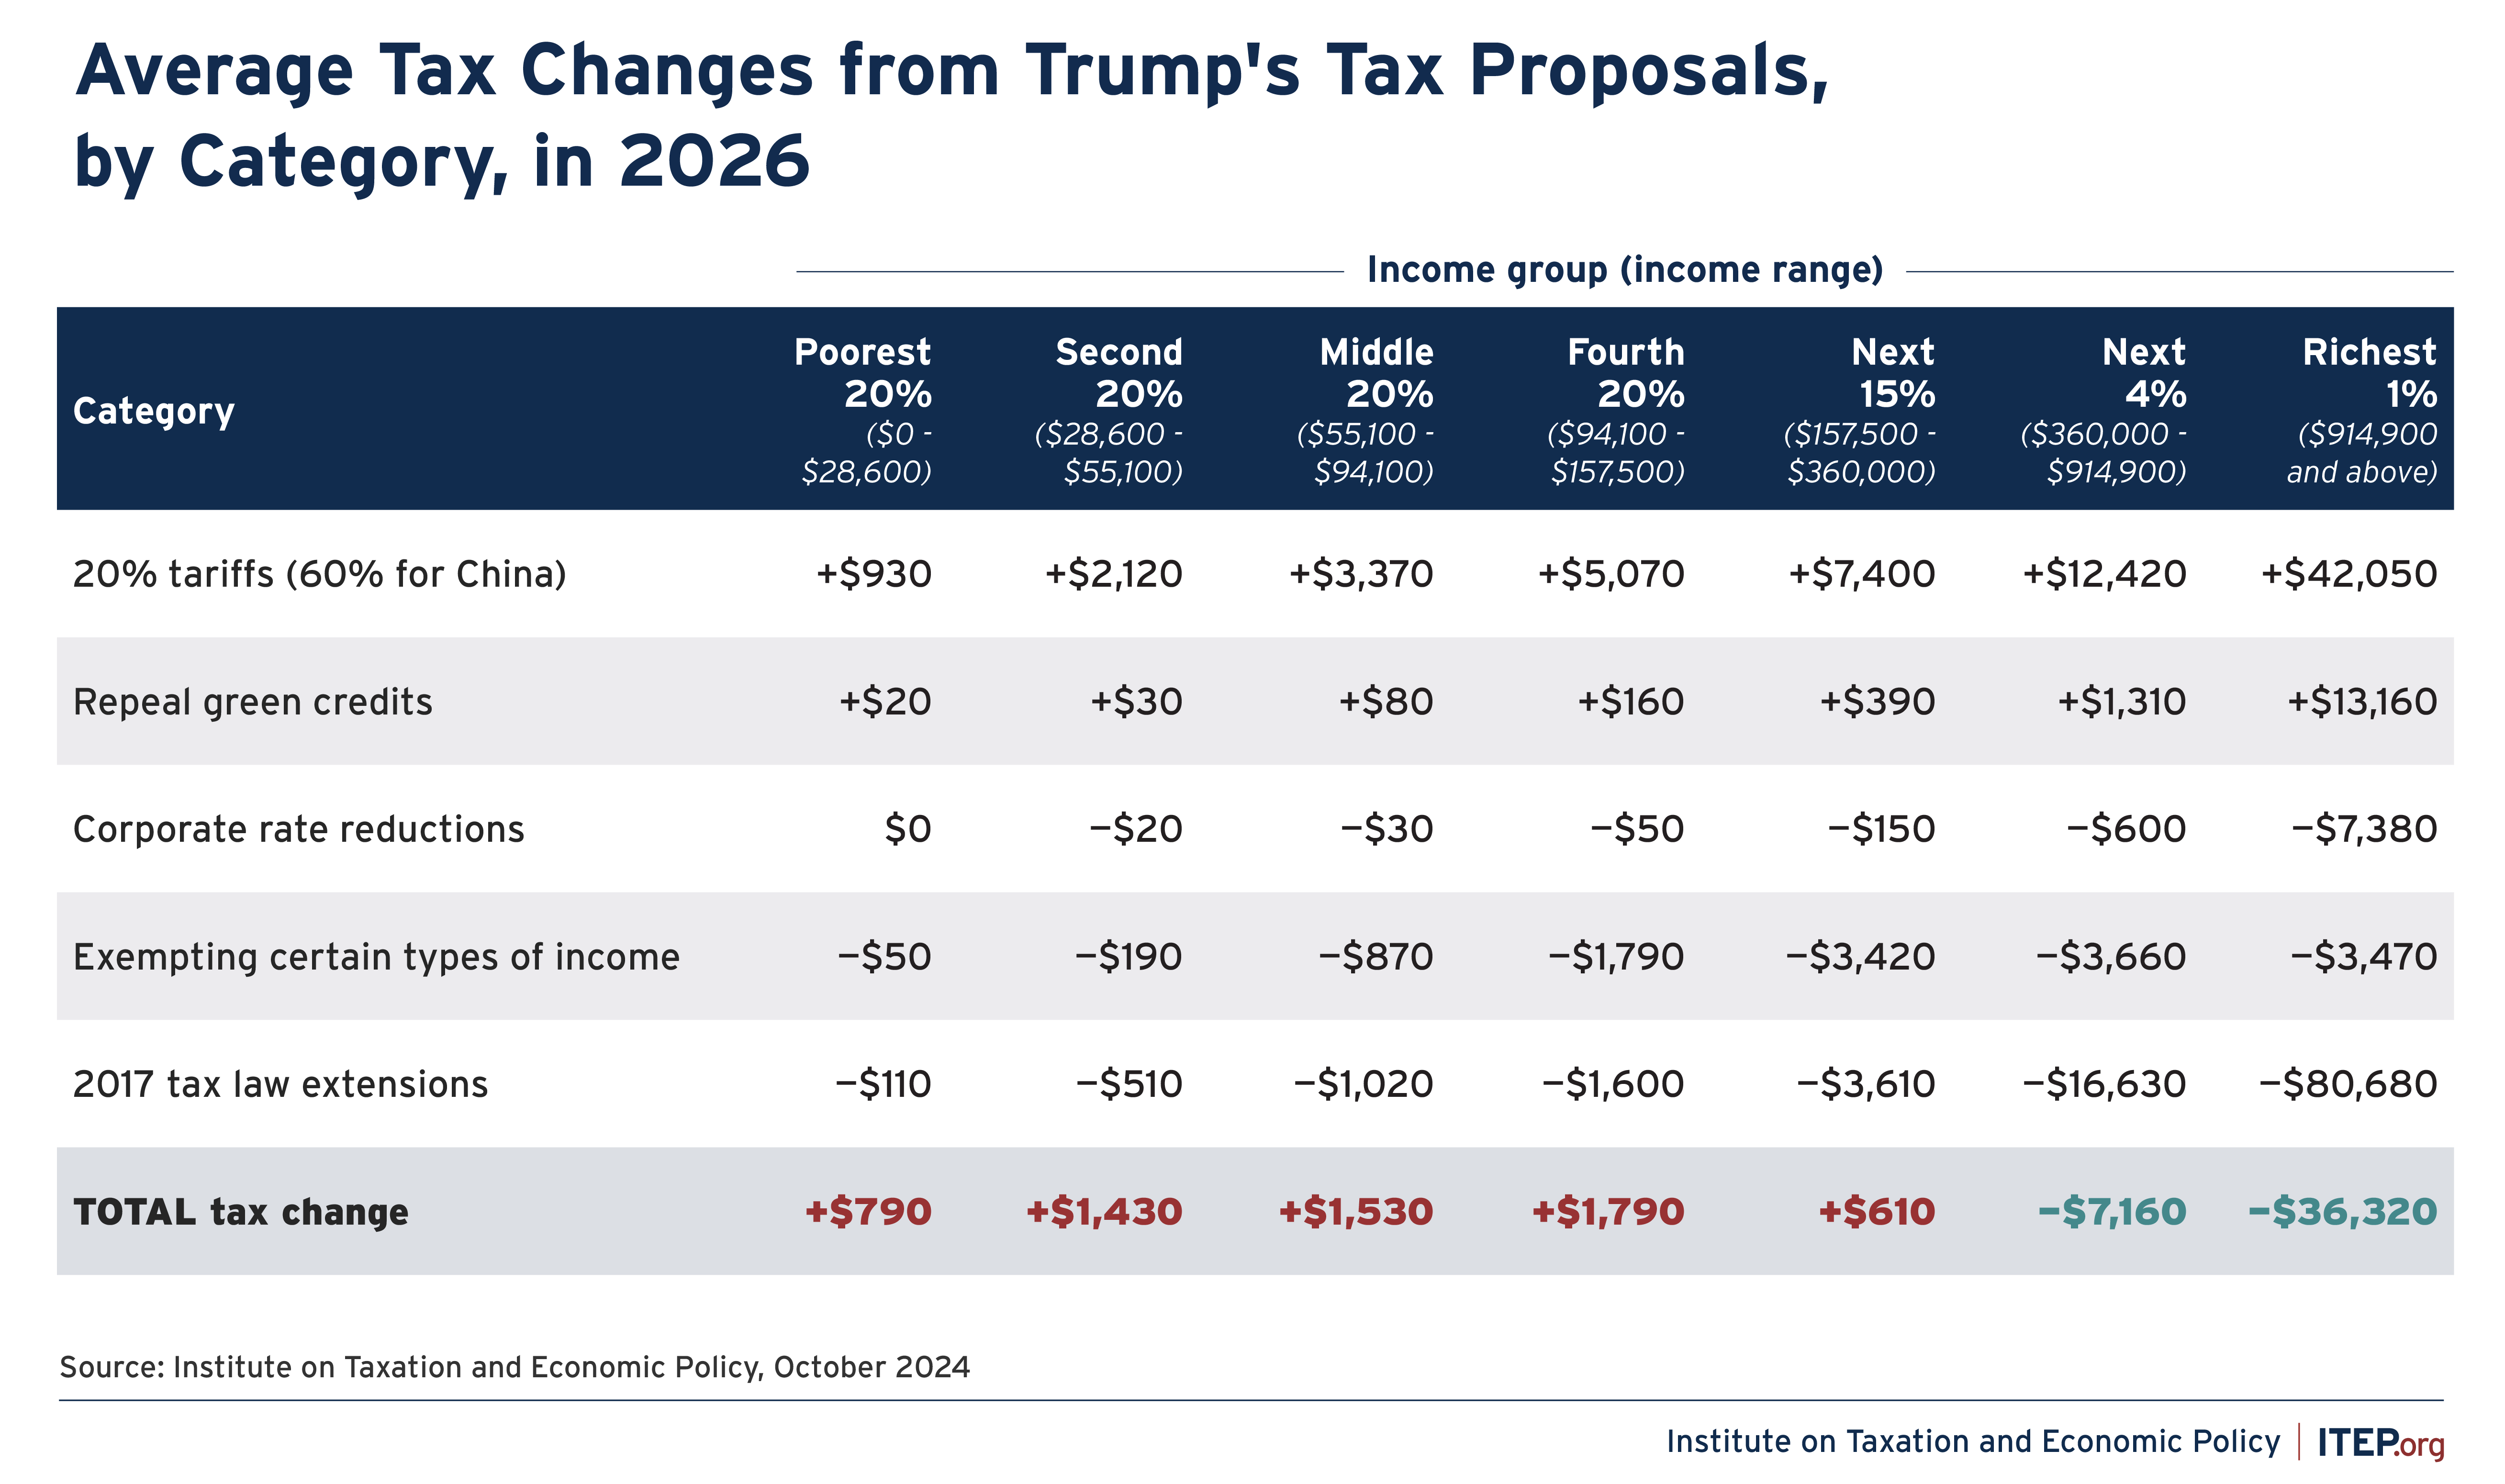
As illustrated in Figure 2, some of Trump’s proposals cut taxes dramatically, particularly his proposal to extend the temporary 2017 tax provisions. But his proposed tariffs, which would be largely passed onto consumers as increased prices, would more than offset those tax cuts for all income groups outside the richest 5 percent.
FIGURE 2
While Figures 1 and 2 above measure the impact for each income group as the average tax change in dollars, Figures 3 and 4 below measure the impact as a share of income for each group.
Measured as a share of income, the tax increases faced by most Americans would fall hardest on working-class families. As illustrated in Figure 3, the middle 20 percent of Americans would face a tax increase equal to 2.1 percent of their income, while the poorest 20 percent of Americans would face a tax increase equal to 4.8 percent of their income – all while the top 5 percent get a tax cut.
FIGURE 3
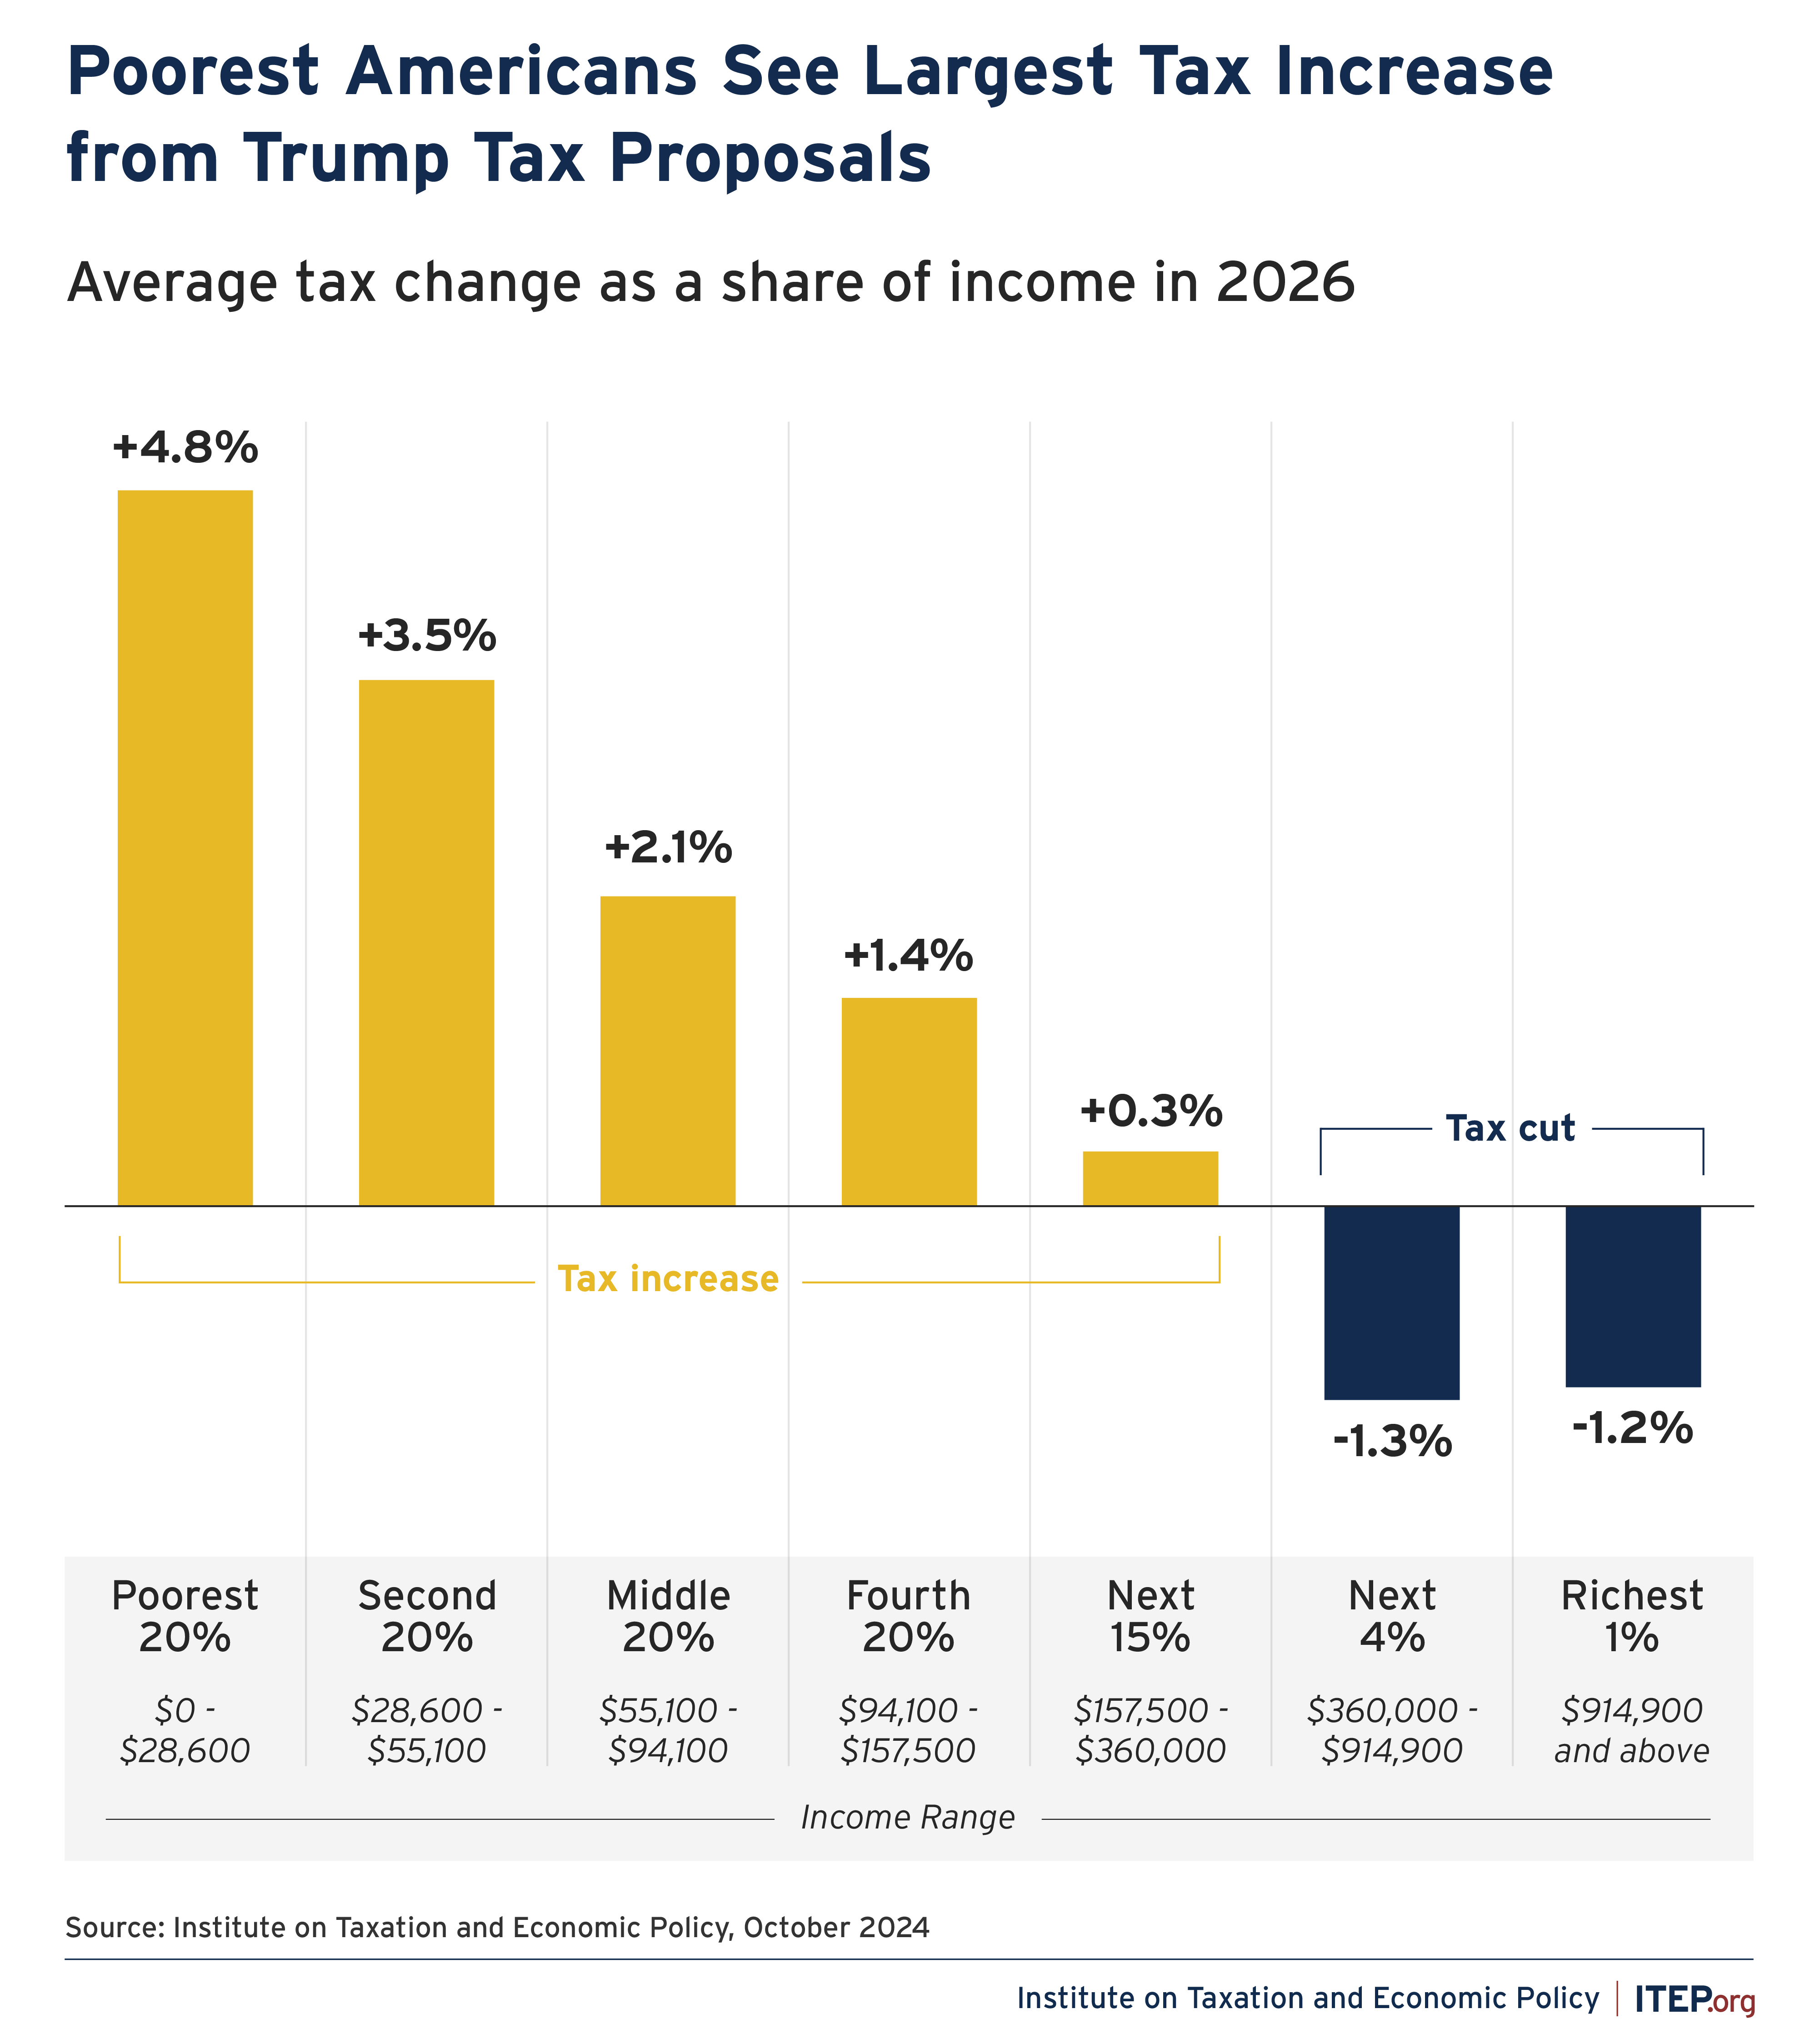
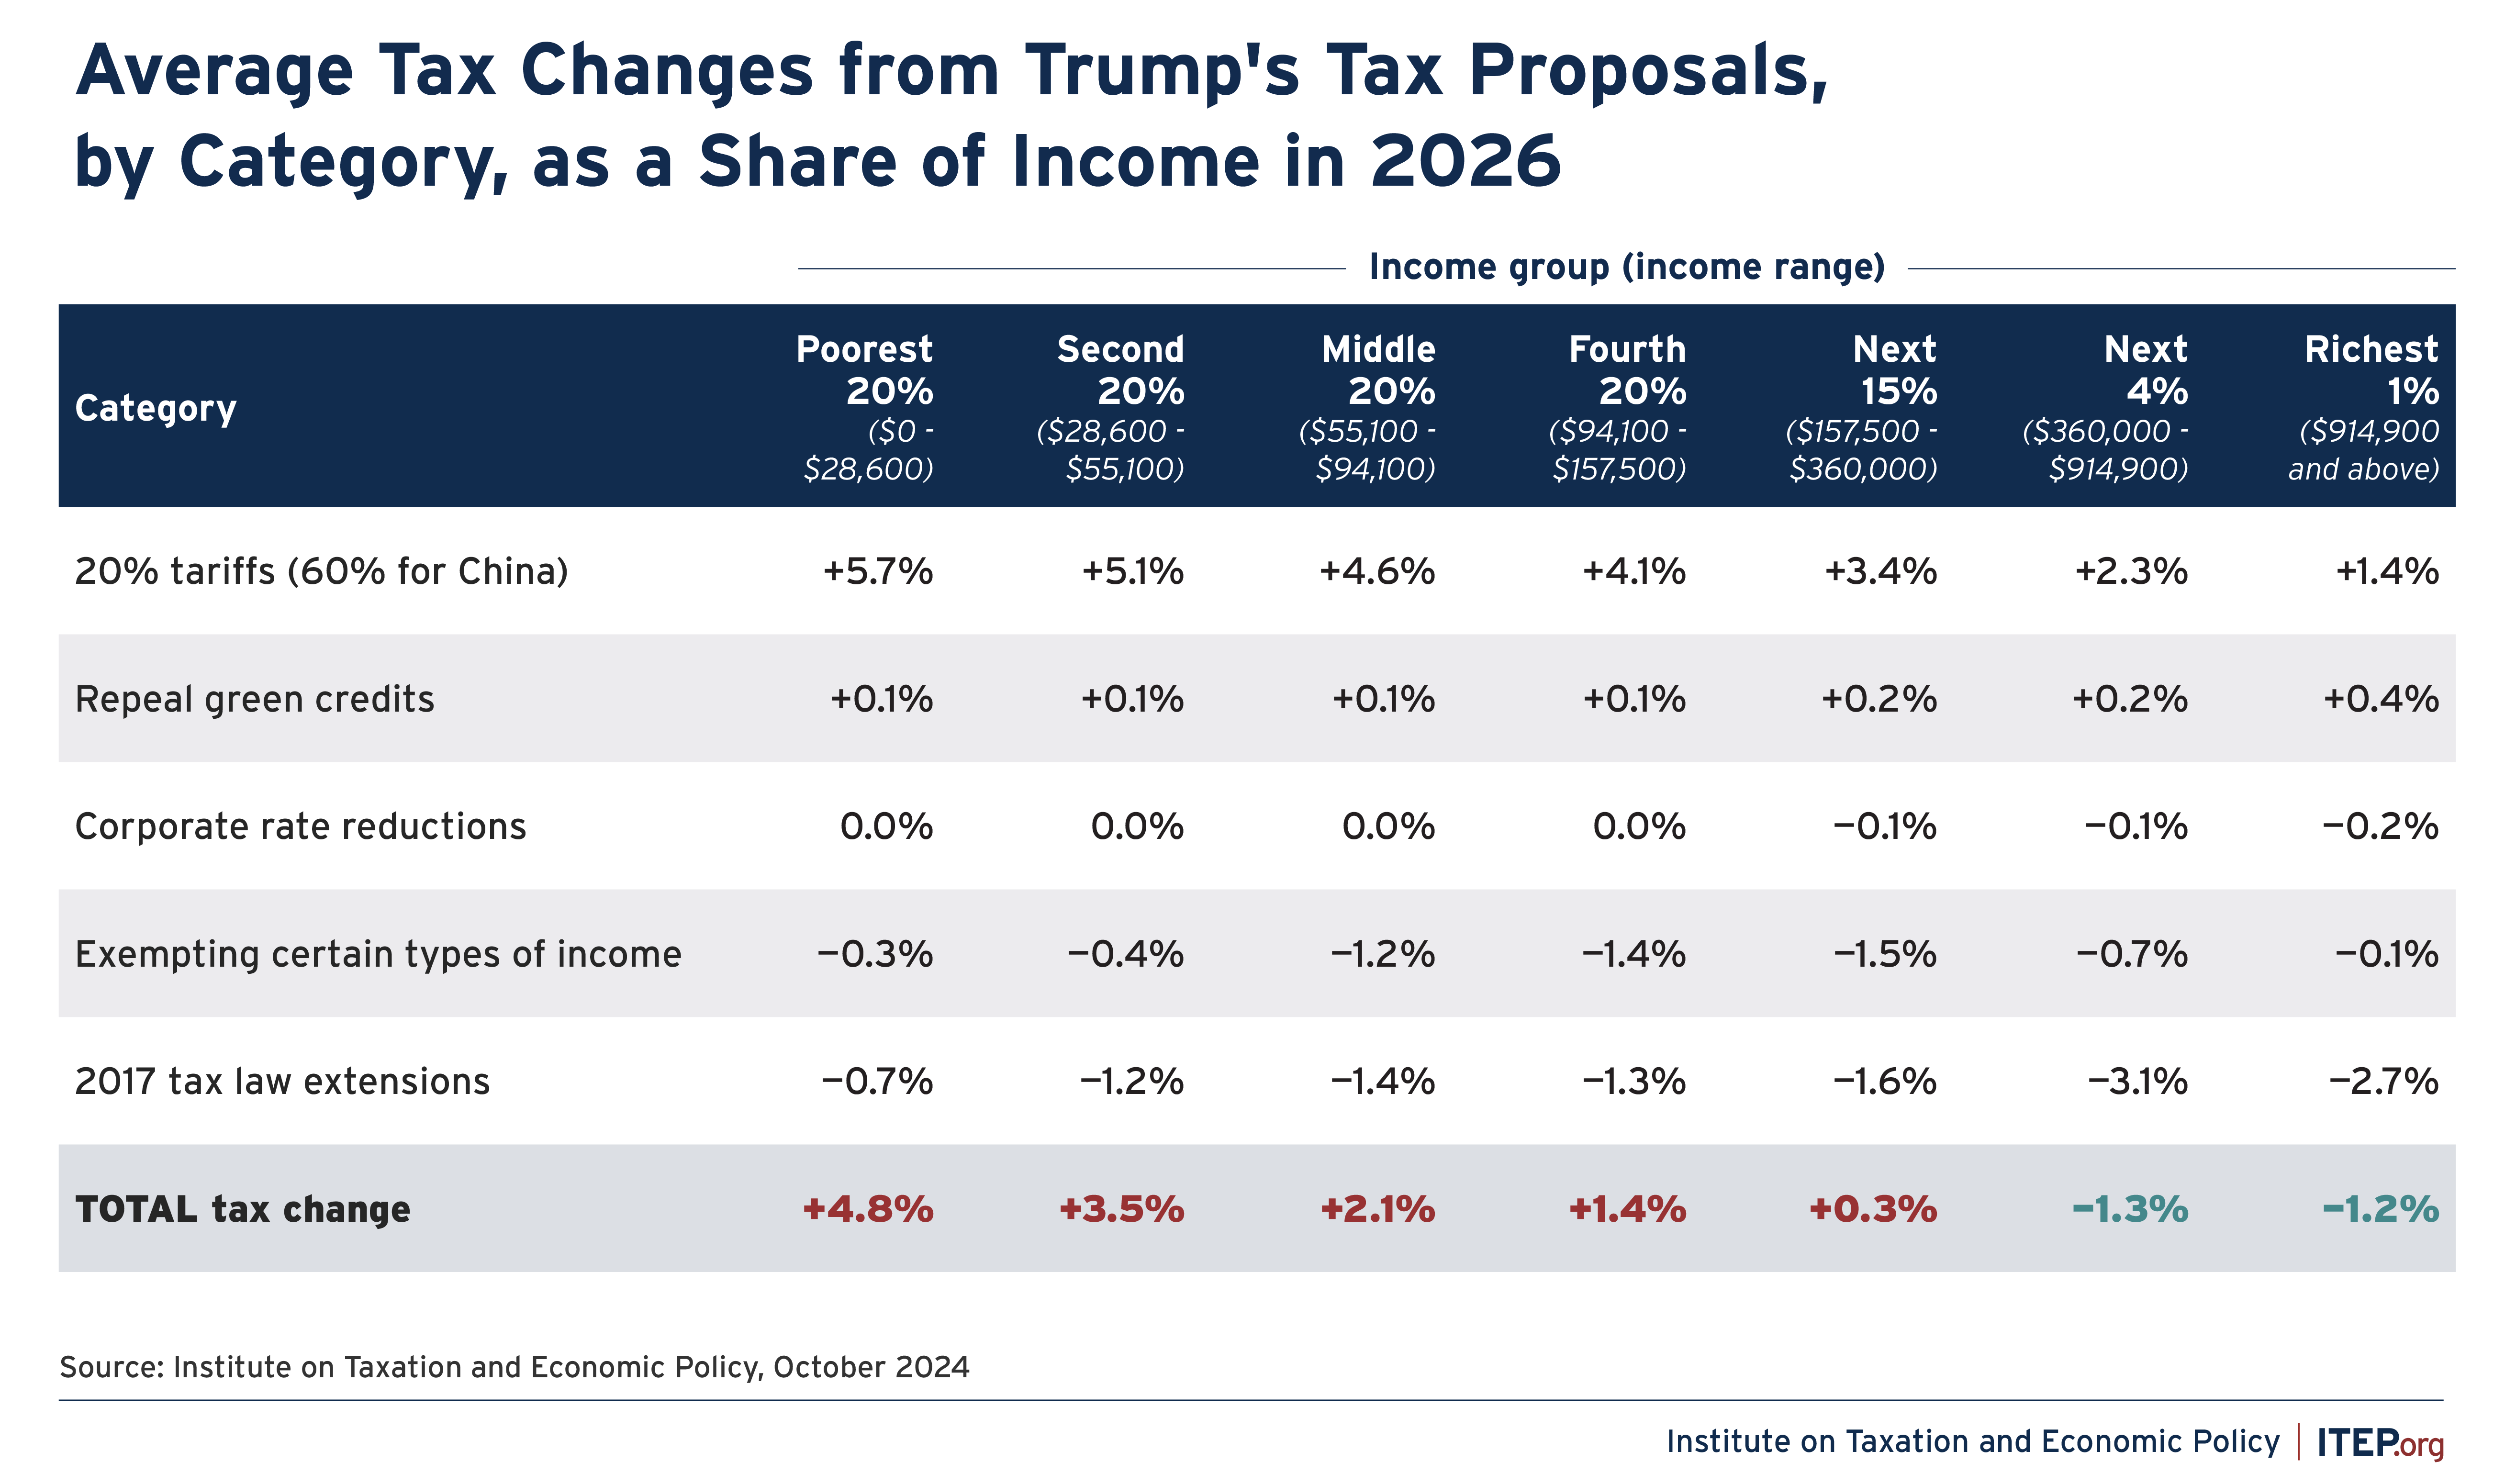
Figure 4 reveals how the various categories of Trump’s tax proposals are contributing to the plan’s overall impact. The effective tax increase that results from Trump’s tariff proposal, for example, would be paid by everyone who makes purchases in the U.S., but it would comprise a smaller share of income for the richest taxpayers than it would for everyone else.
Similarly, Trump’s proposals to extend the temporary 2017 tax provisions would cut taxes, on average, for all income groups, but it would provide much larger tax cuts to the richest groups as a share of income.
FIGURE 4
Overview of Former President Trump’s Tax Proposals
The appendix at the end of this report includes estimates that are broken down into each category of the provisions described here.
Extending Temporary 2017 Tax Provisions
The lawmakers who drafted the 2017 tax law made many of its provisions temporary to hide the costs of eventually making those provisions permanent. Those temporary provisions expire at the end of 2025. They are mostly tax cuts, but they also include some provisions that raise taxes and partly offset the costs of the tax cuts. The overall result for most taxpayers was a tax cut.
This analysis assumes that Trump’s proposal to extend the temporary 2017 tax provisions would be identical to legislation in Congress to accomplish the same goal (the TCJA Permanency Act) with one exception. Recently Trump announced he would not extend the cap on federal income tax deductions for state and local taxes (SALT), the most significant provision in the law that slightly offsets the legislation’s tax breaks for the wealthy. This means that the tax breaks resulting from Trump’s proposed extension of the 2017 law would be even larger and more regressive than the TCJA Permanency Act, which ITEP has recently analyzed with national and state-by-state estimates.[1]
The temporary 2017 tax provisions included several types of changes to the tax code:
- Reduced most of the income tax rates and adjusted the tax brackets
- Increased the standard deduction and Child Tax Credit and offset most of the costs by repealing personal exemptions
- Restricted the reach of the Alternative Minimum Tax (AMT), a backstop tax to limit tax breaks for the well-off
- Changed itemized deductions by eliminating some and removing an overall limit to itemized deductions for the well-off (It also sharply capped the deduction for state and local taxes, but that is not included in this analysis because Trump has recently stated he would not extend that limit.)
- Created a 20 percent deduction for income from “pass-through” businesses, which mostly benefits the richest 1 percent
- Restricted the reach of the estate tax so that a married couple can now leave behind more than $27 million in 2024 without any estate tax liability[2]
Exempting Certain Types of Income from Tax
Trump has proposed preferencing several types of income – tips, overtime pay, and Social Security benefits – over other forms of income that Americans receive.
As seen earlier in Figure 4, taken as a group these new carveouts would be most advantageous to upper-middle class Americans. This is because the highest-income families do not tend to receive especially large amounts of these forms of income, and lower- and moderate-income families are generally not positioned to make full use of these tax exemptions due to other exemptions and the income tax’s graduated rate structure.
An approach that provides tax breaks specifically to low- and middle-income families, regardless of the type of income they receive, would be more targeted and fairer. For example, a tipped worker may or may not earn a large income, and even one earning very little could be married to someone with a large salary, meaning their household income is much higher than average.
Cutting the Corporate Tax Rate
Trump proposes to cut the federal corporate tax rate from 21 percent to 20 percent, and further to 15 percent for “companies that make their product in America.” While Trump has not provided any more details on this proposal, the concept is broadly similar to the section 199 deduction for domestic production that existed until it was repealed in the 2017 law to, in small part, offset the cost of corporate tax cuts. That deduction, which had the effect of lowering the tax rate paid by eligible companies as determined by a complex set of rules, was estimated to apply to about 37 percent of corporate profits in one study.[3] The best available evidence suggests the deduction failed to increase manufacturing in the U.S.[4]
These proposed cuts would follow deep corporate tax cuts – most of which were permanent – that were part of the 2017 tax law. Most prominently, the 2017 law reduced the federal corporate income tax rate from 35 percent to 21 percent. Most corporations pay an effective rate that is lower than the statutory rate, and the effective rate paid by most companies fell as well after 2017. America’s largest, consistently profitable corporations saw their effective tax rates fall from an average of 22.0 percent to an average of 12.8 percent after the Trump tax law went into effect.[5]
Cuts in the federal corporate income tax mainly benefit owners of U.S. corporate stocks, which are held disproportionately by high-income households and by white households, which means they contribute to inequality in the U.S., even as many of the benefits flow out of the country to foreign investors.[6]
Repealing Green Energy Tax Credits
Trump has suggested that he would repeal a wide array of tax credits designed to accelerate the nation’s transition to green energy sources. Some of these tax credits, enacted as part of the Inflation Reduction Act, go to individuals and businesses purchasing electric vehicles or energy-efficient equipment, while others flow to companies ramping up their production of solar, wind, and other green energy sources. The effect of repealing these credits would be partly to raise after-tax costs for consumers and partly to reduce the profits of companies participating in the green energy transition.
Not captured in the estimates shown in this report are the broader benefits to society related to reducing climate change, which are the motivation for the enactment of these credits.
Imposing New Tariffs
Trump proposes a new 60 percent tariff on goods imported from China and a 20 percent tariff on goods imported from other countries. His recent statement that he would impose tariffs of between 50 percent and 200 percent came too late for this analysis and lacks specificity.
While targeted tariffs can have a useful role in trade policy, economists agree that tariffs, particularly broad-based tariffs, raise the prices paid by consumers and businesses on the goods and services they buy.[7] The sweeping tariffs proposed by Trump, which are far larger than any on the books today, would raise the prices faced by American consumers across the income scale. Because lower- and middle-income families must spend a larger share of their earnings to make ends meet, this would have a particularly noticeable impact on their household budgets. The portion paid initially by businesses is also largely passed through to consumers although portions are passed to shareholders and employees.
Tariffs on the scale that former President Trump has proposed would massively disrupt the economy. They would cause substantial price increases on imported goods, severely damage the industries that rely on imports, hurting employment in those industries, and result in price increases for goods for which final production occurs domestically. There is no coherent economic analysis that suggests that the costs would significantly be borne by foreign exporters. In the environment of a fully employed workforce with 5 percent of it targeted for deportation,[8] there is little capacity for production to shift to the U.S.
In many cases such shifts would be enormously expensive and in some cases they would be impossible. To the extent there might be some shifting of production it would be at the expense of current goods and services produced in the U.S. and would result in higher prices for consumers. A discussion of the economic literature that underpins the general incidence approach taken here can be found in a paper by Clausing and Lovely. For further discussion of the specific ITEP approach to modeling tariffs, see the methodology section.
Appendix: Methodology
The bulk of this analysis was conducted using the ITEP Microsimulation Tax Model. The unconventional nature of many of the policy proposals crafted by former President Trump, however, required bringing in new data and techniques previously outside the model’s scope. Each of the major components of the tax modeling underlying this report is discussed below.
Personal Income Tax
The bulk of the personal income tax changes proposed by Trump—especially the extension of temporary tax provisions first enacted as part of the Tax Cuts and Jobs Act of 2017 (P.L. 115-97, often called the “2017 tax law”)—are well within the scope of the ITEP Model’s core competencies. ITEP’s previous report on extending the 2017 tax provisions provides a more detailed explanation of how these estimates are produced.[9]
The model combines data from the Internal Revenue Service, the U.S. Census Bureau’s American Community Survey, and numerous other sources to create a valid representation of the U.S. population, including federal filers and nonfilers (ITEP 2024). Its structure mirrors models at the federal level maintained by the congressional Joint Committee on Taxation, the U.S. Treasury Department, and the Congressional Budget Office, and at the state level by the Minnesota Department of Revenue and other state agencies. Microsimulation modeling is widely regarded as the best approach to tax policy analysis because of its ability to account for overlapping and interacting tax provisions and to produce results that are representative of the full population.
Trump proposes to create new income tax exemptions for two forms of income—tips and overtime pay—that are not currently reported in IRS datasets in forms suitable for distributional analysis. These proposals therefore require bringing new information into the ITEP Model dataset.
We use IRS data on the overall amount of reported tips and distribute that amount by income level using data obtained from the U.S. Census Bureau’s Current Population Survey Annual Social and Economic Supplement (ASEC). Because of sample size issues the tax change for the tip exemption should not be considered reliable for the top 5 percent income groups.
For the analysis of overtime pay, we rely on data from the Bureau of Labor Statistics to estimate the current volume of overtime pay, and on data by income level from the Survey of Income and Program Participation (SIPP) to estimate the distribution of that pay across groups.
Notably, our analyses of exemptions for tips and overtime pay assume no gaming or behavioral response as the level and character of such a response would be heavily dependent on the design of rules preventing manipulation by taxpayers that Trump has yet to articulate. Without strong rules, both the cost and regressivity of new exemptions for tips and overtime pay could be more substantial than we estimate in this study.
Corporate Income Tax
Trump has proposed lowering the overall corporate income tax rate from 21 to 20 percent, and pairing that with an additional reduction to 15 percent for “companies that make their product in America.” Our estimate of the reach of that 15 percent rate relies on work by Lestor and Rector (2016) finding that 37.2 percent of corporate taxable income qualified for a similar policy (IRC Section 199) designed to lower the effective tax rate on U.S. manufacturing prior to its repeal under President Trump in 2017. Our analysis applies this same 37.2 percent coverage rate to Trump’s new proposal.
For the distribution of Trump’s corporate tax cuts by income level, we adopt the approach used by the Joint Committee on Taxation and assign the full impact to owners of capital as our analysis examines the immediate impact of such a change in the first year it would be in effect (JCT 2013). This includes foreign owners of stocks in U.S. corporations.
It is unclear what the foreign-owned fraction is today under JCT’s analyses, but others find it is now much higher than previously believed. Steve Rosenthal and Theo Burke at the Tax Policy Center estimated in 2019 foreign investors owned 40 percent of the shares in American corporations.[10] (This figure has recently been updated to 42 percent, but ITEP uses the 40 percent estimate for simplicity and because the difference between these figures is small.[11])
Green Energy Credits
Our modeling of the distributional impact of repealing the green energy tax credits contained in the Inflation Reduction Act of 2022 (P.L. 117-169) includes several components. The distribution of electric vehicle credits benefiting individuals, for example, is based on our analysis of electric vehicle ownership in the Federal Highway Administration’s National Household Travel Survey. We distribute the residential energy credits with the assistance of IRS tabular data. The remainder of the credits are paid to business entities and benefit people indirectly.
In the ITEP modeling, these credits are generally assigned to the owners of capital, much like with our analysis of the first-year effects of the corporate tax rate changes included in Trump’s tax plan. This approach errs on the side of making Trump’s proposals look less regressive than they are because, given the nature of the business entities involved, a substantial portion of the cost of repeal is passed through to consumers. This likelihood of a shared incidence effect between consumers and producers is discussed in Bistline et al. (2023).
Estate Tax
The incidence of the estate tax is assigned to the decedent, consistent with most other distributional analyses of this tax (Burman et al., 2008; Minnesota Department of Revenue, 2024). The ITEP Model’s estate tax module relies on a combination of data from the IRS and the Survey of Consumer Finances to estimate overall wealth and net taxable estate value across income levels.
Tariffs
Our approach to calculating the incidence of tariffs is strongly informed by Clausing and Lovely (2024a).
In particular, we adopt their reasoning as to why the incidence falls on consumers (a view shared almost universally among economists) and whether to account for changes in behavior. We also adopt their assumptions about the policy: a 20 percent tariff on goods from all countries except China for which the tariff would be 60 percent and the assumption that the 60 percent would be a leveling up on past tariffs not on top of tariffs previously imposed (Clausing and Lovely, 2024b).
Although, as described below, our methodology differs from that of other analysts, such as Clausing and Lovely (2024) and Mulholland and Duke (2024), we reach similar conclusions. Our levels appear to be slightly lower than Duke and a bit less regressive than Clausing and Lovely. Our levels are higher than Clausing and Lovely because they do not distribute the entire amount attributable to the U.S. household sector.
A distinction between the approach used here and other analyses is that we make use of the consumption tax module of the ITEP Microsimulation Tax Model. The contours of that module are discussed in the methodological appendix of Davis et al. (2024). We also use a more complicated path from import data to household incidence. Our starting point is the Bureau of Economic Analysis (BEA) Import Matrices in conjunction with the BEA Use Tables. From these tables we find direct imports purchased as well as allocating imported inputs through to these categories of final purchasers. The final purchasers are in 17 categories in the data reflecting purchases for personal consumption, non-residential private fixed investment (businesses), residential private fixed investment, the federal government and state and local governments.
To distinguish between imports from China and the rest of the world, commodity level trade data are used and aligned with the BEA Use Table commodities.
For the portion of the imports that go to personal consumption, the BEA PCE Bridge is used to facilitate linking to the consumption items in the ITEP consumption tax module. Tariffs are calculated and distributed by the model. This constitutes most of what is distributed.
For the other final purchasers, we adopt different approaches. We assume that no tariffs are paid on imports by the federal government—or if they are, they are payments to itself so they do not impact households. State and local governments are treated as passing the taxes on to taxpayers. Business purchases and imported inputs into exports are modeled consistently with the handling of business consumption taxes in the ITEP Model as described in the methodological appendix of Davis et al. (2024).
For the revenue estimate we use the elasticities employed by Clausing and Lovely (2024a) as well as their revenue offset.
Appendix Data
Appendix References
- Bistline, John E. T., Neil R. Mehrotra, and Catherine Wolfram (2023). “Economic Implications of the Climate Provisions of the Inflation Reduction Act.” Brookings Papers on Economic Activity, Spring 2023: 77-157.
- Burman, Leonard B., Katherine Lim, and Jeffrey Rohaly (2008). “Back from the Grave: Revenue and Distributional Effects of Reforming the Federal Estate Tax.” Tax Policy Center.
- Clausing, Kimberly A. and Mary E. Lovely (2024a). “Why Trump’s Tariff Proposals Would Harm Working Americans.” Peterson Institute for International Economics Policy Brief 24-1.
- Clausing, Kimberly and Mary E. Lovely (2024b). “Trump’s Bigger Tariff Proposals Would Cost the Typical American Household Over $2,600 a Year.” Peterson Institute for International Economics.
- Davis, et al. (2024). “Who Pays? A Distributional Analysis of the Tax Systems in All 50 States.” Institute on Taxation and Economic Policy.
- ITEP (2024). “ITEP Tax Microsimulation Model Overview.” Accessed September 2024 on the website of the Institute on Taxation and Economic Policy.
- JCT (2013). “Modeling the Distribution of Taxes on Business Income.” Joint Committee on Taxation, JCX-14-13.
- Lester, Rebecca and Ralph Rector (2016). “What Companies Use the Domestic Production Activities Deduction?” Tax Notes.
- Minnesota Department of Revenue (2024). “2024 Minnesota Tax Incidence Study: An Analysis of Minnesota’s Household and Business Taxes Using November 2023 Forecast.” Minnesota Department of Revenue Tax Research Division.
- Mulholland, Ryan and Brendan Duke (2024). “Comparing Trump’s Haphazard $2,500 Tax Increase to Biden’s Targeted Tariffs.” Center for American Progress Action Fund.
Endnotes
[1] Steve Wamhoff, “Extending Temporary Provisions of the 2017 Trump Tax Law: Updated National and State-by-State Estimates,” Institute on Taxation and Economic Policy, September 13, 2024.
[2] Steve Wamhoff, ”The Estate Tax is Irrelevant to More Than 99 Percent of Americans,“ Institute on Taxation and Economic Policy, December 7, 2023.
[3] Lester & Rector (2016) find that 37.2 percent of all positive corporate taxable income is reported as eligible for the section 199 deduction in 2012. See Lester, R. & Rector, R.,” Which Companies Use the Domestic Production Activities Deduction?,”2016, Tax Notes, Vol. 152, No. 9, 2016,
[4] Richard Phillips, “The Domestic Production Activities Deduction: Costly, Complex and Ineffective,” Institute on Taxation and Economic Policy, October 26, 2017.
[5] Matthew Gardner, Michael Ettlinger, Steve Wamhoff, and Spandan Marasini, ”Corporate Taxes Before and After the Trump Tax Law,“ Institute on Taxation and Economic Policy, May 2, 2024.
[6] Steve Wamhoff and Emma Sifre, “Corporate Tax Breaks Contribute to Income and Racial Inequality and Shift Resources to Foreign Investors,” Institute on Taxation and Economic Policy, July 16, 2024.
[7] The Forum for the Kent A. Clark Center for Global Markets, “Election Economic Policy Ideas,” September 10, 2024.
[8] Michael Ettlinger and Robert Lynch, “The Economic Impact on Citizens and Authorized Immigrants of Mass Deportation,” University of New Hampshire Carsey School of Public Policy, August 29, 2024.
[9] Steve Wamhoff, Joe Hughes, and Matthew Gardner, “Extending Temporary Provisions of the 2017 Trump Tax Law: National and State-by-State Estimates,” Institute on Taxation and Economic Policy, May 4, 2023.
[10] Steve Rosenthal and Theo Burke, “Who’s Left to Tax? US Taxation of Corporations and Their Shareholders,” Tax Policy Center, October 27, 2020.
[11] Steve Rosenthal and Livia Mucciolo, “Who’s Left to Tax? Grappling With a Dwindling Shareholder Tax Base,” Tax Notes, April 1, 2024.