This analysis was updated on June 25, 2025.
- Download national and state-by-state estimates
- See state data
- Read our Senate Reconciliation Bill Analysis
The House of Representatives recently passed major tax and spending legislation titled the “One Big Beautiful Bill Act.” This analysis examines the bill’s tax provisions as passed on May 22, including last-minute revisions unveiled during the night of May 21. The estimates shown here were generated with the ITEP microsimulation model and reveal that the tax provisions would significantly favor the richest taxpayers. For working-class Americans, the tax cuts in the House bill are extremely modest, and overall taxes would rise for these families when the impact of higher import taxes, or tariffs, is accounted for.
- The richest 1 percent of Americans would receive a total of $121 billion in net tax cuts in 2026. The middle 20 percent of taxpayers on the income scale, a group that is 20 times the size of the richest 1 percent, would receive less than half that much, $56 billion in tax cuts that year.
- The $121 billion in net tax cuts going to the richest 1 percent next year would exceed the amount going to the entire bottom 60 percent of taxpayers (about $79 billion).
- The poorest fifth of Americans would receive less than 1 percent of the bill’s net tax cuts in 2026 while the richest fifth of Americans would receive 70 percent. The richest 5 percent alone would receive 45 percent of the net tax cuts that year.
- The richest 1 percent of Americans would receive an average net tax cut of more than $68,000, many, many times more than the average tax cut received by other income groups.
- The effects of President Trump’s tariff policies alone offset most of the tax cuts for the bottom 80 percent of Americans. For the bottom 40 percent of Americans, the tariffs impose a cost that is greater than the tax cuts they would receive under this legislation.
- Even foreign investors who own shares in U.S. companies would benefit more than the poorest fifth of Americans. These foreign investors would enjoy $22 billion in tax cuts in 2026 compared to just $1 billion for the bottom 20 percent of Americans.
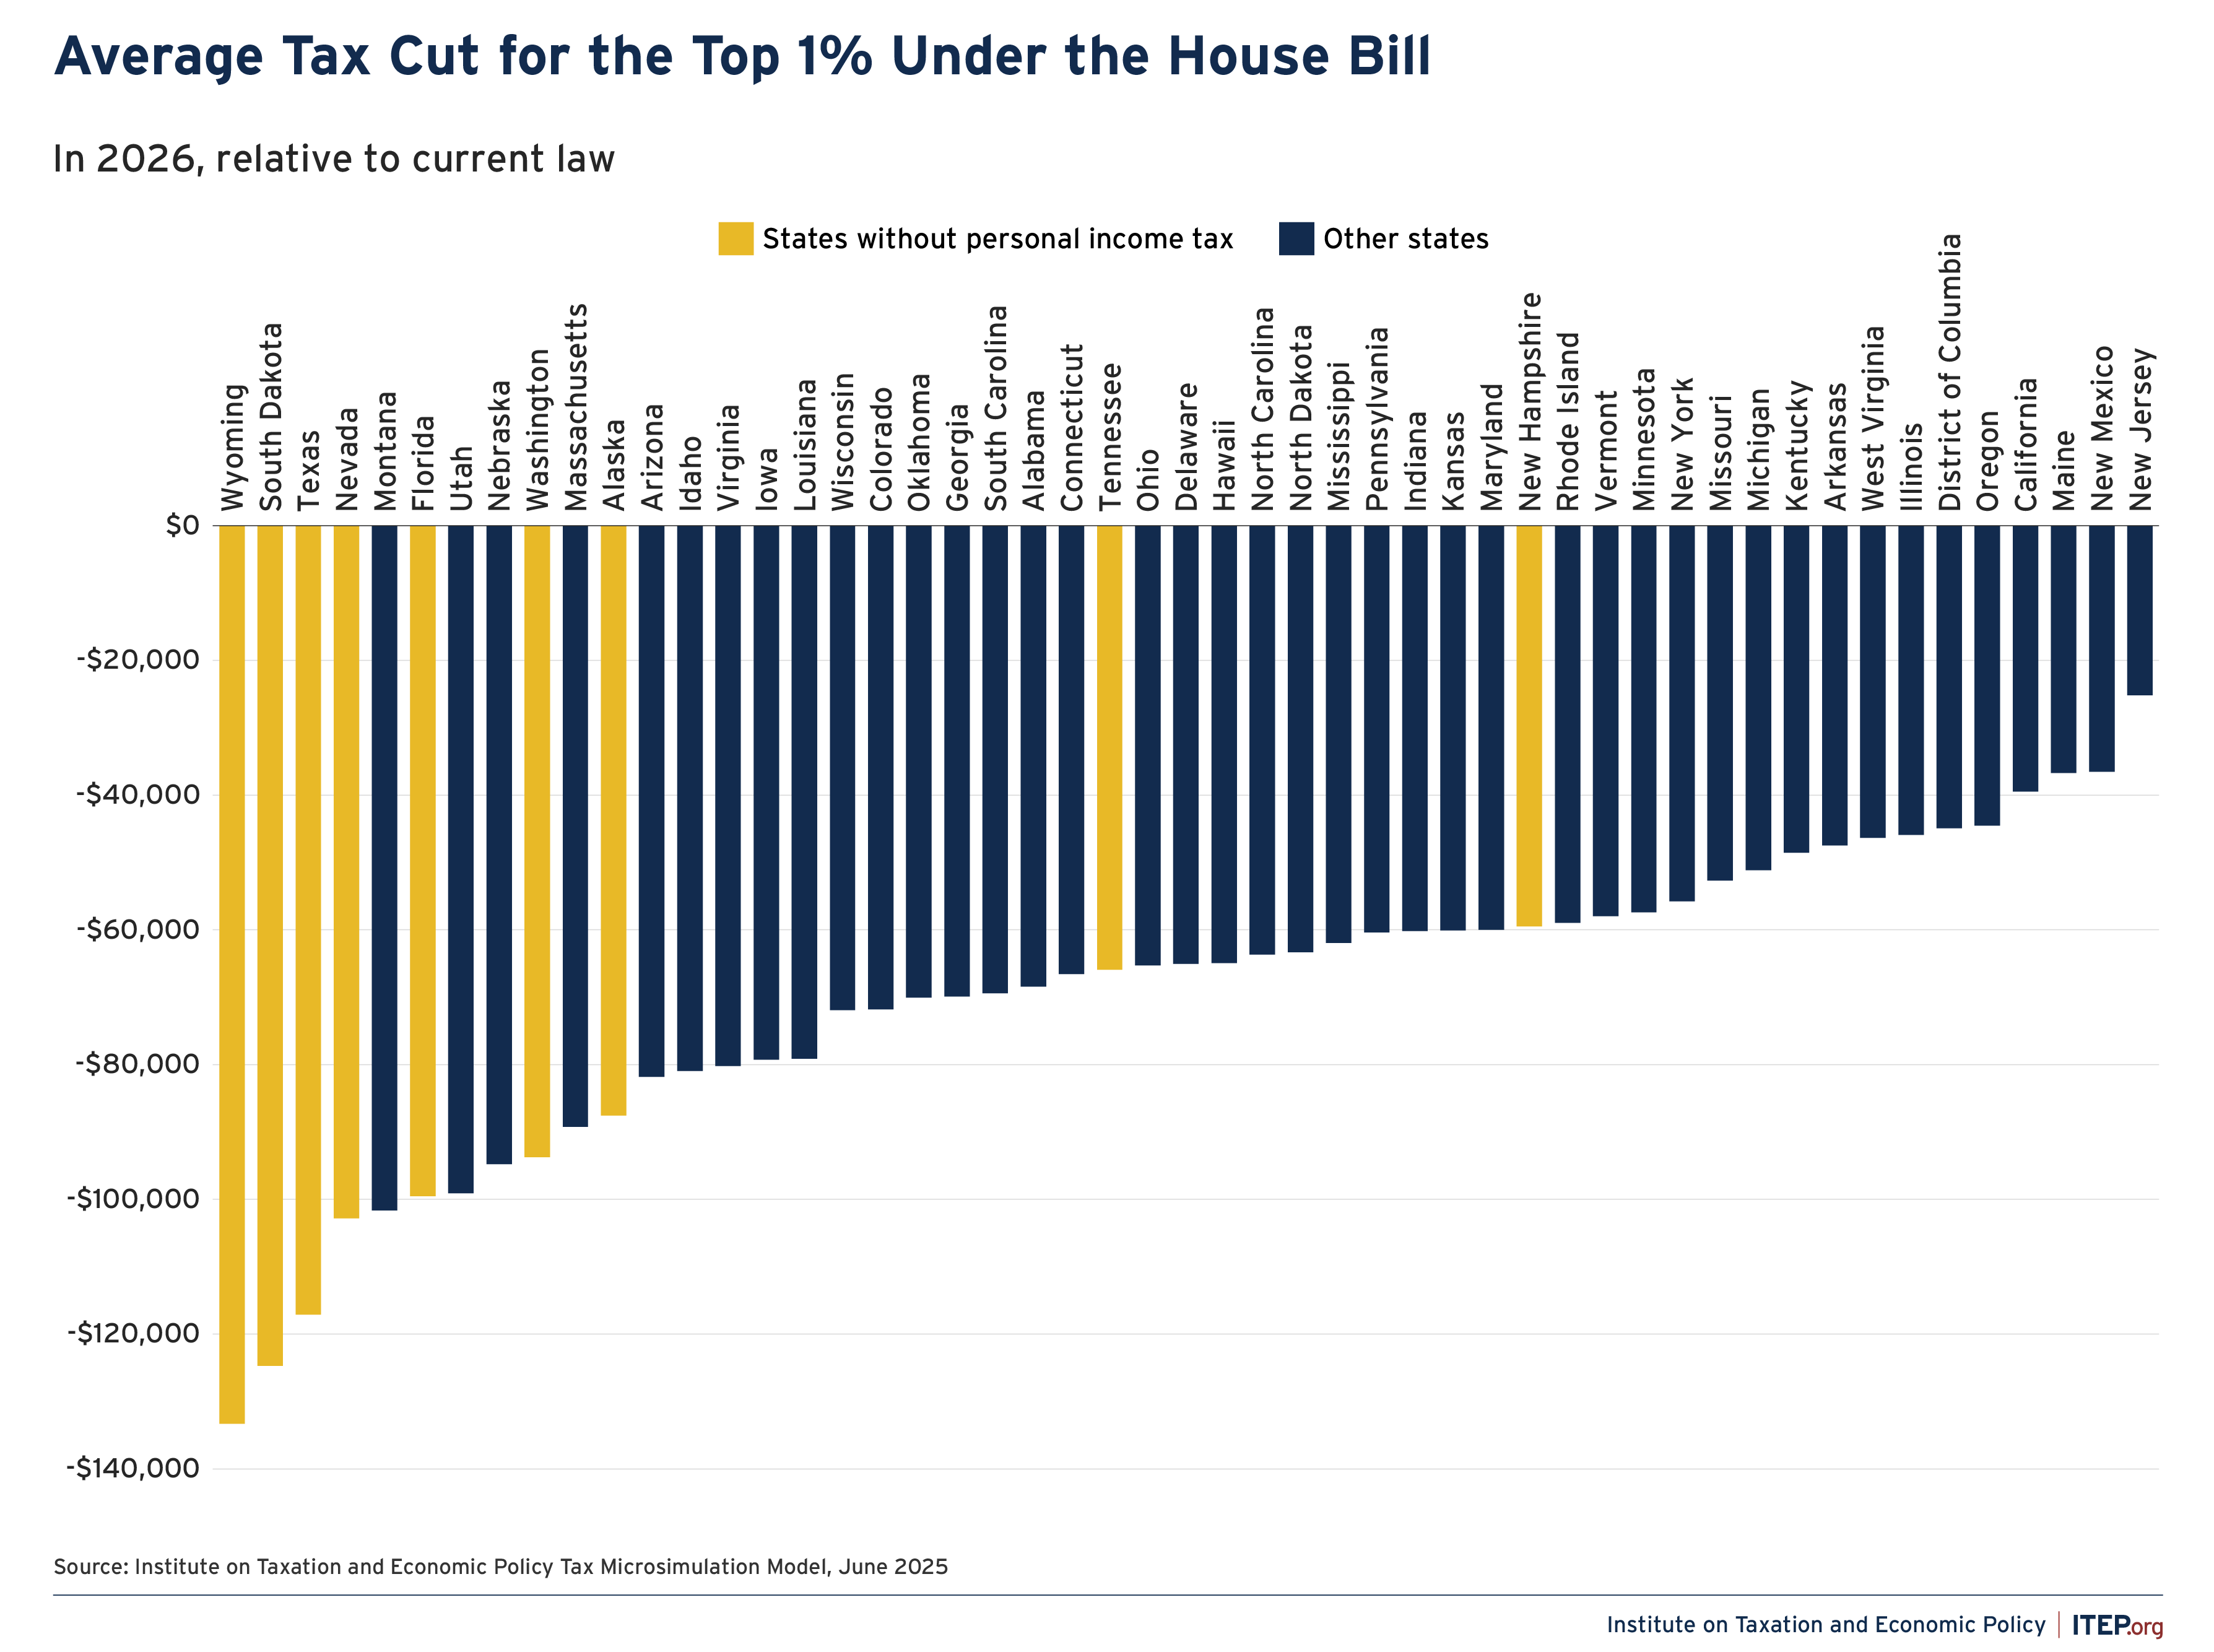
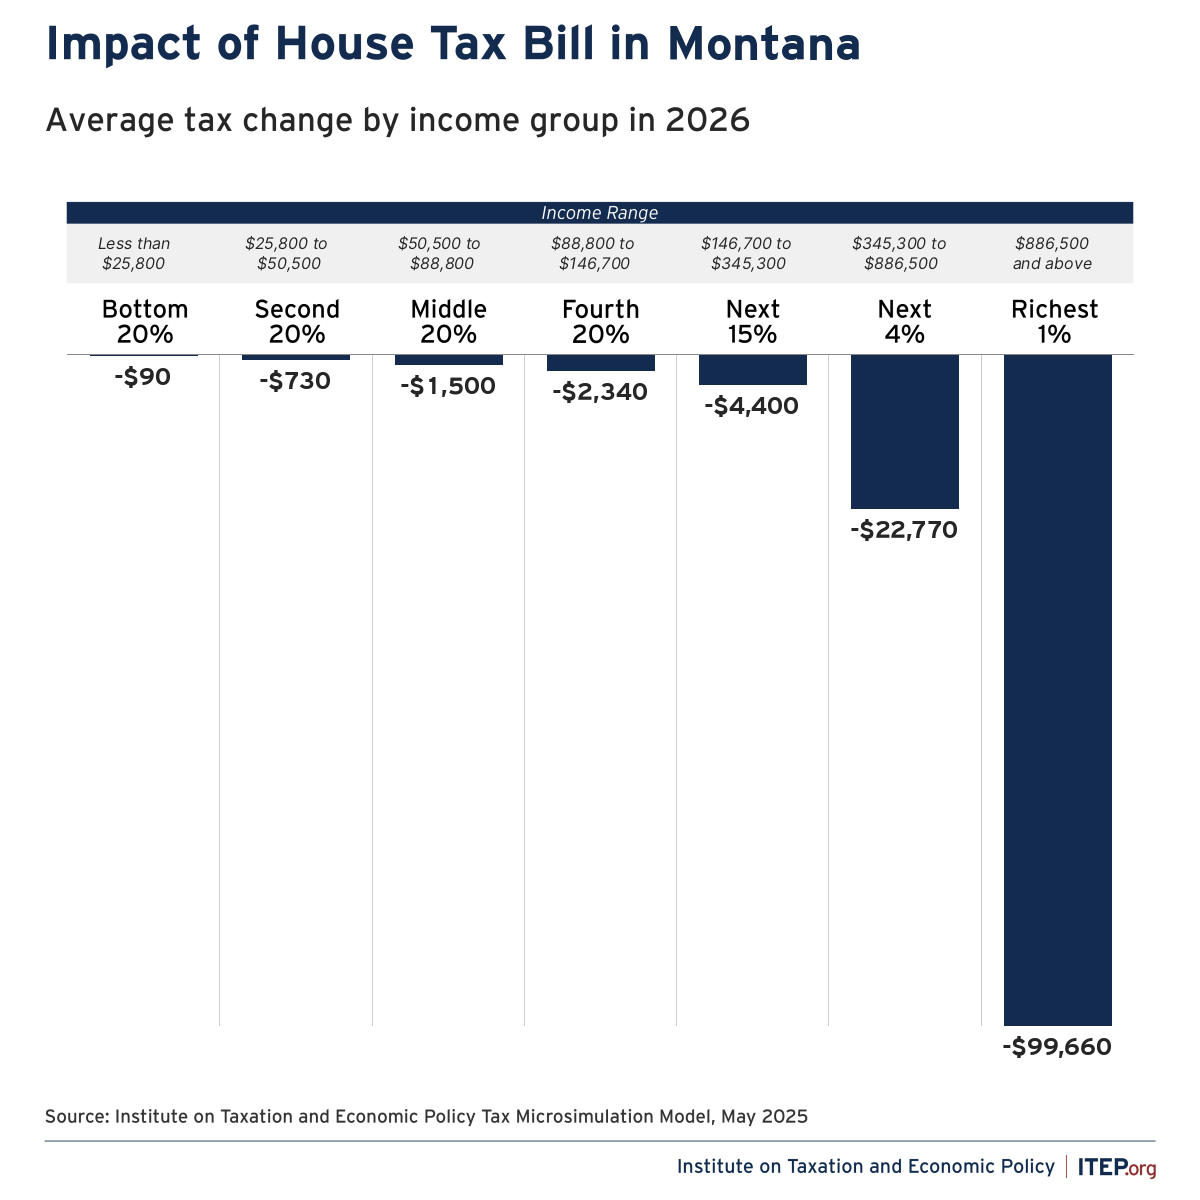
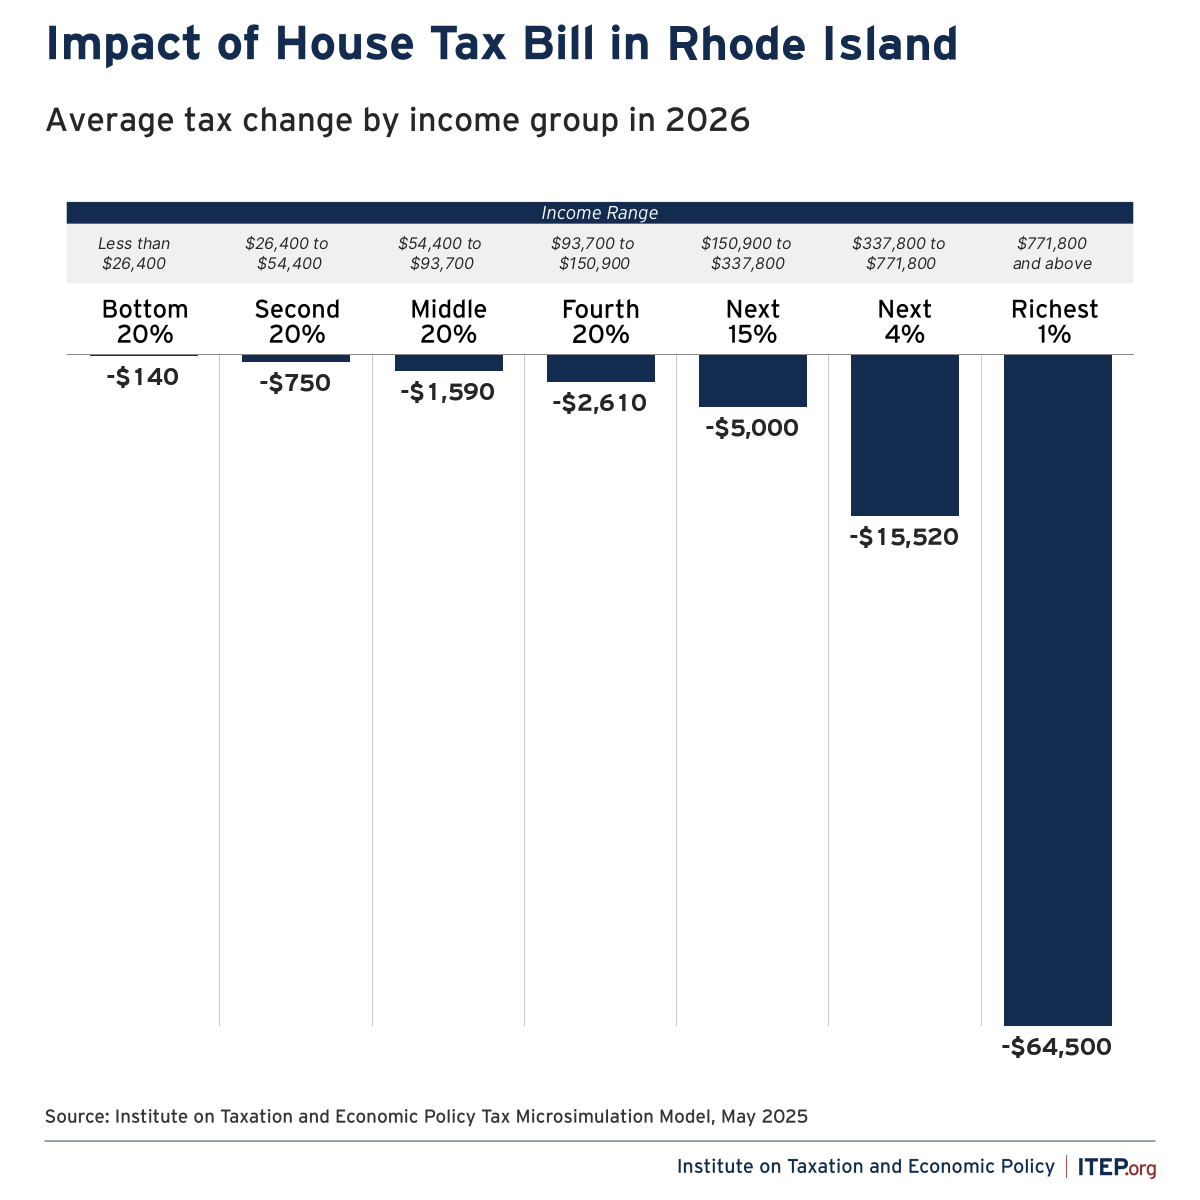
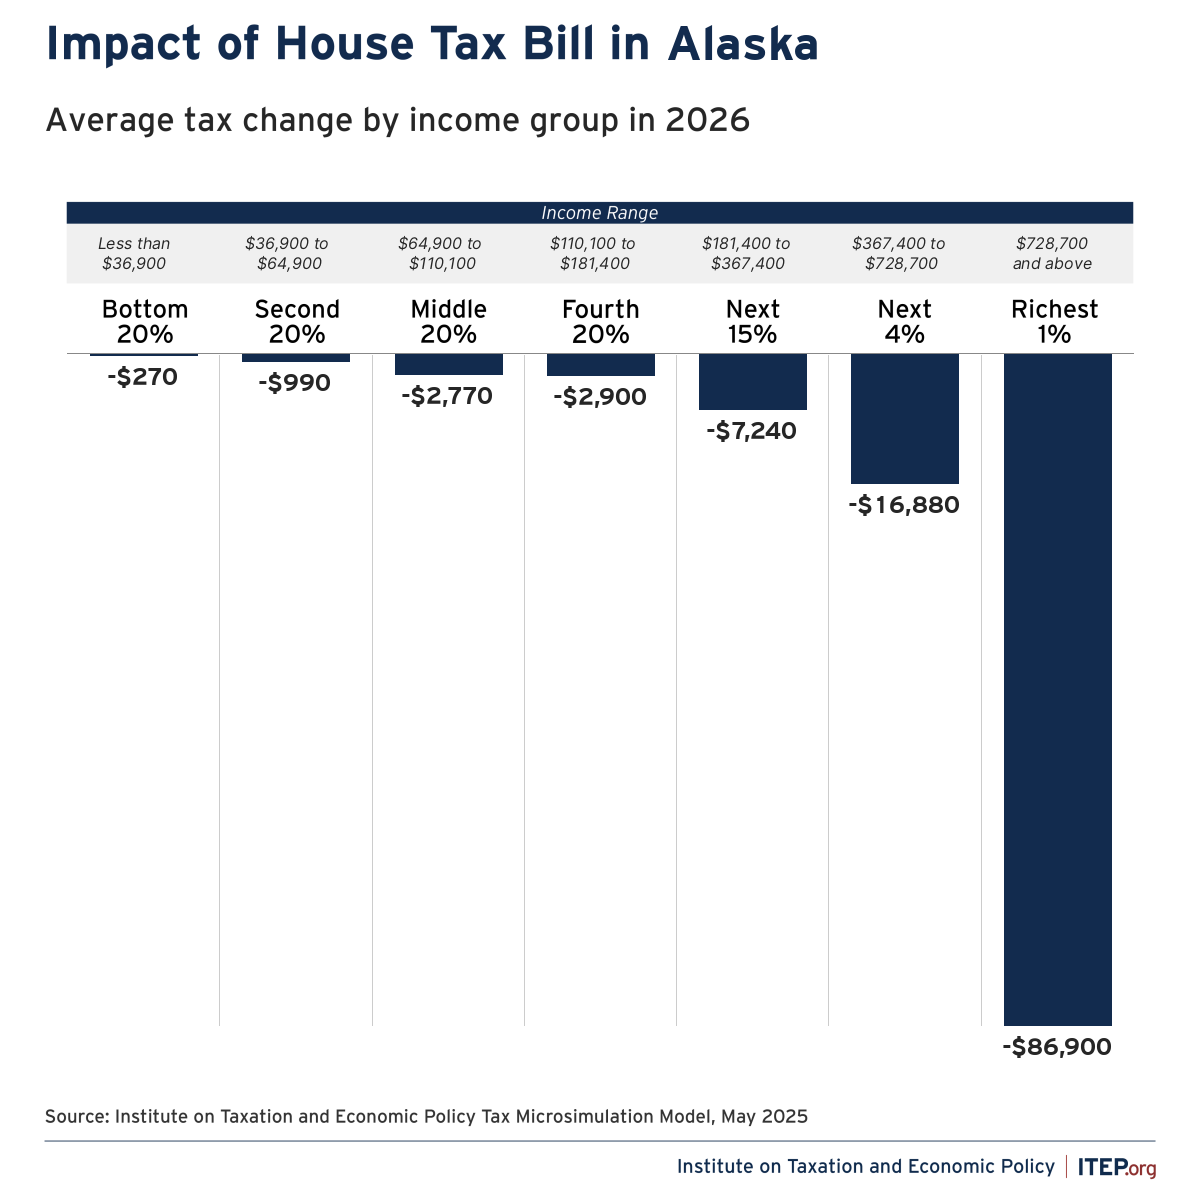
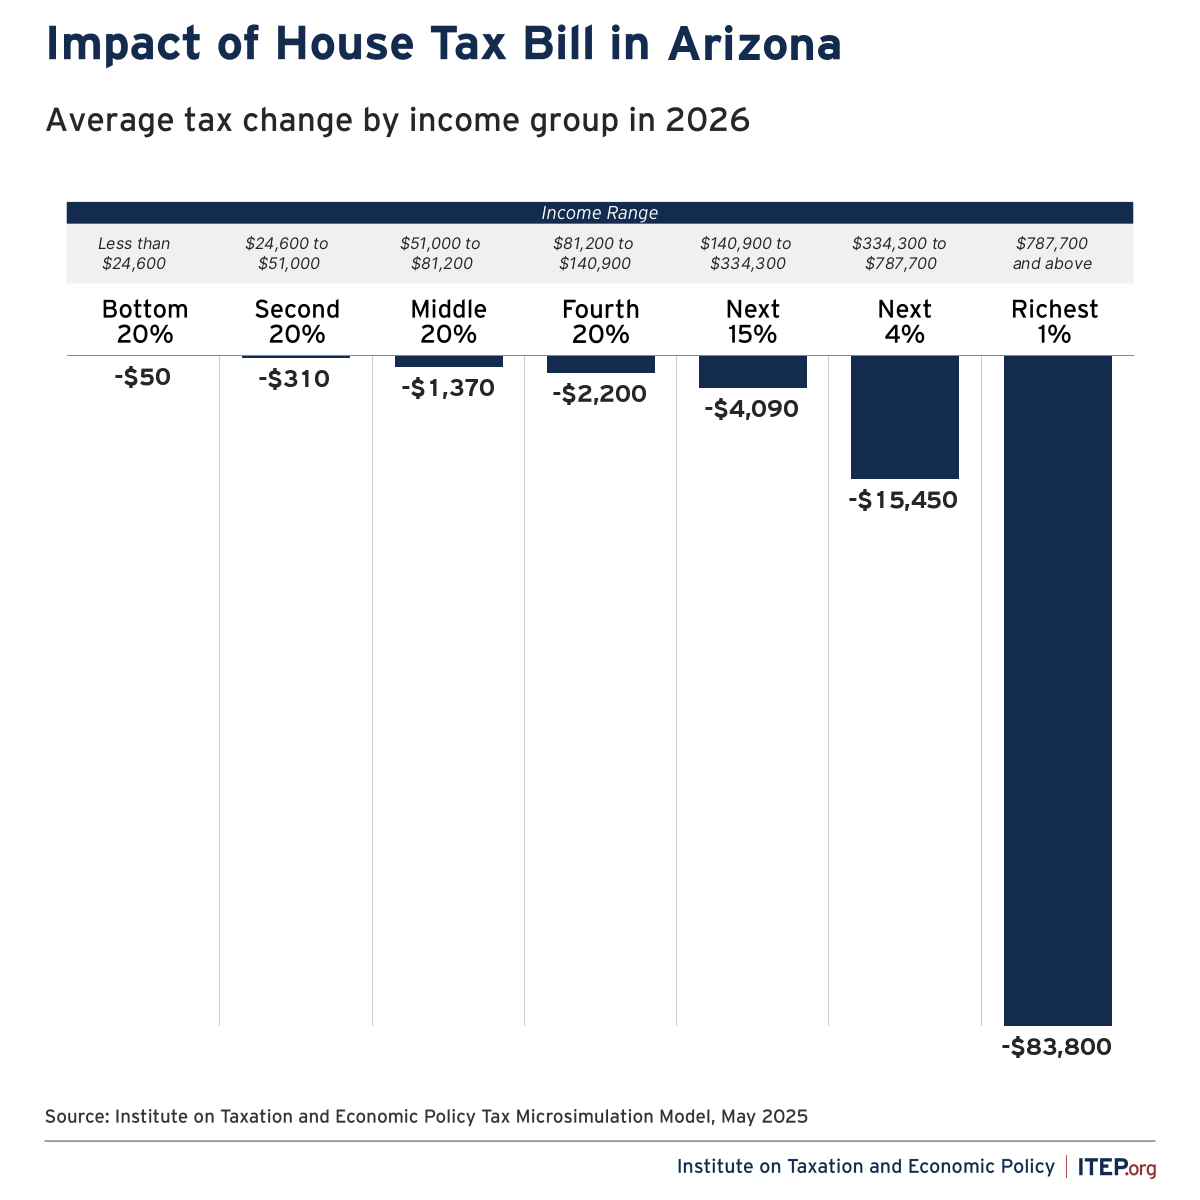
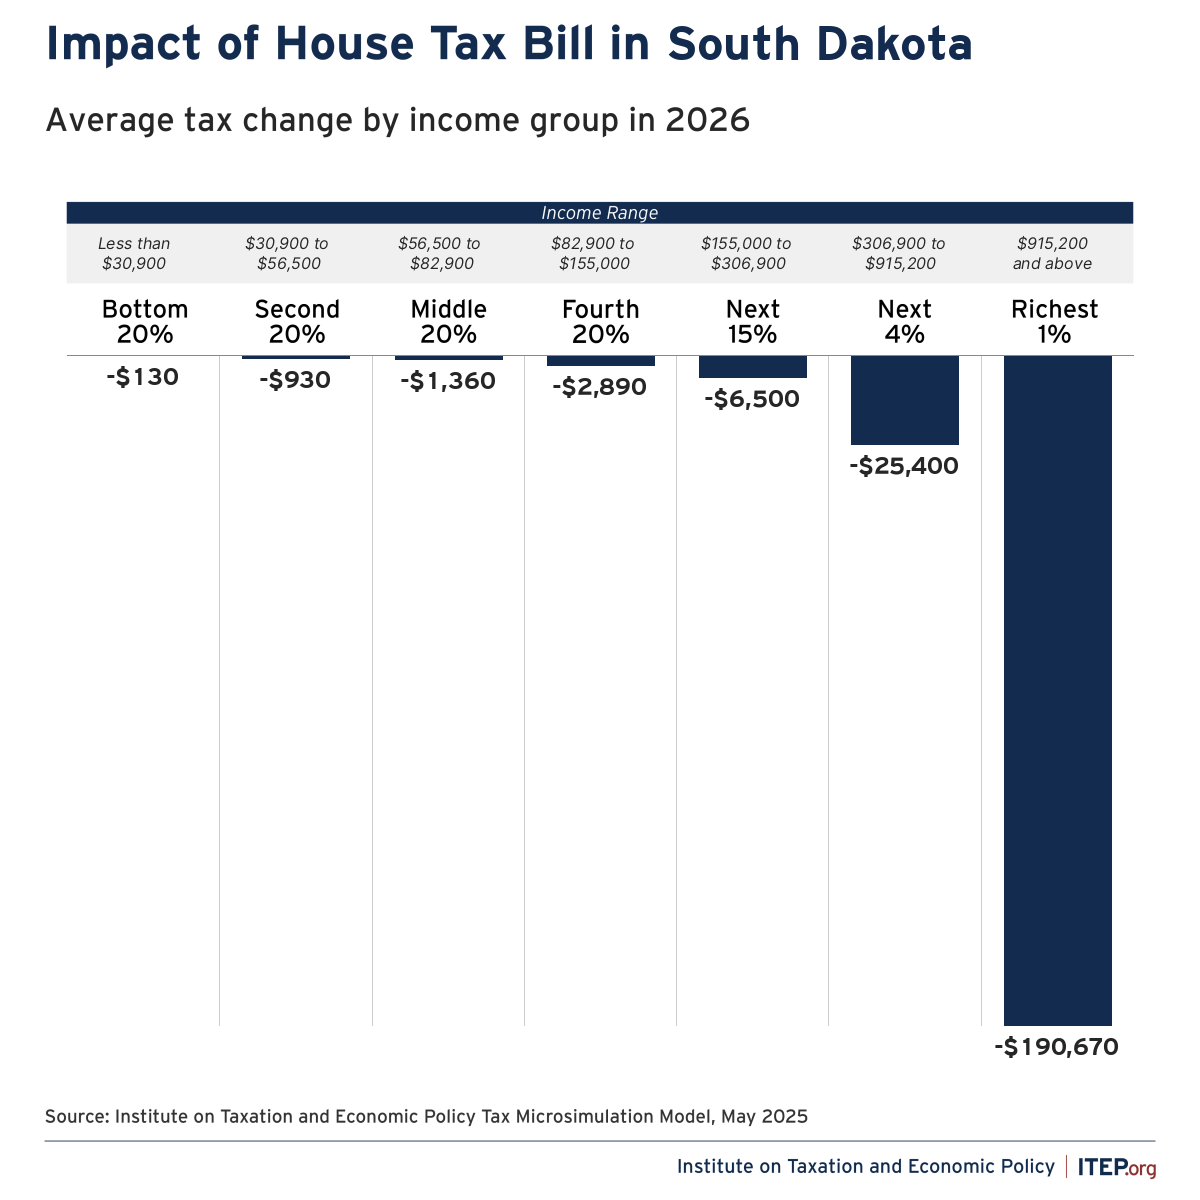
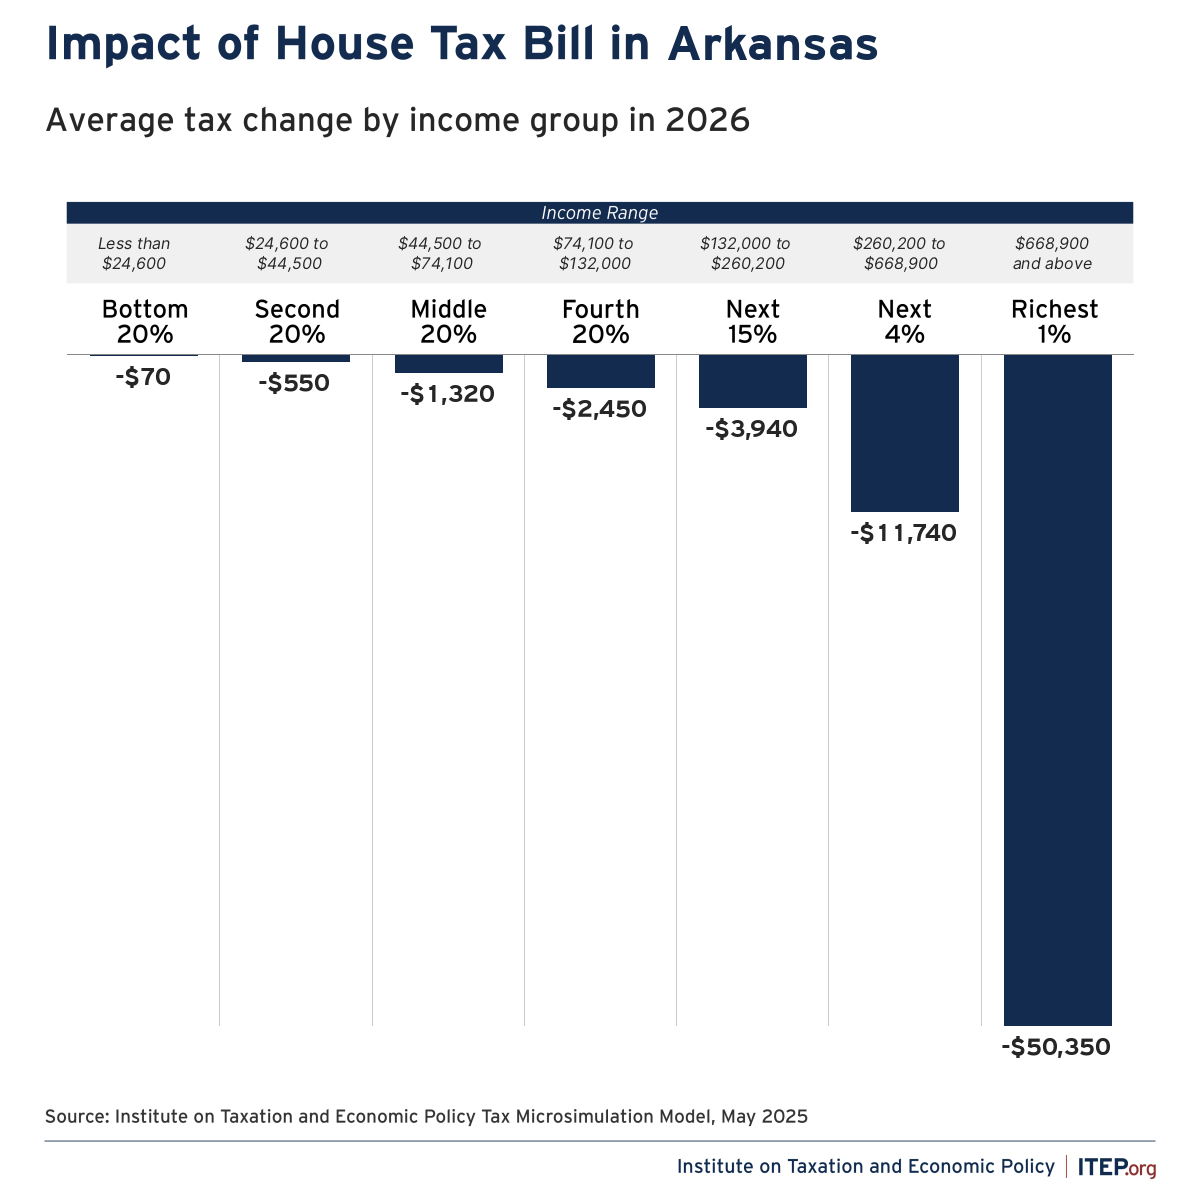
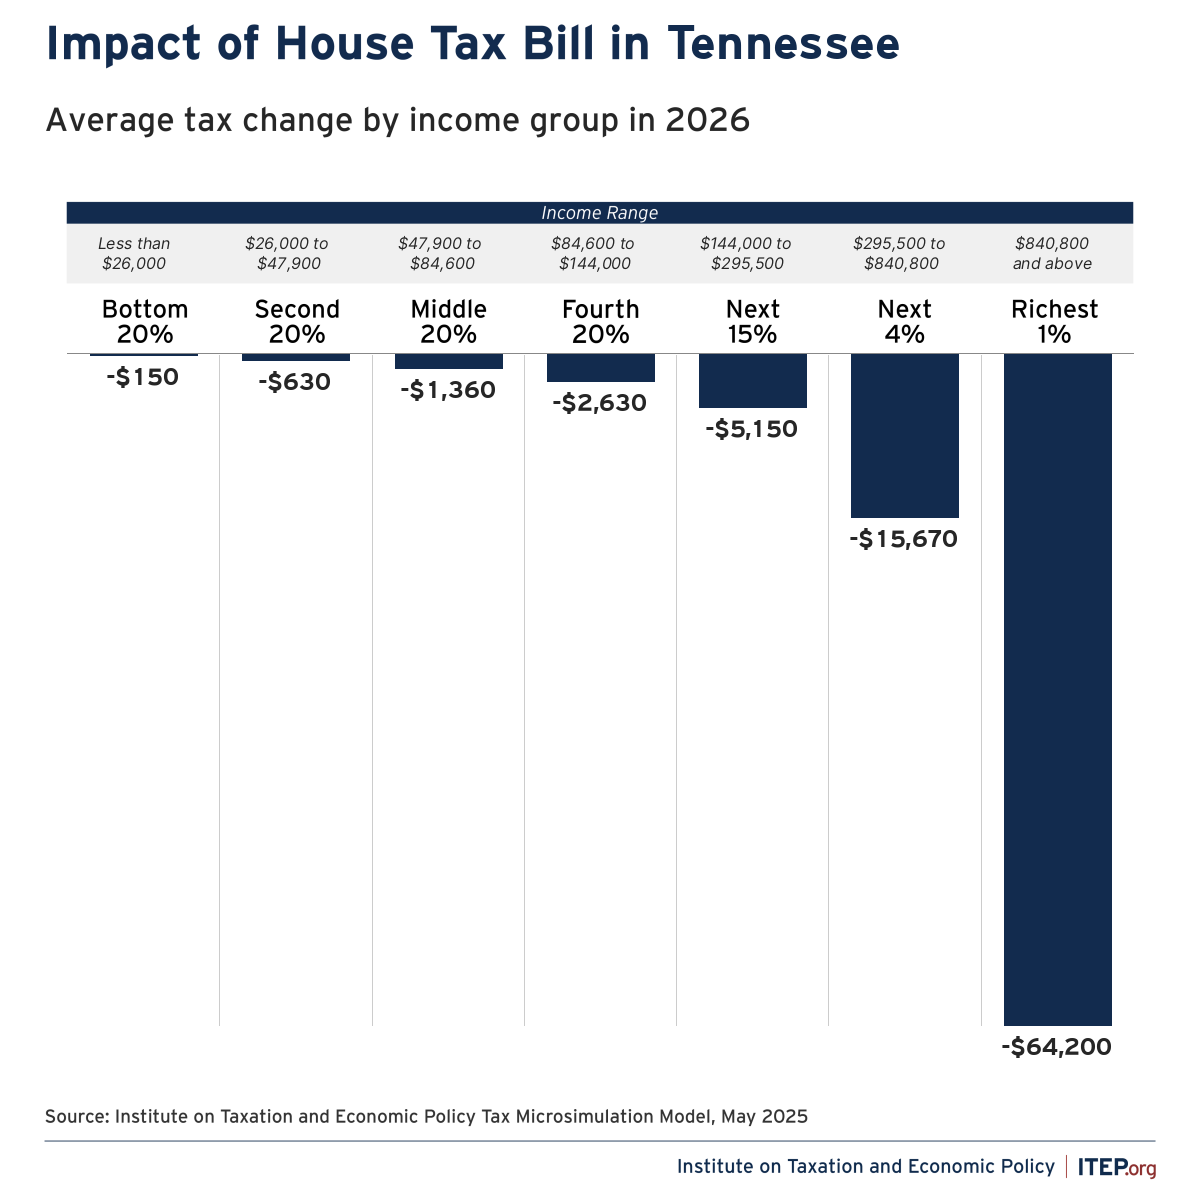
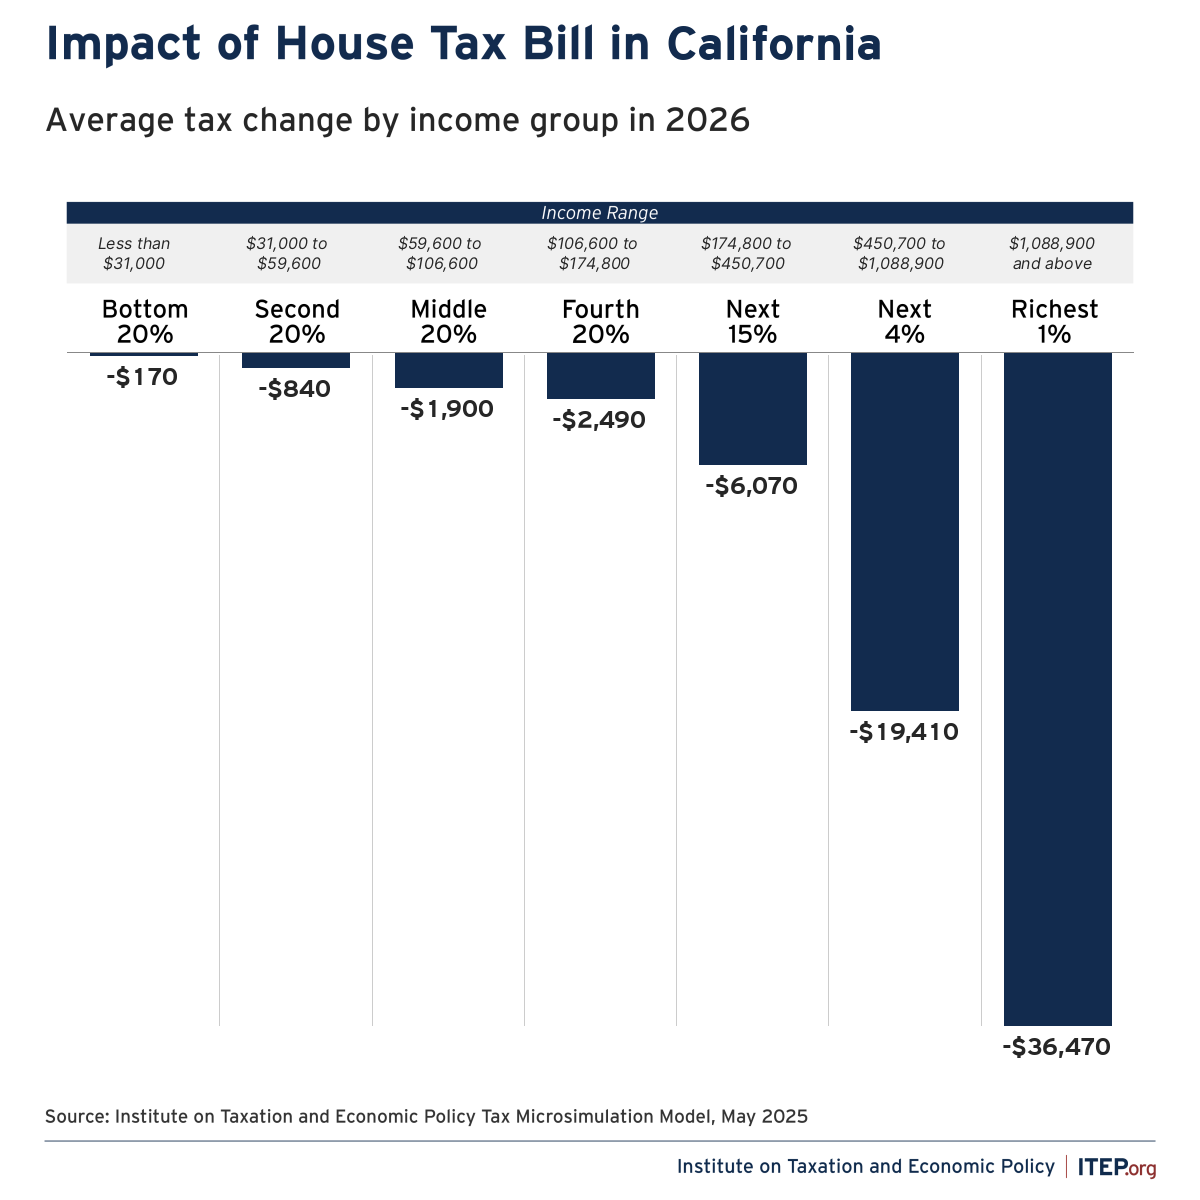
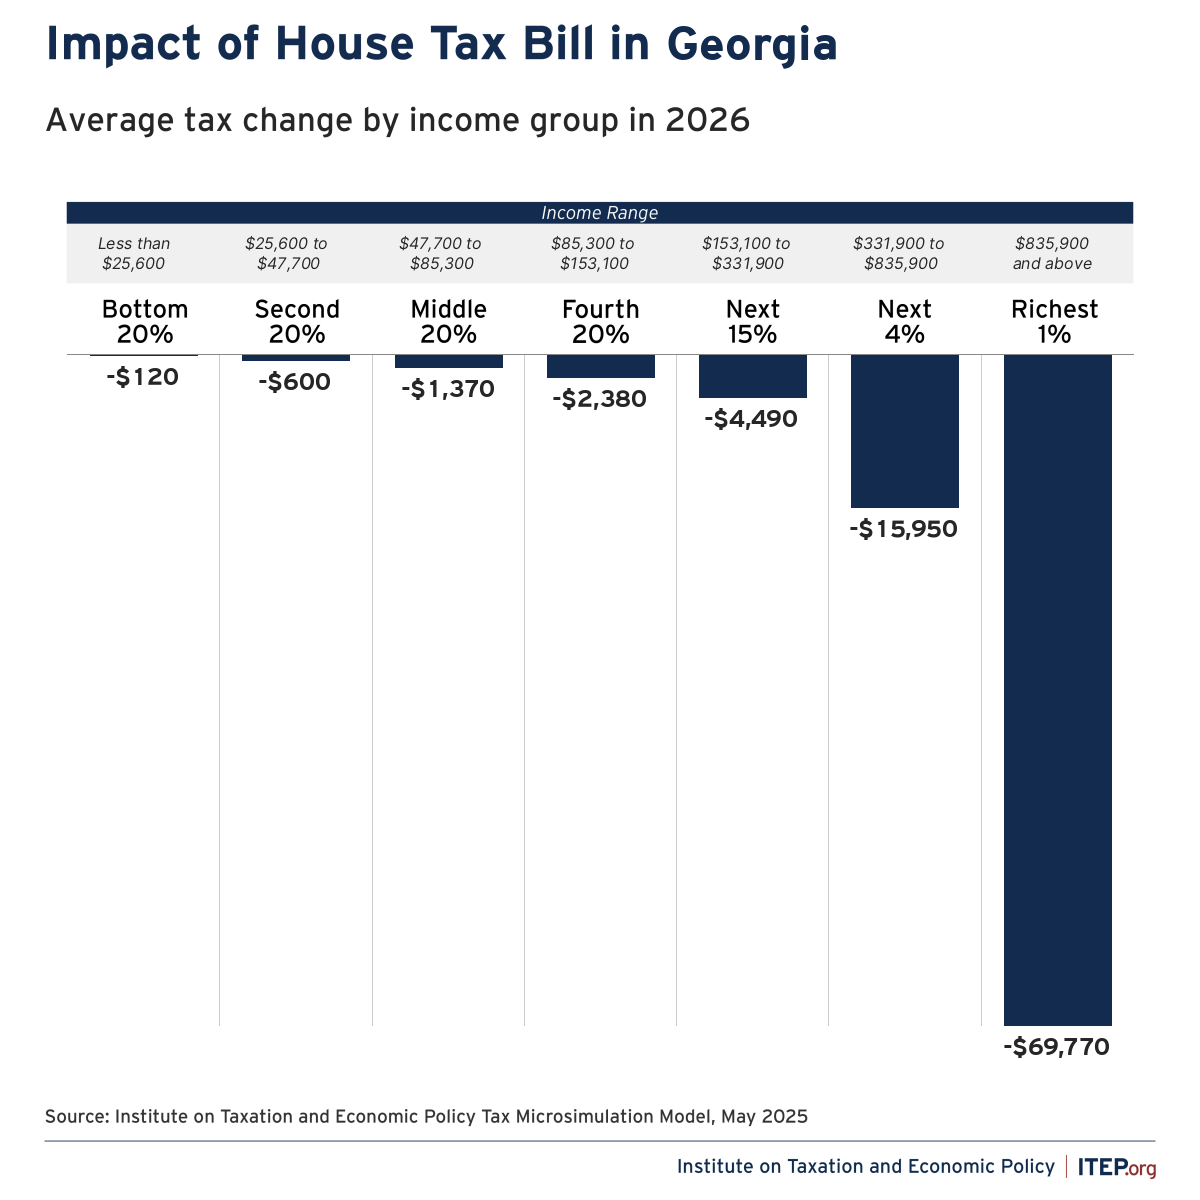
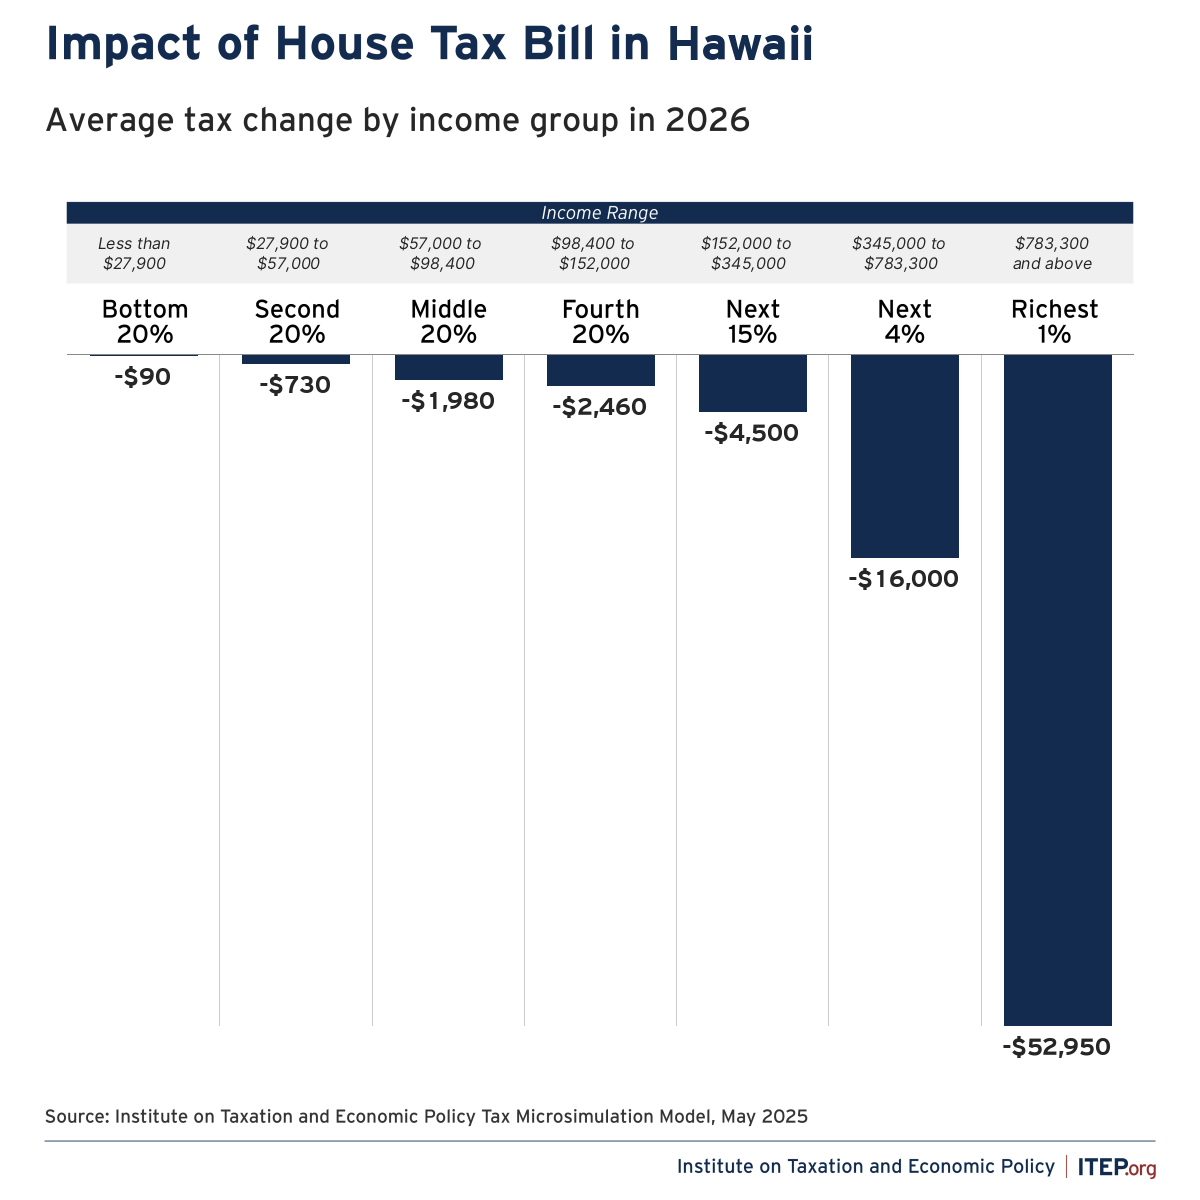
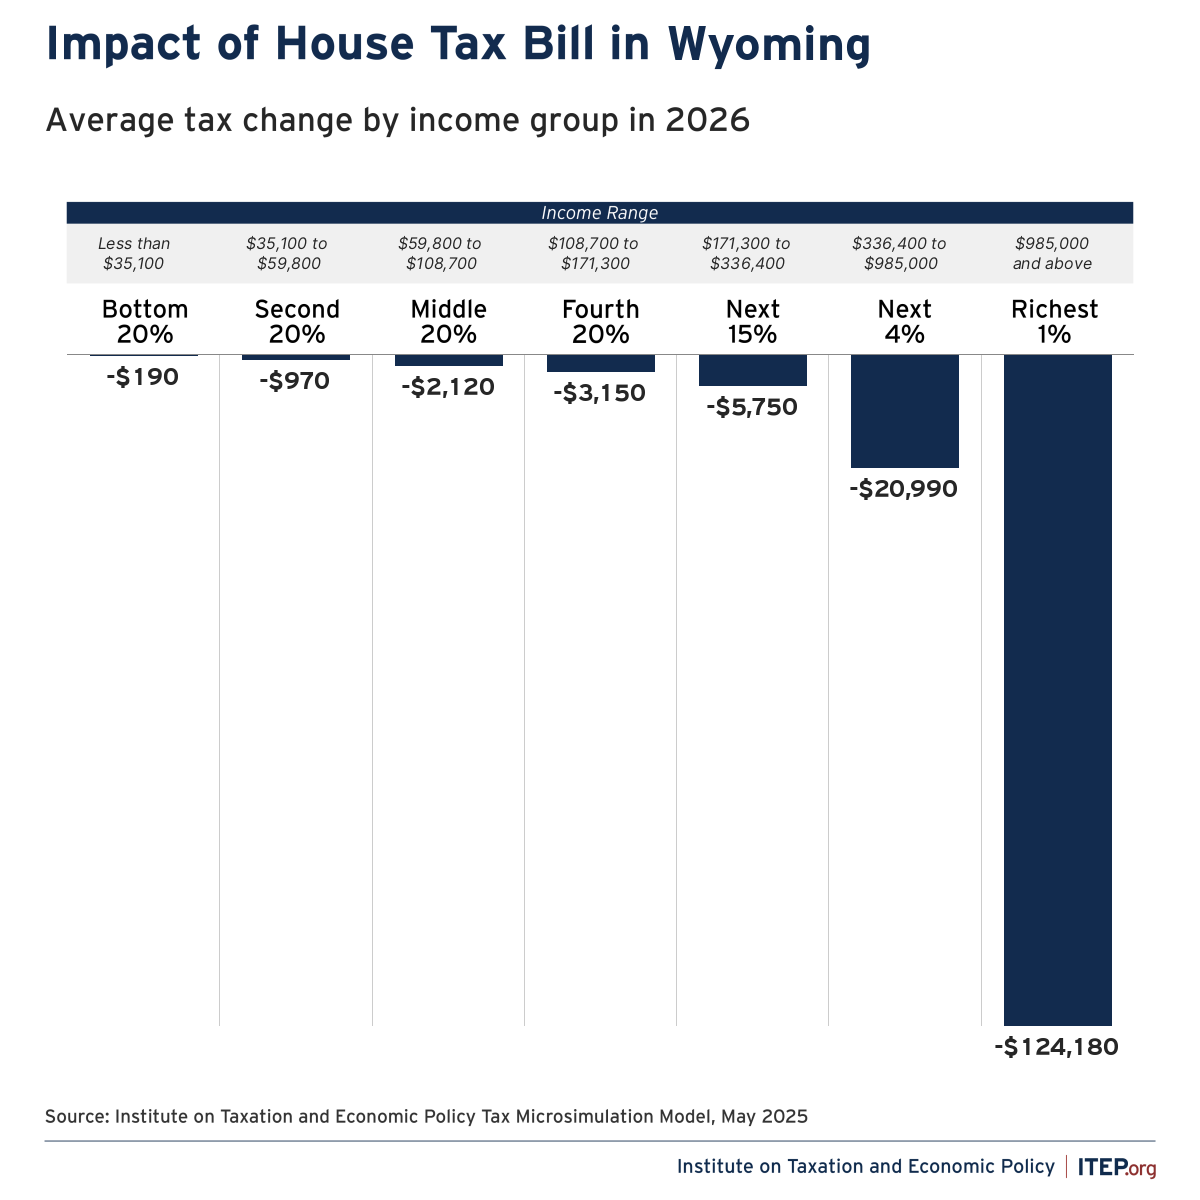
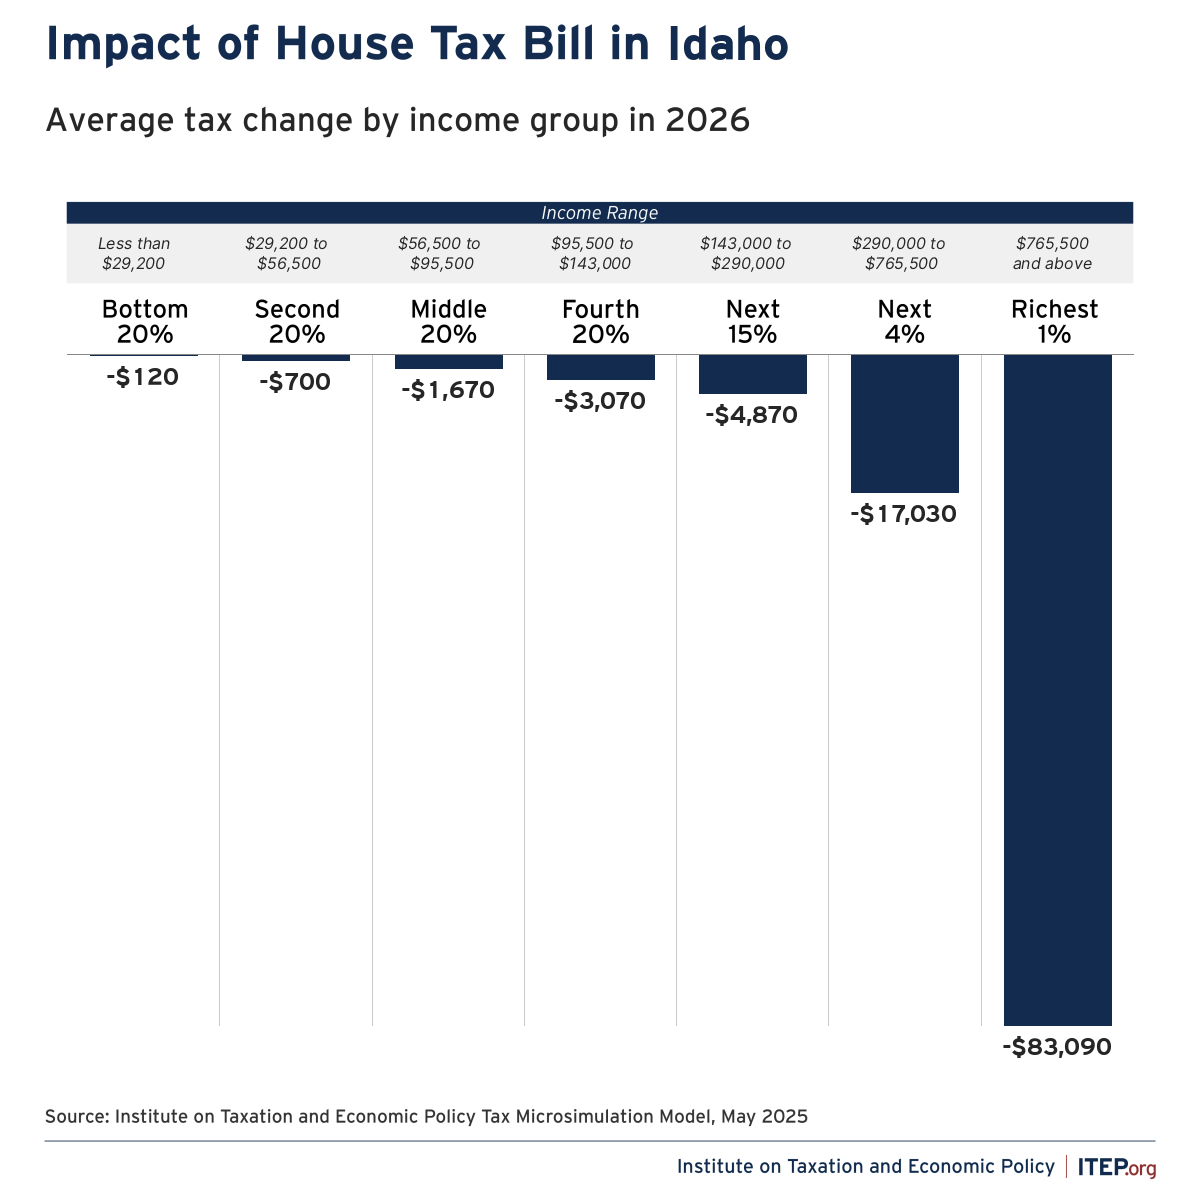
- High-income people in states with less robust tax systems overall do the best because they are not much affected by the bill’s cap on deductions for state and local taxes, which is similar but not identical to the one in the original Trump tax law. As illustrated in Figure 6, the states where the richest 1 percent of residents receive the largest average net tax cuts would mostly be states that have particularly unfair tax systems because they have no personal income tax.
These figures do not include other potential costs to families in the bill, such as deep cuts to Medicaid and food assistance. Because these programs generally benefit low-income and working-class families, adding them to the analysis would likely reveal an even less favorable result for these groups.
FIGURE 1
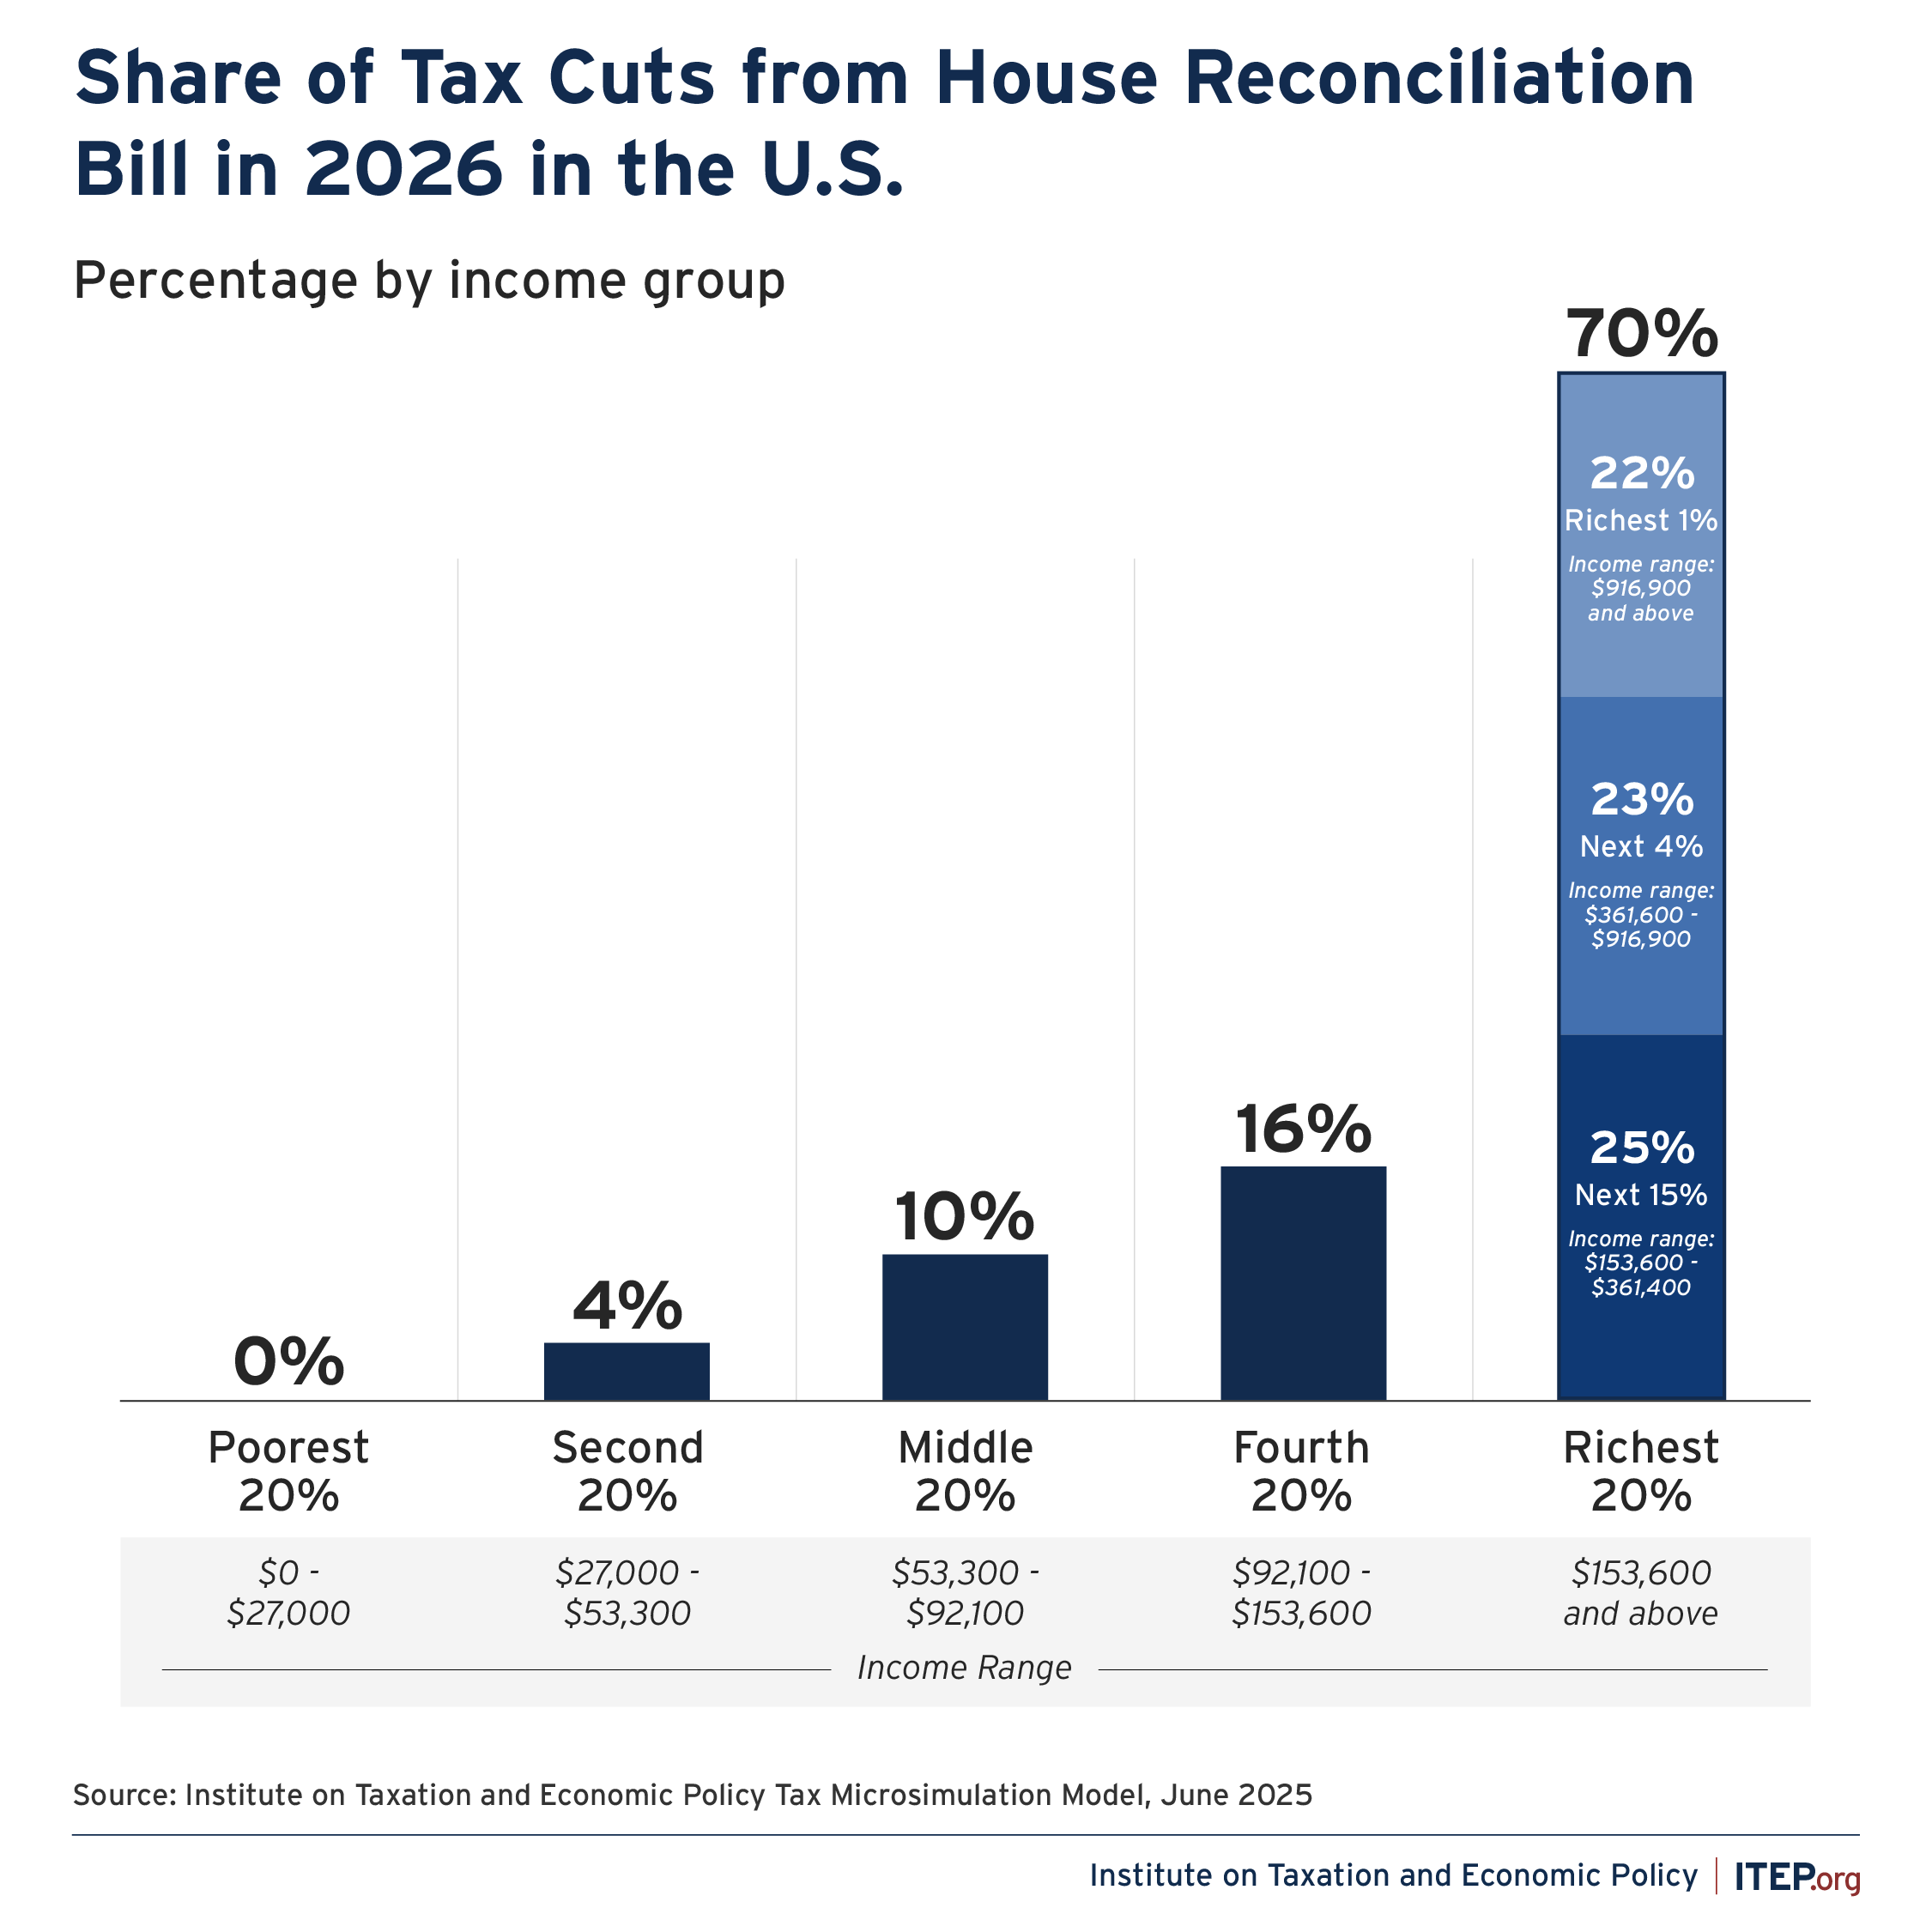
FIGURE 2
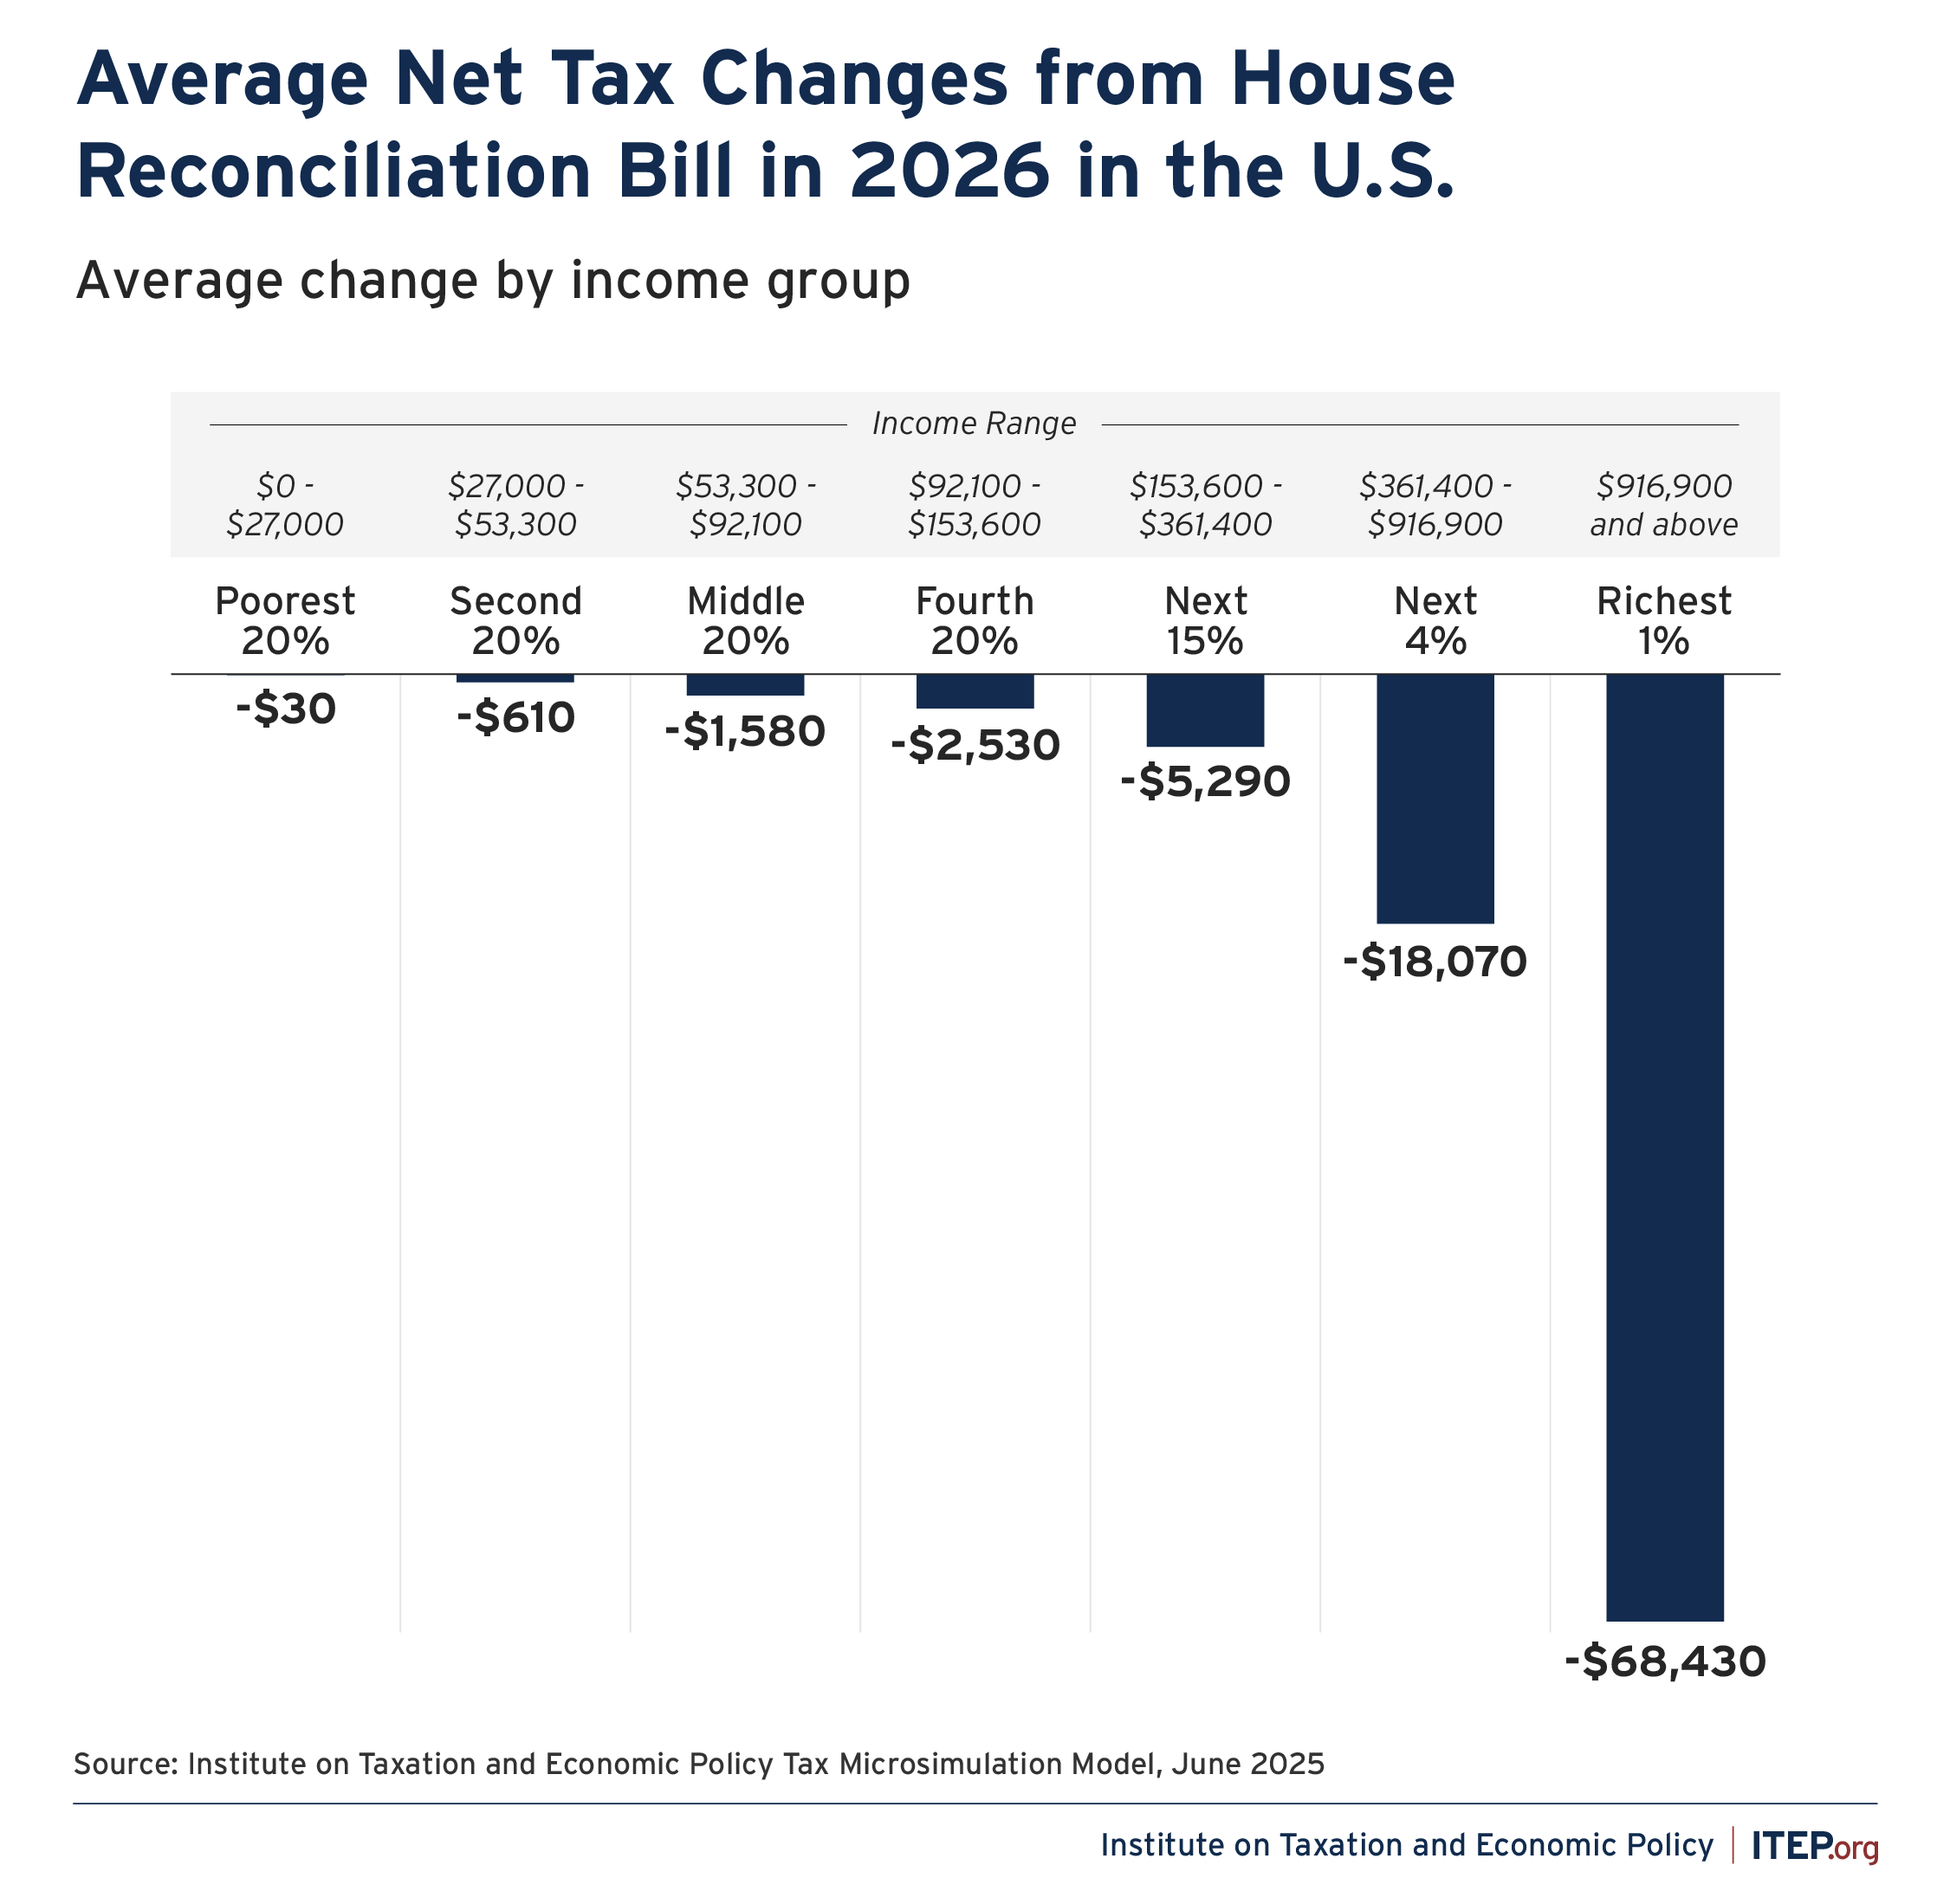
FIGURE 3
FIGURE 4
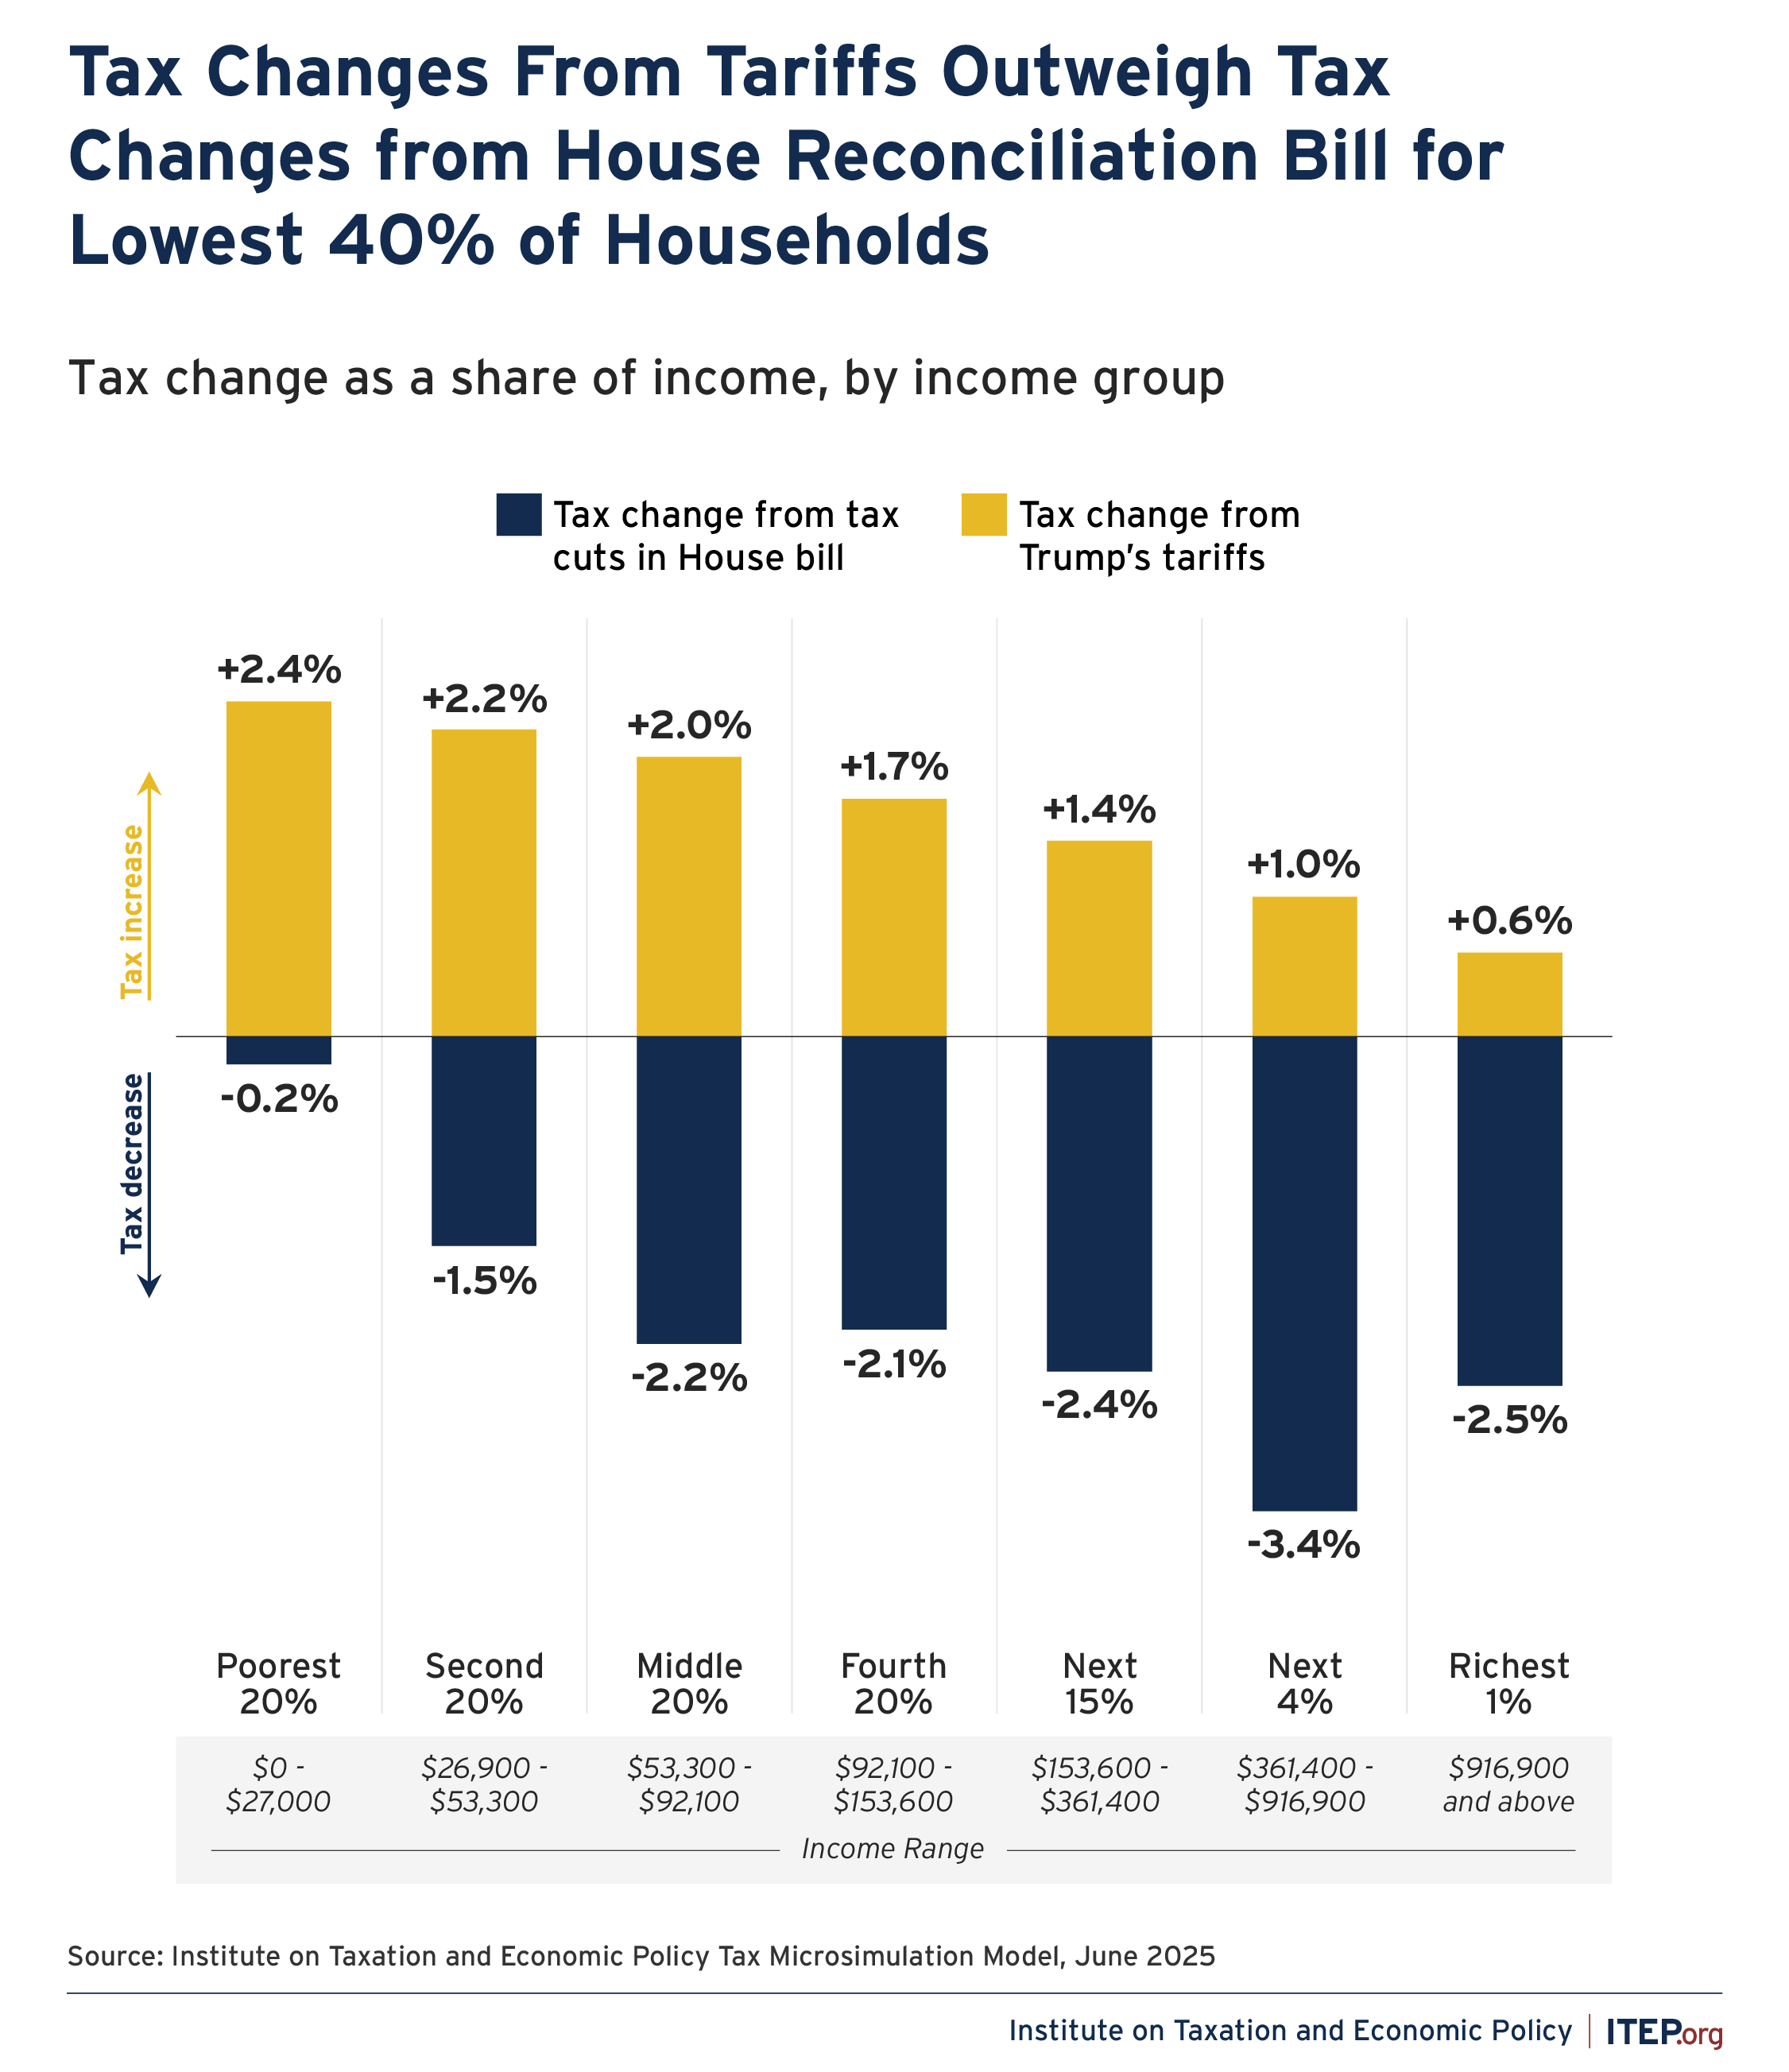
FIGURE 5
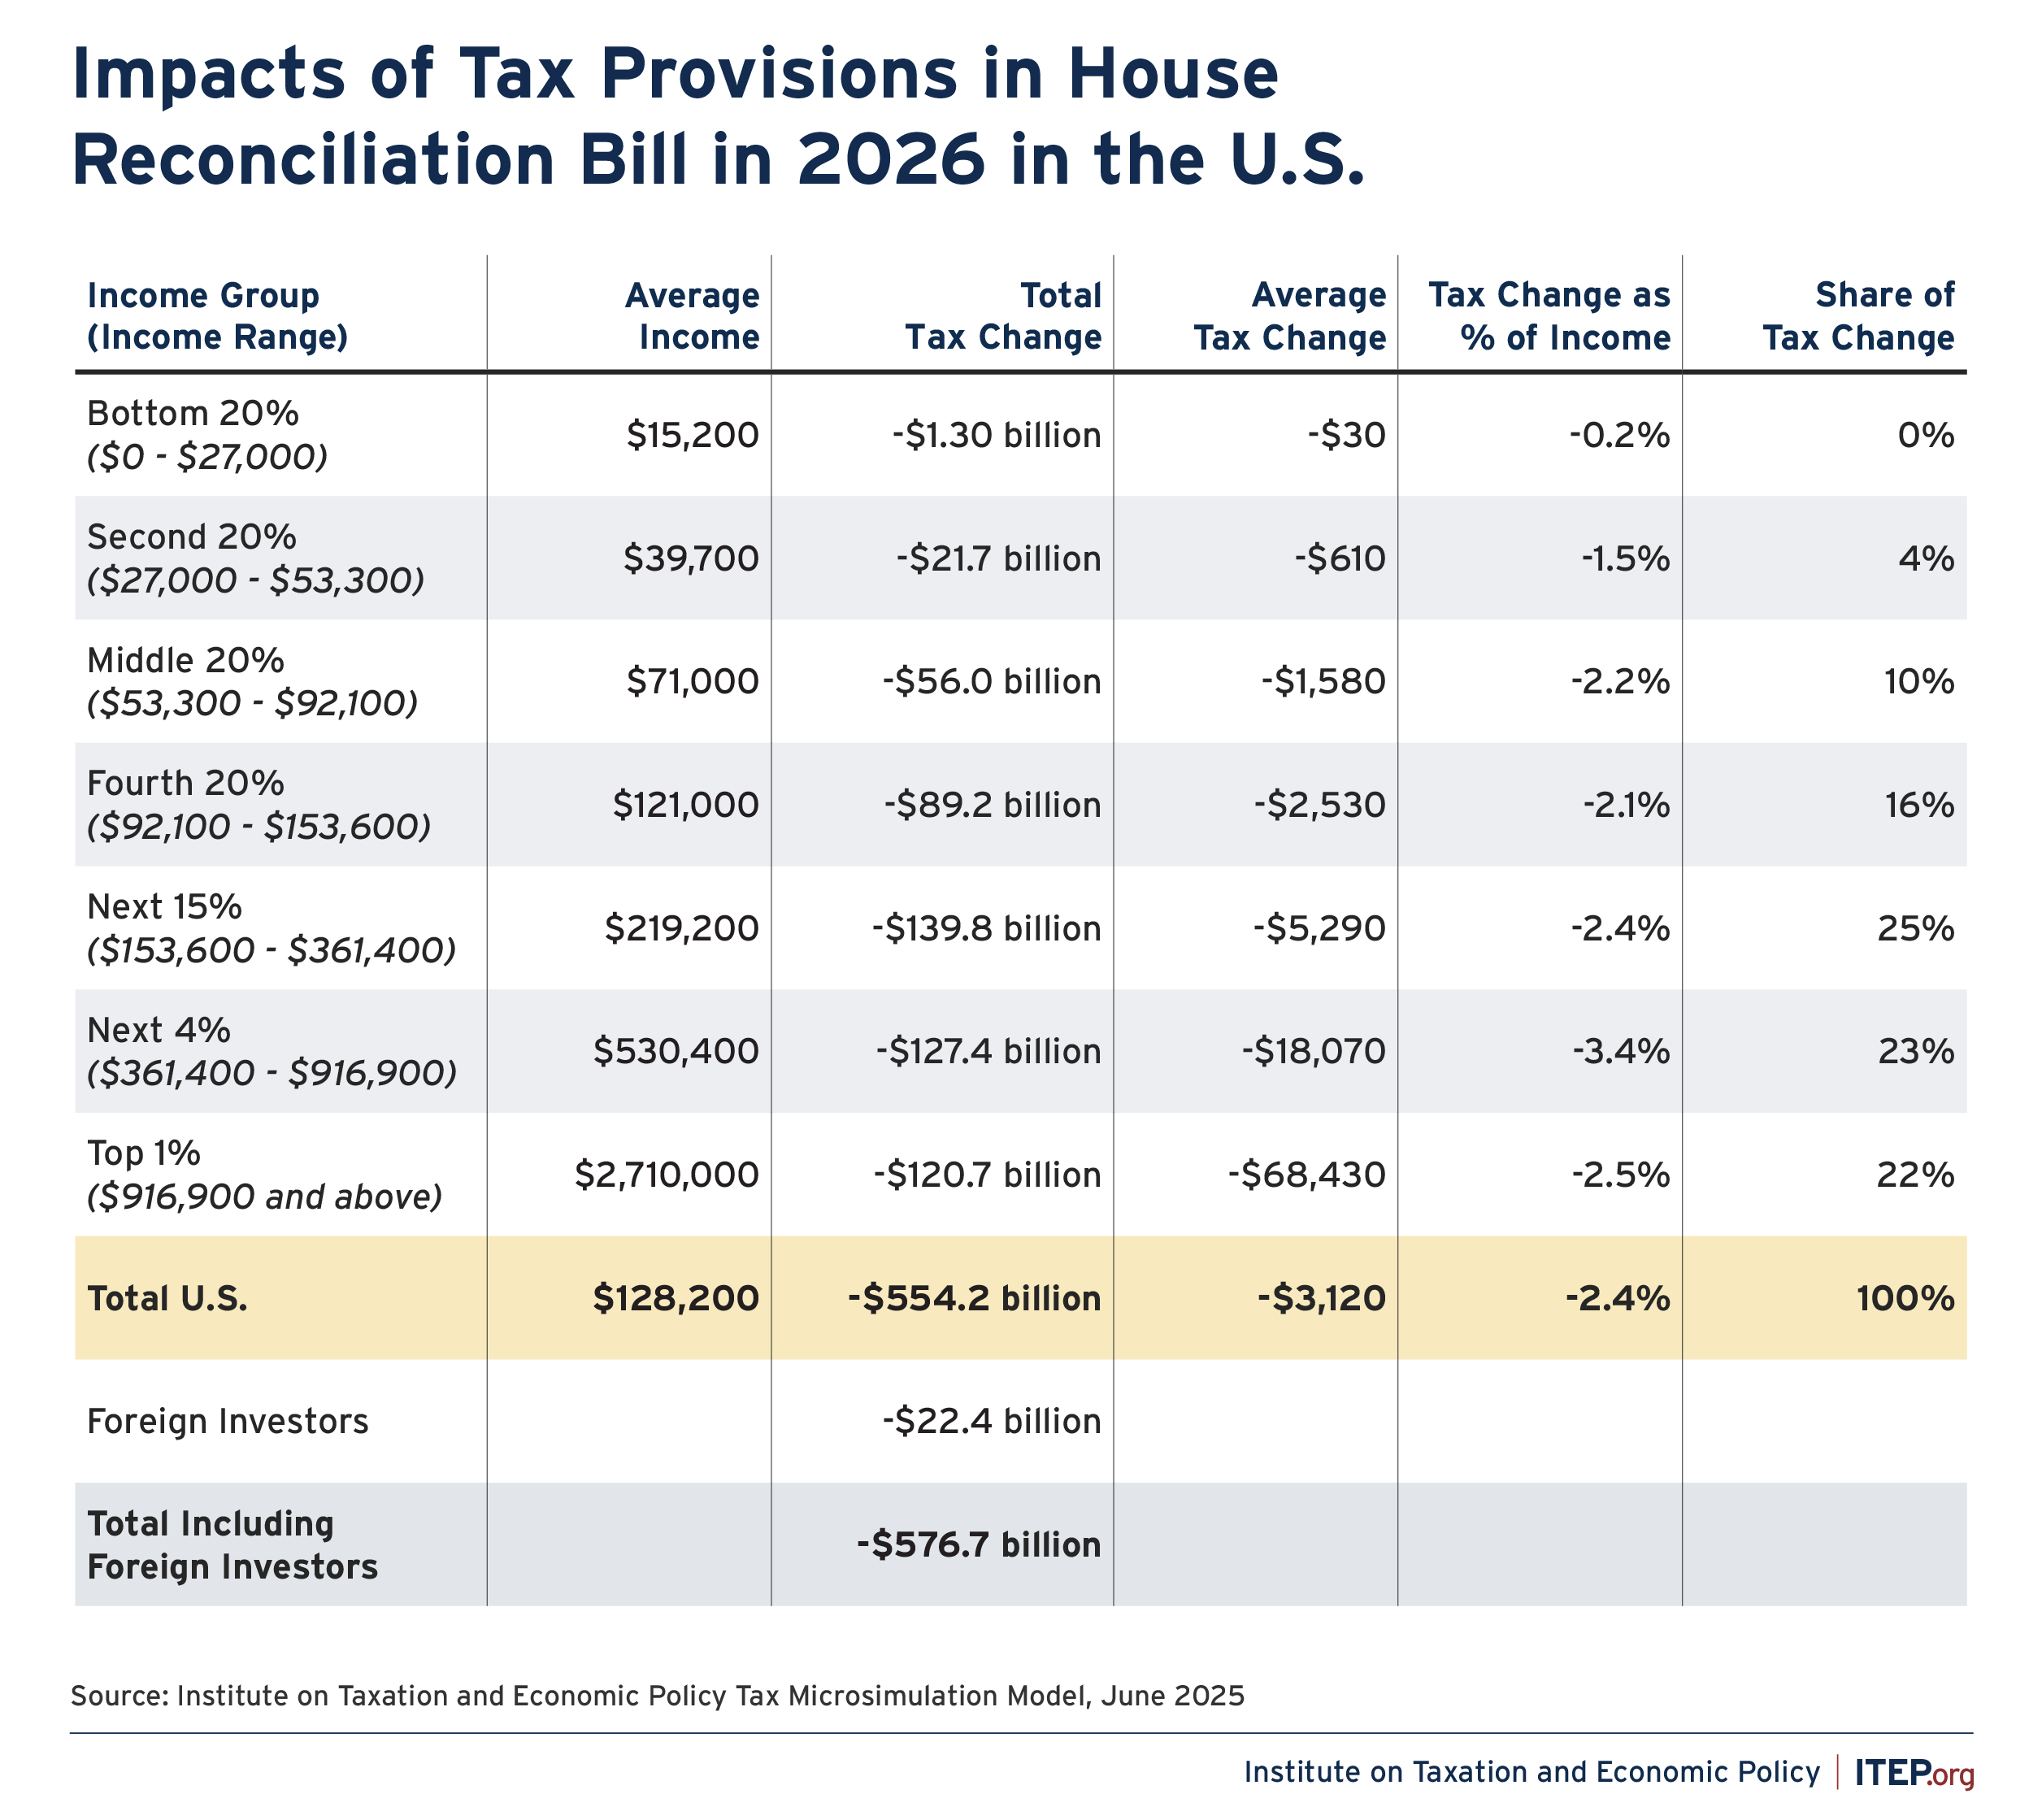
FIGURE 6
Three categories of tax provisions in the bill provide the biggest tax cuts to the richest 1 percent. These are the changes in tax rates and brackets, the pass-through deduction (section 199A), and the collection of business tax changes (which affect corporations and also other businesses).
Each of these three categories cuts taxes for the top 1% by around $30,000 on average next year. The AMT and estate tax provisions provide more for the rich on top of that.
Provisions changing itemized deductions (most importantly the cap on itemized deductions for state and local taxes, or SALT) claw back an average of $37,000 of the tax cuts for the richest 1 percent. The bill’s SALT cap, which is similar to but not identical to the SALT cap in the 2017 law, serves as a very partial limit on tax cuts for the richest Americans.
FIGURE 7

FIGURE 8
Revenue Impact of Tax Provisions Included in this Analysis of House Reconciliation Bill in 2026
| Provisions | Revenue Impact |
|---|---|
| Extending and Modifying TCJA Provisions Expiring End of 2025 and Related Changes | |
| Rates and Brackets | —$205 billion |
| Standard Deduction | —$120 billion |
| Personal Exemptions | +$145 billion |
| Child Tax Credit | —$100 billion |
| Pass-Through Deduction | —$89 billion |
| Alternative Minimum Tax | —$149 billion |
| Itemized Deductions | +$111 billion |
| Estate Tax | —$20 billion |
| Recapture Benefits in Lower Brackets | $0 |
| Total TCJA Provisions Expiring End of 2025 | —$427 billion |
| New Provisions Proposed as Middle-Class Tax Cuts | |
| Deduction for Tips | —$10 billion |
| Deduction for Overtime Pay | —$37 billion |
| Enhanced Deduction for Seniors | —$13 billion |
| Exclusion for Car Loan Interest | —$10 billion |
| Credit for Funding Private School Vouchers | —$5 billion |
| Total New Provisions Proposed as Middle-Class Tax Cuts | —$75 billion |
| Business Tax Breaks (excluding pass-through deduction in TCJA) | |
| Reinstate bonus depreciation | —$66 billion |
| Reinstate research expensing | —$30 billion |
| Reinstate more generous limits on deductions for interest | —$6 billion |
| Reinstate more generous versions of FDII and GILTI | —$14 billion |
| Reinstate more generous version of BEAT | —$3 billion |
| Amendment adjustment to FDII/GILTI/BEAT | +$1 billion |
| Special depreciation allowance for qualified production property | —$35 billion |
| Section 179 small business expensing expanded | —$4 billion |
| Increases the gross receipts threshold ($25 to $80 million) for manufacturing corporations using cash accounting | —$3 billion |
| Extension and modification of clean fuel production credit | —$2 billion |
| Total Business Tax Breaks | —$162 billion |
| Other Tax Provisions | |
| Repeal and phase out green tax provisions | +$42 billion |
| Limits on ACA credits | +$13 billion |
| Strengthen limit on deductions for high compensation | +$1 billion |
| 1 percent floor on corporate charitable deductions | +$2 billion |
| Punish companies of countries implementing global minimum tax | +$29 billion |
| Total Other Tax Provisions | +$88 billion |
| TOTAL | —$576 billion |
|
ITEP.org
 |
|
State-by-State Data
Download national and state-by-state estimates
Methodological Note
The calculations contained in this brief examine the effects of the One Big Beautiful Bill Act (OBBBA) provisions that will be in effect in Tax Year 2026. The analysis includes approximately 96 percent of the revenue-raising provisions and 98 percent of the revenue-losing provisions, measured by revenue impact, that will be in effect that year. The minor provisions excluded from the analysis are generally indirect taxes with an uncertain distributional impact or are items for which reliable distributional data are otherwise not publicly available.
The analysis was conducted using the ITEP tax model. The ITEP model was constructed by pairing federal tax return data from the Internal Revenue Service (IRS) with observations from the U.S. Census Bureau’s American Community Survey (ACS) to create a valid representation of the U.S. population, including federal filers and nonfilers. These data are further supplemented with data from a wide range of other sources such as Bureau of Labor Statistics’ Consumer Expenditure Survey and the Federal Reserve’s Survey of Consumer Finances.
This analysis examines the bill language as passed by the House on May 22 and relies in part on the revenue estimates contained in Joint Committee on Taxation publication JCX-22-25R to calibrate certain aspects of the modeling. The data contained in this brief are subject to revision as we continue to improve our approach to modeling its numerous provisions.


