State Reports
Pennsylvania: Who Pays? 6th Edition
October 17, 2018 • By ITEP Staff
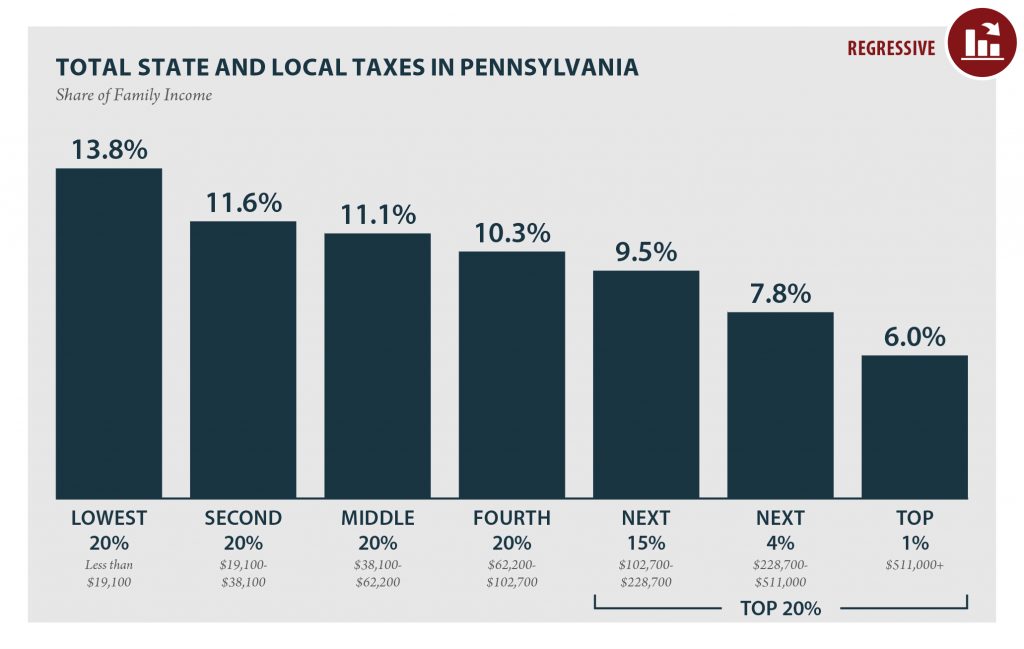
PENNSYLVANIA Read as PDF PENNSYLVANIA STATE AND LOCAL TAXES Taxes as Share of Family Income Top 20% Income Group Lowest 20% Second 20% Middle 20% Fourth 20% Next 15% Next 4% Top 1% Income Range Less than $19,100 $19,100 to $38,100 $38,100 to $62,200 $62,200 to $102,700 $102,700 to $228,700 $228,700 to $511,000 over $511,000 […]
Arkansas: Who Pays? 6th Edition
October 17, 2018 • By ITEP Staff
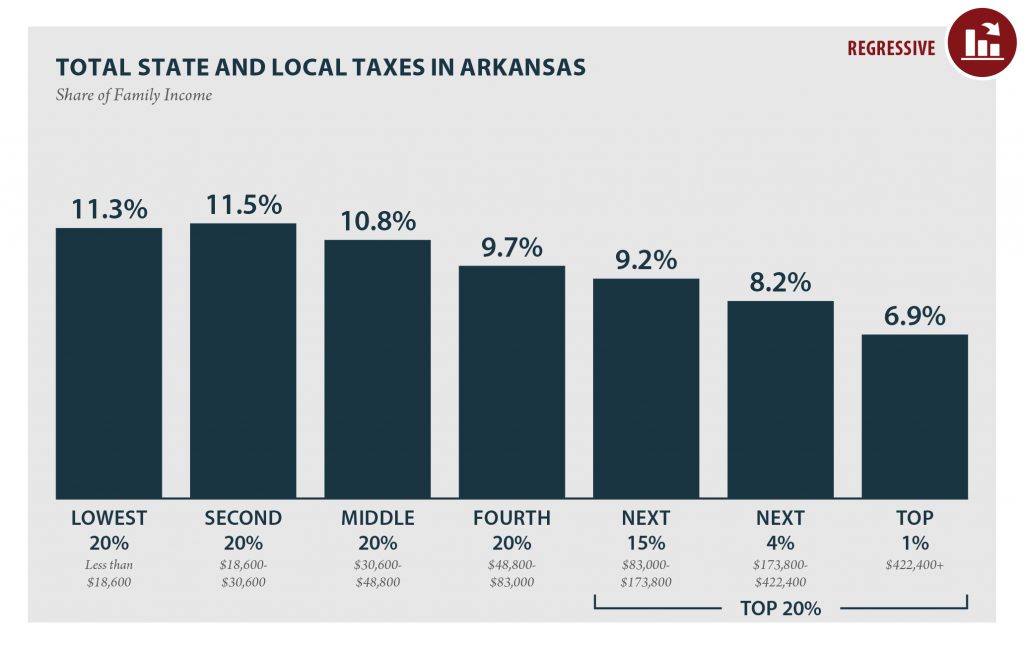
ARKANSAS Read as PDF ARKANSAS STATE AND LOCAL TAXES Taxes as Share of Family Income Top 20% Income Group Lowest 20% Second 20% Middle 20% Fourth 20% Next 15% Next 4% Top 1% Income Range Less than $18,600 $18,600 to $30,600 $30,600 to $48,800 $48,800 to $83,000 $83,000 to $173,800 $173,800 to $422,400 over $422,400 […]
Texas: Who Pays? 6th Edition
October 17, 2018 • By ITEP Staff
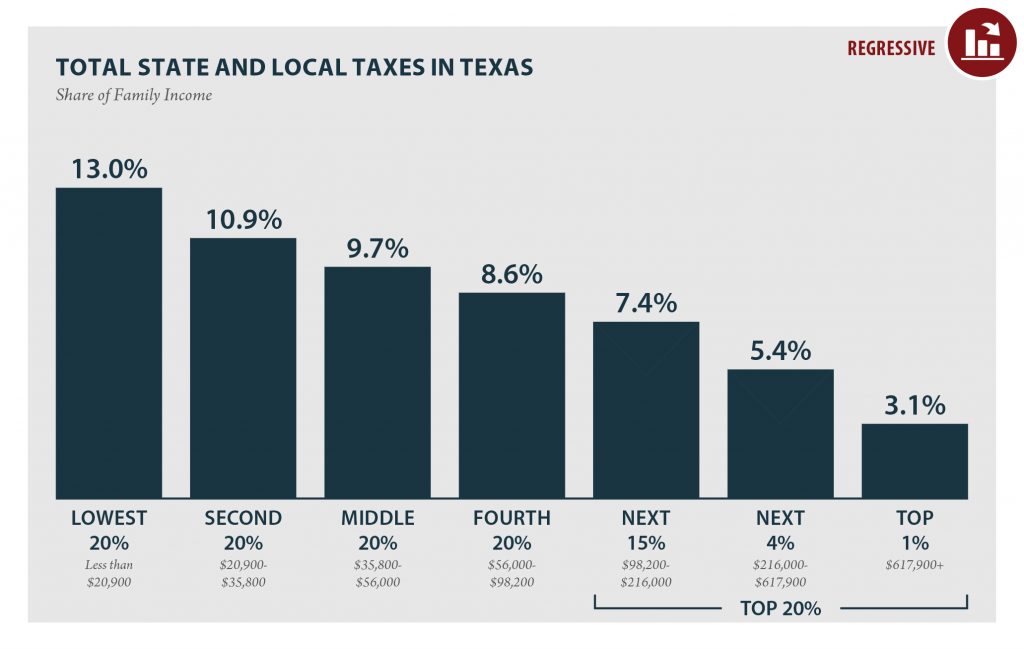
TEXAS Read as PDF TEXAS STATE AND LOCAL TAXES Taxes as Share of Family Income Top 20% Income Group Lowest 20% Second 20% Middle 20% Fourth 20% Next 15% Next 4% Top 1% Income Range Less than $20,900 $20,900 to $35,800 $35,800 to $56,000 $56,000 to $98,200 $98,200 to $216,000 $216,000 to $617,900 over $617,900 […]
New York: Who Pays? 6th Edition
October 17, 2018 • By ITEP Staff
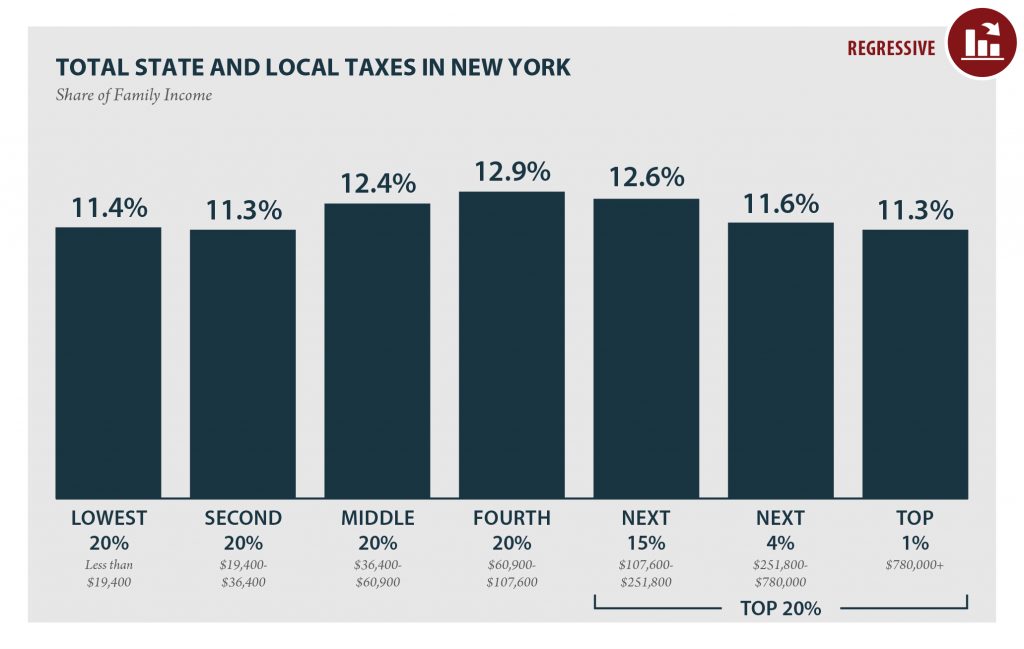
NEW YORK Read as PDF NEW YORK STATE AND LOCAL TAXES Taxes as Share of Family Income Top 20% Income Group Lowest 20% Second 20% Middle 20% Fourth 20% Next 15% Next 4% Top 1% Income Range Less than $19,400 $19,400 to $36,400 $36,400 to $60,900 $60,900 to $107,600 $107,600 to $251,800 $251,800 to $780,000 […]
Louisiana: Who Pays? 6th Edition
October 17, 2018 • By ITEP Staff
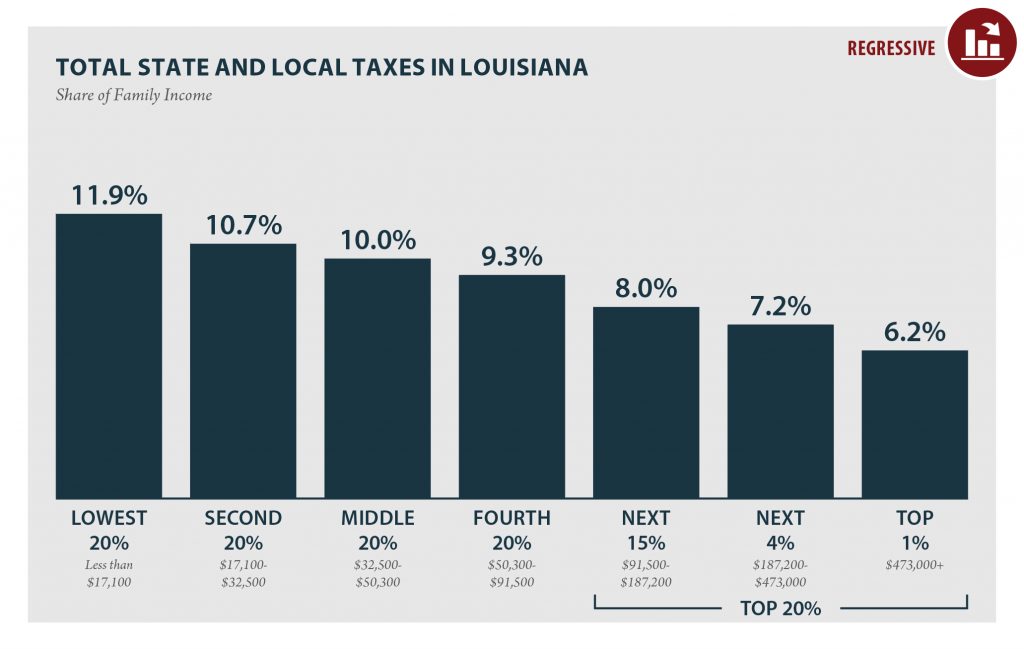
LOUISIANA Read as PDF LOUISIANA STATE AND LOCAL TAXES Taxes as Share of Family Income Top 20% Income Group Lowest 20% Second 20% Middle 20% Fourth 20% Next 15% Next 4% Top 1% Income Range Less than $17,100 $17,100 to $32,500 $32,500 to $50,300 $50,300 to $91,500 $91,500 to $187,200 $187,200 to $473,000 over $473,000 […]
Washington: Who Pays? 6th Edition
October 17, 2018 • By ITEP Staff
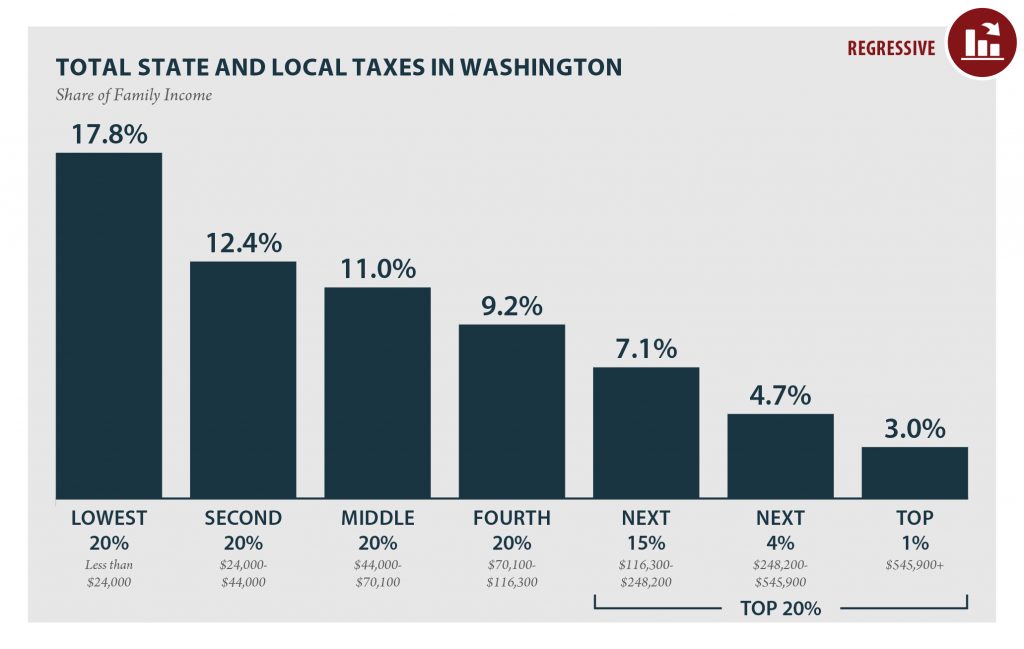
WASHINGTON Read as PDF WASHINGTON STATE AND LOCAL TAXES Taxes as Share of Family Income Top 20% Income Group Lowest 20% Second 20% Middle 20% Fourth 20% Next 15% Next 4% Top 1% Income Range Less than $24,000 $24,000 to $44,000 $44,000 to $70,100 $70,100 to $116,300 $116,300 to $248,200 $248,200 to $545,900 over $545,900 […]
Connecticut: Who Pays? 6th Edition
October 17, 2018 • By ITEP Staff
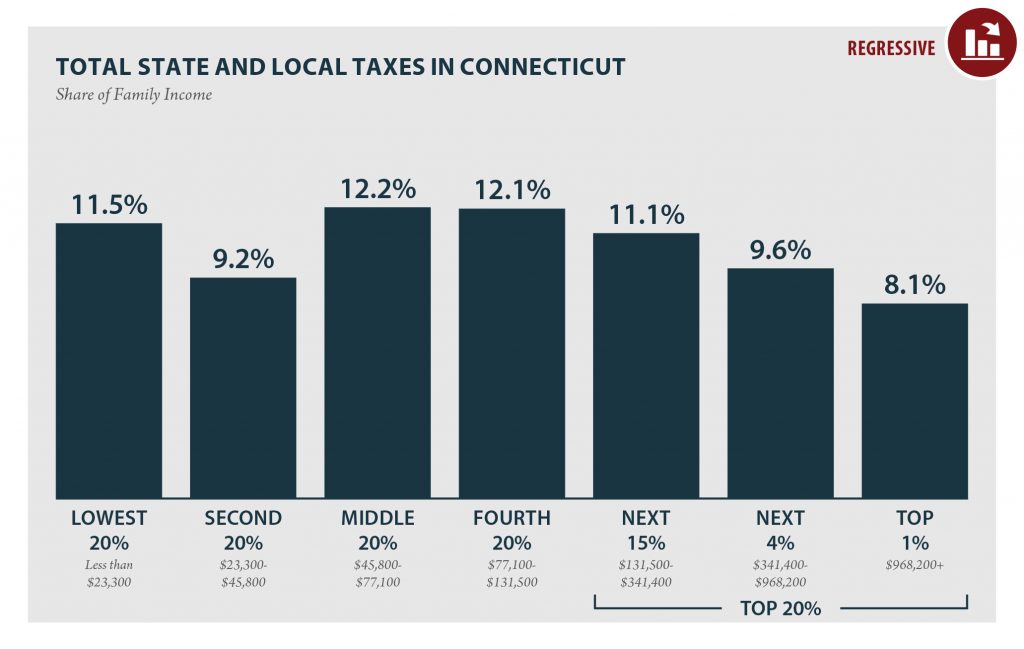
CONNECTICUT Read as PDF CONNECTICUT STATE AND LOCAL TAXES Taxes as Share of Family Income Top 20% Income Group Lowest 20% Second 20% Middle 20% Fourth 20% Next 15% Next 4% Top 1% Income Range Less than $23,300 $23,300 to $45,800 $45,800 to $77,100 $77,100 to $131,500 $131,500 to $341,400 $341,400 to $968,200 over $968,200 […]
Indiana: Who Pays? 6th Edition
October 17, 2018 • By ITEP Staff
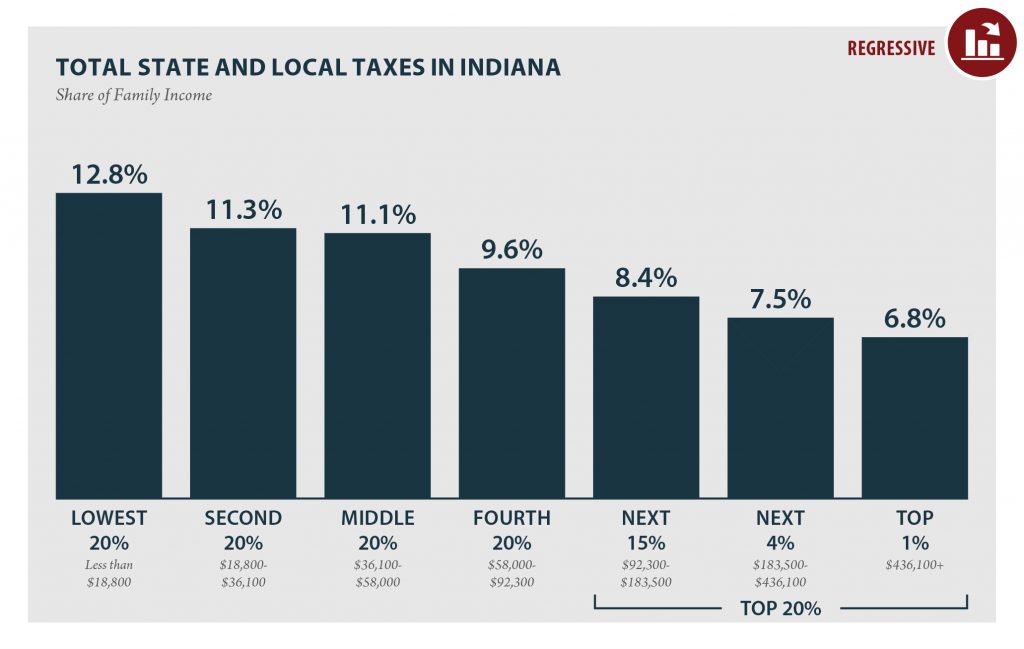
INDIANA Read as PDF INDIANA STATE AND LOCAL TAXES Taxes as Share of Family Income Top 20% Income Group Lowest 20% Second 20% Middle 20% Fourth 20% Next 15% Next 4% Top 1% Income Range Less than $18,800 $18,800 to $36,100 $36,100 to $58,000 $58,000 to $92,300 $92,300 to $183,500 $183,500 to $436,100 over $436,100 […]
Idaho: Who Pays? 6th Edition
October 17, 2018 • By ITEP Staff
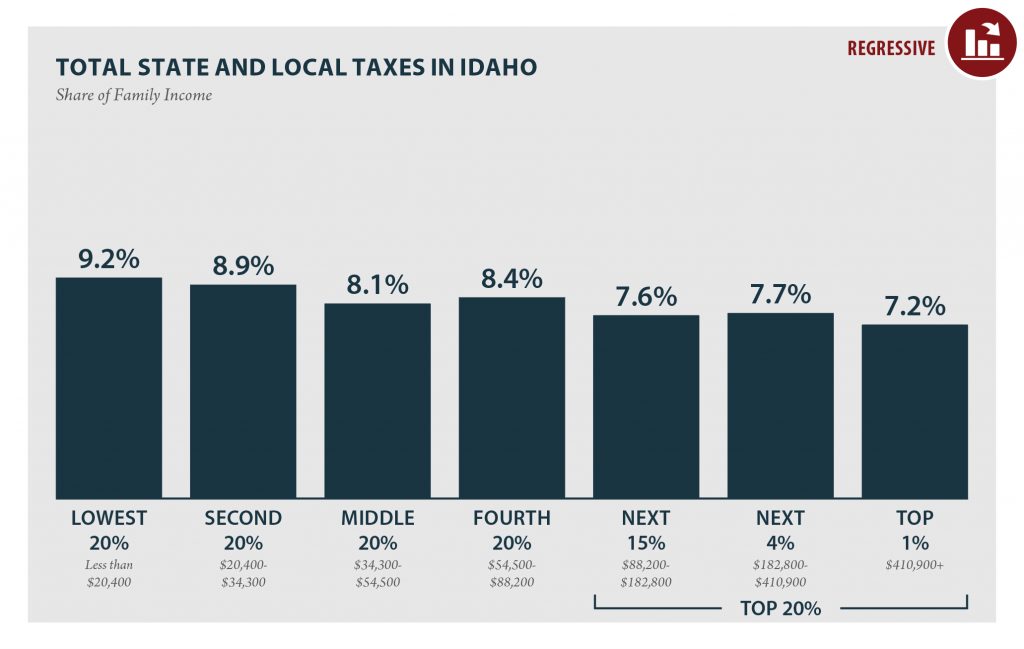
According to ITEP’s Tax Inequality Index, which measures the impact of each state’s tax system on income inequality, Idaho has the 38th most unfair state and local tax system in the country. Incomes are more unequal in Idaho after state and local taxes are collected than before.
South Dakota: Who Pays? 6th Edition
October 17, 2018 • By ITEP Staff
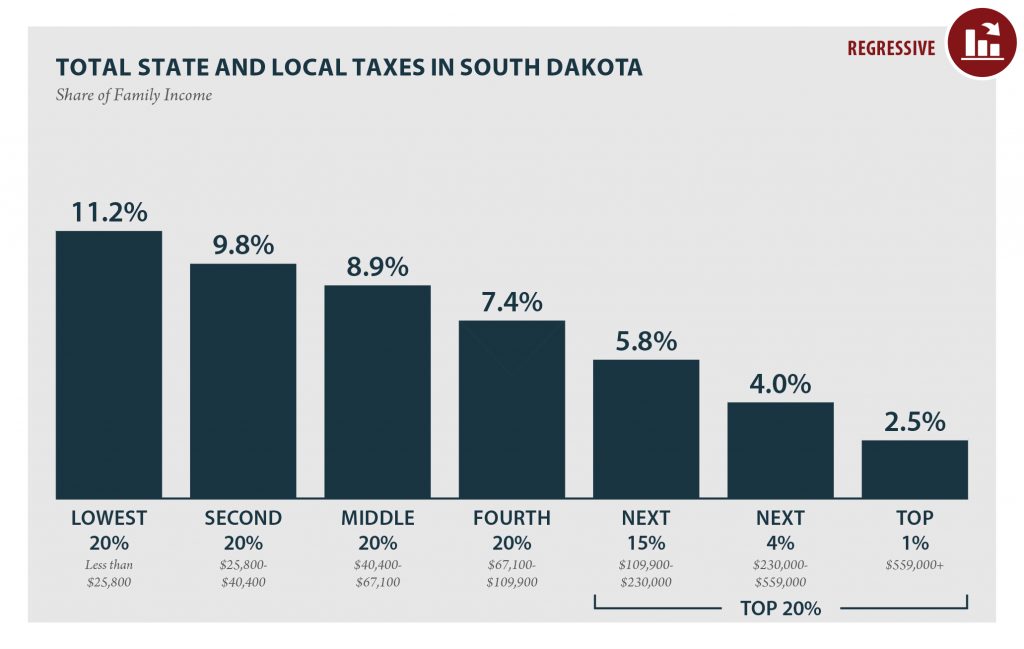
SOUTH DAKOTA Read as PDF SOUTH DAKOTA STATE AND LOCAL TAXES Taxes as Share of Family Income Top 20% Income Group Lowest 20% Second 20% Middle 20% Fourth 20% Next 15% Next 4% Top 1% Income Range Less than $25,800 $25,800 to $40,400 $40,400 to $67,100 $67,100 to $109,900 $109,900 to $230,000 $230,000 to $559,000 […]
Kansas: Who Pays? 6th Edition
October 17, 2018 • By ITEP Staff
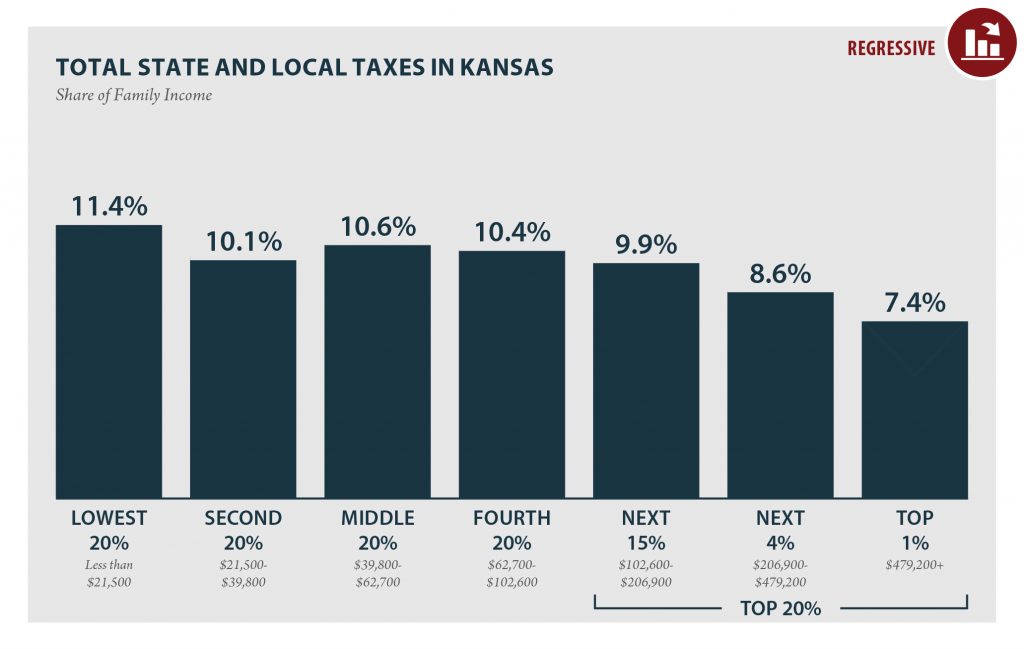
KANSAS Read as PDF KANSAS STATE AND LOCAL TAXES Taxes as Share of Family Income Top 20% Income Group Lowest 20% Second 20% Middle 20% Fourth 20% Next 15% Next 4% Top 1% Income Range Less than $21,500 $21,500 to $39,800 $39,800 to $62,700 $62,700 to $102,600 $102,600 to $206,900 $206,900 to $479,200 over $479,200 […]
Read the Report in PDF The 2015 Who Pays: A Distributional Analysis of the Tax Systems in All Fifty States (the fifth edition of the report) assesses the fairness of state and local tax systems by measuring the state and local taxes that will be paid in 2015 by different income groups as a share […]
Delaware
July 25, 2012 • By ITEP Staff
RESOURCES State Tax & Revenue Information Delaware Department of Finance – Fiscal Notebook Delaware Department of Finance – General Fund Revenue Portfolio Delaware Economic and Financial Advisory Council (DEFAC) – Revenue Forecast Delaware Office of Management & Budget – Budget Development, Planning, & Administration Delaware General Assembly – Office of the Controller General […]
Connecticut
July 25, 2012 • By ITEP Staff
RESOURCES State Tax & Revenue Information Connecticut Department of Revenue – Tax Research Library Connecticut Office of Policy and Management – Budget & Financial Management Division Connecticut Office of Policy and Management – Municipal Data Connecticut General Assembly – Office of Fiscal Analysis Connecticut General Assembly – Office of Legislative Research Tax […]

Institute on Taxation
and Economic Policy
ITEP is a non-profit, non-partisan tax policy organization. We conduct rigorous analyses of tax and economic proposals and provide data-driven recommendations to shape equitable and sustainable tax systems.
Subscribe to ITEP Emails
Tax research and policy news in your inbox.
Promote Fair Tax Policy
Your gift to ITEP promotes tax justice. With your help, we do research that supports taxing millionaires and billionaires, taxing big corporations and raising revenue for the things our people, our communities and our planet need.
Together, we can create a country with more economic justice, more racial justice, more climate justice… and more tax justice.