Who Pays?
District of Columbia: Who Pays? 7th Edition
January 9, 2024 • By ITEP Staff
District of Columbia Download PDF All figures and charts show 2024 tax law in the District of Columbia, presented at 2023 income levels. Senior taxpayers are excluded for reasons detailed in the methodology. Our analysis includes nearly 100 percent of DC’s tax revenue. These figures depict the District’s EITC for workers with children at its […]
Delaware: Who Pays? 7th Edition
January 9, 2024 • By ITEP Staff
Delaware Download PDF All figures and charts show 2024 tax law in Delaware, presented at 2023 income levels. Senior taxpayers are excluded for reasons detailed in the methodology. Our analysis includes nearly 100 percent of state and local tax revenue collected in Delaware. State and local tax shares of family income Top 20% Income Group […]
Alaska: Who Pays? 7th Edition
January 9, 2024 • By ITEP Staff
Alaska Download PDF All figures and charts show 2024 tax law in Alaska, presented at 2023 income levels. Senior taxpayers are excluded for reasons detailed in the methodology. Our analysis includes nearly all (99.5 percent) state and local tax revenue collected in Alaska. State and local tax shares of family income Top 20% Income Group […]
Connecticut: Who Pays? 7th Edition
January 9, 2024 • By ITEP Staff
Connecticut Download PDF All figures and charts show 2024 tax law in Connecticut, presented at 2023 income levels. Senior taxpayers are excluded for reasons detailed in the methodology. Our analysis includes nearly 100 percent of state and local tax revenue collected in Connecticut. State and local tax shares of family income Top 20% Income Group […]
Arizona: Who Pays? 7th Edition
January 9, 2024 • By ITEP Staff
Arizona Download PDF All figures and charts show 2024 tax law in Arizona, presented at 2023 income levels. Senior taxpayers are excluded for reasons detailed in the methodology. Our analysis includes nearly all (99.9 percent) state and local tax revenue collected in Arizona. As seen in Appendix D, recent legislative changes have significantly increased the […]
Alabama: Who Pays? 7th Edition
January 8, 2024 • By ITEP Staff
Alabama Download PDF All figures and charts show 2024 tax law in Alabama, presented at 2023 income levels. Senior taxpayers are excluded for reasons detailed in the methodology. Our analysis includes nearly all (99 percent) state and local tax revenue collected in Alabama. These figures depict Alabama’s grocery sales tax rate at its 2024 level […]
Who Pays? 7th Edition: Methodology and Discussion
January 8, 2024 • By ITEP Staff
Section 1: Methodology The Institute on Taxation and Economic Policy (ITEP) has engaged in research on tax issues since 1980, with a focus on the distributional consequences of current law and proposed changes. Much of ITEP’s research, including this report, is based on ITEP’s proprietary microsimulation tax model, which estimates the amount of federal, state, […]
Colorado: Who Pays? 7th Edition
January 8, 2024 • By ITEP Staff
Colorado Download PDF All figures and charts show 2024 tax law in Colorado, presented at 2023 income levels. Senior taxpayers are excluded for reasons detailed in the methodology. Our analysis includes nearly all (99.2 percent) state and local tax revenue collected in Colorado. These figures depict Colorado’s EITC at its 2024 level of 38 percent […]
California: Who Pays? 7th Edition
January 8, 2024 • By ITEP Staff
California Download PDF All figures and charts show 2024 tax law in California, presented at 2023 income levels. Senior taxpayers are excluded for reasons detailed in the methodology. Our analysis includes nearly all (99.2 percent) state and local tax revenue collected in California. State and local tax shares of family income Top 20% Income Group […]
Arkansas: Who Pays? 7th Edition
January 8, 2024 • By ITEP Staff
Arkansas Download PDF All figures and charts show 2024 tax law in Arkansas, presented at 2023 income levels. Senior taxpayers are excluded for reasons detailed in the methodology. Our analysis includes nearly all (99.5 percent) state and local tax revenue collected in Arkansas. As seen in Appendix D, recent legislative changes have significantly increased the […]
New York Times: What’s the Matter With Miami?
August 4, 2023
For a couple of years after the pandemic struck, there was considerable buzz to the effect that much of the financial industry might leave New York for Miami. After all, state and local taxes on the richest one percent are much lower in Florida than in New York — about nine points lower as a percentage of income, according […]
The Sacramento Bee: Fact Check: Does California’s Middle Class Pay Less in Taxes Than in Other States?
June 21, 2023
“The American people don’t know this. We have the highest tax rate for the 1%, but middle-class families actually paid less than the majority of states in America in California,” Gov. Gavin Newsom told Fox News host Sean Hannity last week. The governor was half-right. Read more.
Who Pays? 7th Edition
December 14, 2022 • By ITEP Staff
Who Pays? is the only distributional analysis of tax systems in all 50 states and the District of Columbia. This comprehensive 7th edition of the report assesses the progressivity and regressivity of state tax systems by measuring effective state and local tax rates paid by all income groups.
The nation is currently engaging in serious discourse about how to expand economic opportunity and remedy income inequality via the federal tax code. State tax systems are also important and have a dismal effect on the growing economic divide. In a new report, Fairness Matters: A Chart Book on Who Pays State and Local Taxes, we further parse our Who Pays? data.
A Tale of Two States: How State Tax Systems Perpetuate Income Inequality
February 11, 2019 • By ITEP Staff
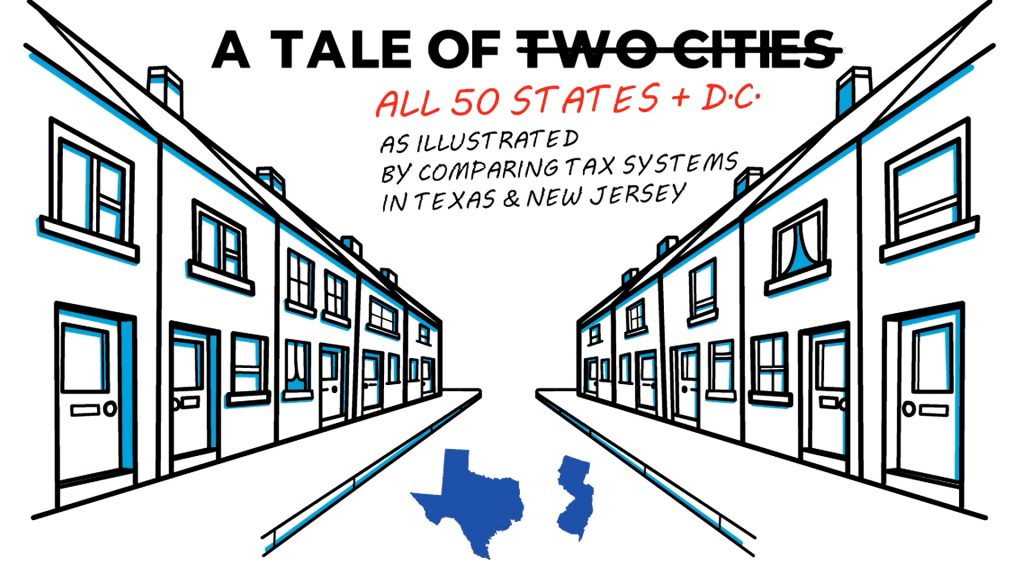
To explain how state tax systems make income inequality worse, we compared tax systems in New Jersey and Texas which, before taxes, have similar levels of income inequality. This comparison provides an example of how policymakers’ decisions affect the economic wellbeing of their constituents.
Data for the Win: Advocating for Equitable State and Local Tax Policy (Webinar)
January 30, 2019 • By Aidan Davis, Dylan Grundman O'Neill, ITEP Staff, Meg Wiehe
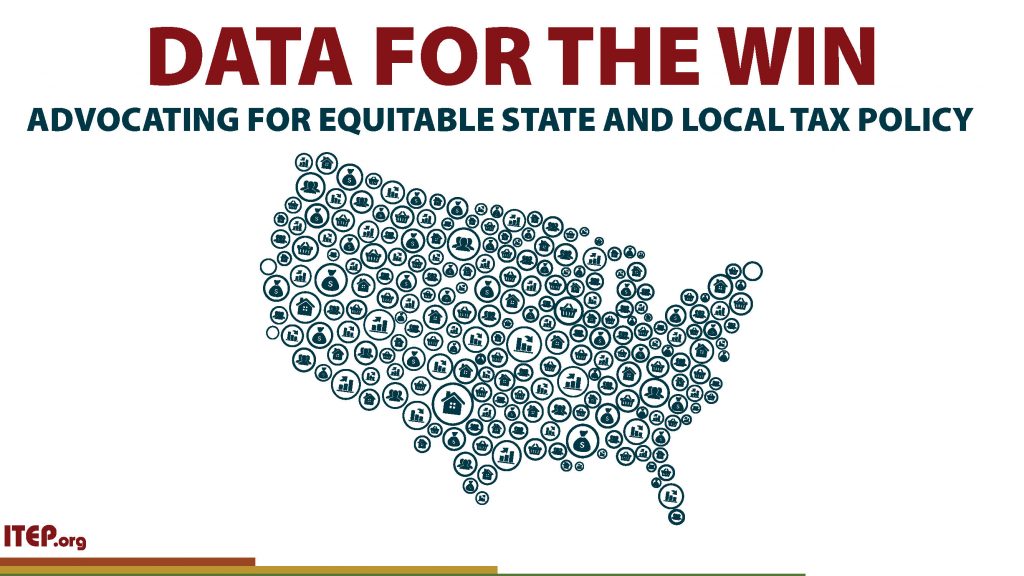
Watch the video recording below for discussion on how ITEP’s distributional data can be part of an advocacy and communications strategy for securing state tax policies that raise enough revenue to fund various priorities. Outline includes a brief overview of findings from the sixth edition of Who Pays? A Distributional Analysis of the Tax Systems in All 50 States as well as insight from state advocates who use Who Pays? and other tax policy analyses research to pursue their legislative agendas.
Louisiana Budget Project: Tax Code Is Holding Louisiana Back
November 15, 2018
Years of efforts to reform Louisiana’s regressive and overly complicated tax code have run aground in the state Legislature. The result: Louisianans pay the second-highest sales taxes in the nation, while the tax code is riddled with costly exemptions and deductions. The state’s broken tax structure is a major reason why the state lurched from budget crisis to budget crisis over the last decade and has struggled to fund critical programs and services like higher education and health care. The Advocate’s editorial board shares its thoughts on the latest report from the Institute on Taxation and Economic Policy.
Louisiana Budget Project: Race Equity and Taxes in Louisiana
November 9, 2018
Louisiana’s upside-down tax structure means the highest income-earners pay less than the poorest families, when measured as a percentage of income. The Institute on Taxation and Economic Policy’s “Who Pays” report lays this out in careful detail, and the latest edition breaks down the tax distribution by race. The conclusion: Black households pay a higher percentage of their income in state and local taxes than white households. Louisiana has work to do to make the tax structure fairer and reduce racial inequalities.
Louisiana Budget Project: Louisiana’s Regressive Tax Structure
November 5, 2018
Poor and middle-income families in Louisiana pay state and local taxes at a higher rate than the wealthiest families. That’s the key takeaway from the latest state-by-state breakdown of tax distribution by income groups from the Institute on Taxation and Economic Policy (ITEP). Louisiana’s tax structure is the 14th most regressive in the nation.
Idaho Press: Economic Study Finds That Poor Idahoans Pay More State and Local Taxes Than Rich Ones
November 3, 2018
The biggest drivers of the inequality in Idaho are the sales and property taxes. In every bracket of income measured by the Institute’s report, the amount that families paid in state and excise taxes went down as their total income increased. The lowest-earning 20 percent spent twice as much of their annual income on property taxes as the highest 20 percent, with an average of 3.3 percent paid on their property compared to 1.6 percent.
Cherokee Tribune & Ledger-News: Financial Watchdog: Pritzker’s Spending Promises Would Raise Taxes on Middle Class
November 1, 2018
The Institute on Taxation and Economic Policy says Illinois has one of the most regressive taxes in the nation, largely due to its flat income tax. In its annual “Who pays?” report, the institute said the poorest 20 percent of Illinois households pay 14 percent of their income in taxes because of the flat tax in addition to high sales and property taxes.
Charleston Gazette-Mail: Statehouse Beat: Fake History on Teacher Strike Hard to Fathom
October 27, 2018
Speaking of the Senate, the nonpartisan Institute on Taxation and Economic Policy put out its annual “Who Pays” report on tax equity, which found the vast majority of states have tax systems that are inequitable, with lower- and middle-income families paying a larger percentage of income in taxes than upper-income families.It singled out the “Terrible 10” states with the most regressive tax systems, with the common denominator among those states being that they have no or very low income taxes, which they make up through having very high and broad-based sales taxes.
KUOW: A $40,000 Salary Is no Longer Middle Class in Washington State. Here’s Why.
October 26, 2018
Look what's happened to an income of $40,000. In 2015, the Institute on Taxation and Economic Policy (ITEP), based in Washington, D.C., looked at incomes in Washington state and found that a salary of $40,000 was still middle class. It was smack-dab in the middle of middle-earning incomes in the state. In 2018, ITEP looked again. This time, $40,000 had slipped a notch, to the second-lowest 20 percent of earners. The reason: More people in the state were making higher-end incomes.
The Olympian: Olympia Went to Court to Block an Income Tax Proposal. Two Years Later, It’s Backing Seattle’s Version.
October 26, 2018
In 2016, an Olympia household earning $25,000 a year paid about 13 percent of its income in state and local taxes, while a household earning $250,000 paid less than 4 percent, according to the resolution. A report this month from the Institute on Taxation and Economic Policy said Washington has the most regressive tax structure in the country, thanks to its lack of a personal income tax and comparatively high sales taxes.
Massachusetts Budget and Policy Center: Who Pays? Low and Middle Earners in Massachusetts Pay Larger Share of their Incomes in Taxes
October 25, 2018
Taxes are the main way communities pay for the things we do together. Taxes pay for essential programs and infrastructure we take for granted, like fire protection, public education, and health inspectors; roads, bridges, and public transit; and the support for people facing hard times. Examining how much people at different income levels pay in taxes is important when considering the fairness of tax policy.
Who Pays? A Distributional Analysis of the Tax Systems in All 50 States is the Institute on Taxation and Economic Policy’s flagship report. First published in 1996, and updated most recently in 2024, Who Pays? shows the distributional impact by income level of all major state and local taxes in each state, as well as in the District of Columbia. This section highlights related Who Pays? resources, articles and information.

Institute on Taxation
and Economic Policy
ITEP is a non-profit, non-partisan tax policy organization. We conduct rigorous analyses of tax and economic proposals and provide data-driven recommendations to shape equitable and sustainable tax systems.
Subscribe to ITEP Emails
Tax research and policy news in your inbox.
Promote Fair Tax Policy
Your gift to ITEP promotes tax justice. With your help, we do research that supports taxing millionaires and billionaires, taxing big corporations and raising revenue for the things our people, our communities and our planet need.
Together, we can create a country with more economic justice, more racial justice, more climate justice… and more tax justice.