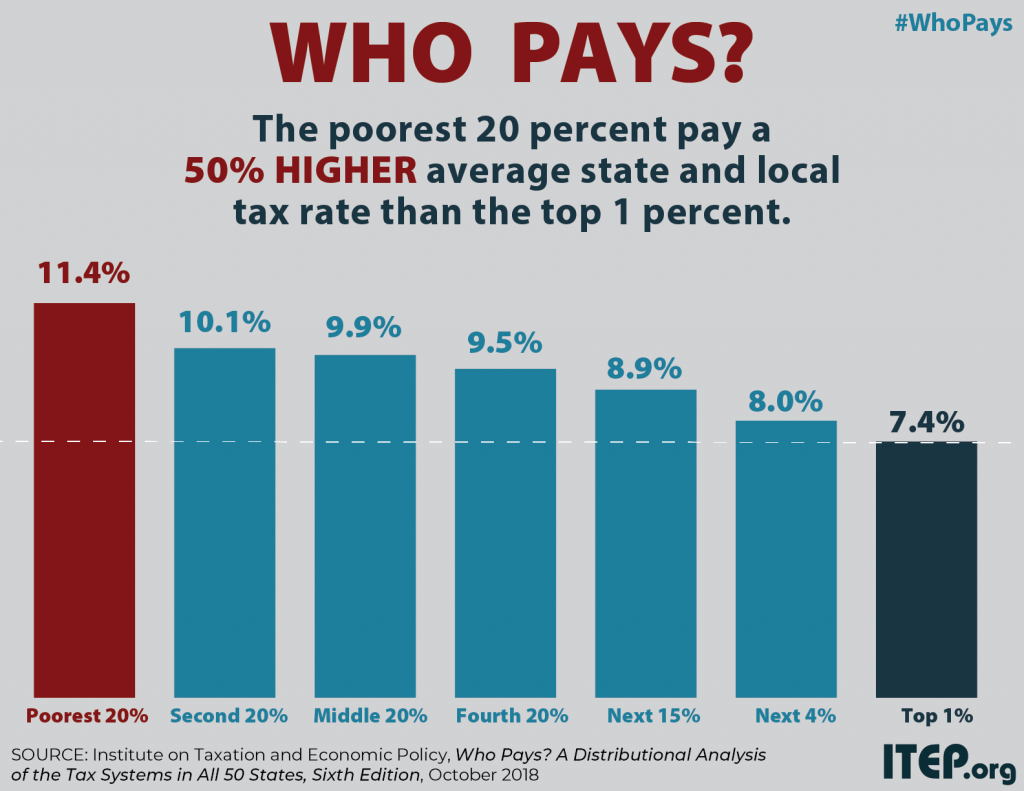
Who Pays?
The Half Sheet: Virginia’s Tax System Is Upside Down
October 17, 2018
Virginia’s state and local taxes help to shape economic opportunity across the state. That’s because state and local revenues pay for the building blocks of thriving communities: schools, roads, libraries, and other public services. Unfortunately, the current state and local tax system is upside down. Families in Virginia have taxes withheld from their paychecks, and they also pay taxes when they shop at local businesses, buy groceries, or fill their gas tanks. But updated analysis from the Institute on Taxation and Economic Policy (ITEP) shows that Virginia’s low- and moderate-income households pay a higher share of their incomes toward state…
Oklahoma Policy Institute: New Analysis: Low-income Taxpayers in Oklahoma Pay More than Twice the Tax Rate Paid by the Richest Oklahomans
October 17, 2018
While Oklahoma has a reputation as a low tax state, poor and middle-income Oklahomans are actually paying a greater share of their income in taxes than the national average, while the richest 5 percent of households — with annual incomes of $194,500 or more — pay less.
Budget and Policy Center: Unacceptable. Washington Still Has the Nation’s Most Inequitable State Tax Code
October 17, 2018
Washington state continues to have the most upside-down tax code of any U.S. state, according to a new report from the Institute on Taxation and Economic Policy (ITEP). It wrongly requires people with the lowest incomes to pay six times more in taxes as a percent of their income than the state’s wealthiest residents to fund investments that benefit all Washingtonians.
Florida Policy Institute: Florida Has Third Most Unfair State and Local Tax System
October 17, 2018
Florida’s reputation as a “low-tax” state belies the reality that it is, in fact, a high-tax state for low- and moderate-income residents. Floridians with the lowest incomes — those earning less than $18,700 — contribute 12.7 percent of their incomes to state and local taxes, while the wealthiest top 1 percent — those with incomes of more than $548,700 — contribute just 2.3 percent of their income.
Louisiana Budget Project: Who Pays Taxes in Louisiana?
October 17, 2018
When it comes to paying for government services, Louisiana asks a lot more of those with the fewest resources than it does of its wealthiest citizens, according to new analysis by the Institute on Taxation and Economic Policy. Thanks to a heavy reliance on sales taxes and tax exemptions that favor the wealthy, the less you earn in Louisiana, the more of you pay in taxes as a percentage of income.
Center on Budget Policy Priorities: State, Local Tax Systems Worsening Inequality
October 17, 2018
State and local tax systems can be a powerful tool for boosting economic opportunity, creating broadly shared prosperity, and building equitable state economies. But in nearly every state, they’re reinforcing and often worsening inequality, as the Institute on Taxation and Economic Policy shows in a new report.
Kentucky Center for Economic Policy: New Report: Wealthiest Kentuckians Pay the Lowest Tax Rate and the Problem Is Worsening
October 17, 2018
The study, Who Pays? A Distributional Analysis of the Tax Systems in All 50 States, evaluates the major components of state and local tax systems – including personal and corporate income taxes, property taxes, sales taxes and other excise taxes – for their overall distributional impact across income groups. For example, Kentucky’s low income tax credit means that people in poverty do not pay state income taxes. However, because the state fails to provide refundable tax credits to offset sales, excise and property taxes paid by low-income people, and because the state has a flat as opposed to graduated income…
Indiana Institute for Working Families: New Analysis: Indiana’s Tax System is Among the Dozen Most Regressive in the Country
October 17, 2018
The new ‘Who Pays?’ analysis follows the Institute’s August report ‘The Status of Working Families in Indiana, 2018’ which found the wealthiest Indiana earners have received an extra $2,446 from combined state income, corporate, and fuel tax changes since 2012, while taxes for the bottom 60% of middle class and working families have increased by an average $36.
Insider NJ: New Analysis: Middle Class Taxpayers in New Jersey Still Paying More Than Tax Rate Paid by Richest 1 Percent of New Jerseyans
October 17, 2018
A new study released today by the Institute on Taxation and Economic Policy (ITEP) and New Jersey Policy Perspective (NJPP) finds that New Jersey’s middle class families pay more in taxes as a percent of their income compared to the state’s wealthiest residents.
Politico Morning Tax: Desperately Seeking Clarity
October 17, 2018
MOST STATE TAX SYSTEMS REGRESSIVE: No state has more regressive taxes on its citizens than Washington, followed by Texas, Florida, South Dakota and Nevada, according to a distributional analysis of state tax systems that will be released today by the Institute on Taxation and Economic Policy. Most states take a larger share of income from low- and middle-income families than from wealthy families, it said. The 10 most regressive in the rankings tax their residents in the bottom 20 percent of the income scale at rates up to six times higher than the wealthy, while their middle-income families pay a rate up to…
Public News Service: Report: NM Tax Overhaul Would Benefit Kids, Families
October 17, 2018
Regressive tax systems hurt children and families, according to a new report from the Institute on Taxation and Economic Policy - and by that standard, it says New Mexico has the 19th-worst tax system in the United States. The study showed that as a share of their income, the lowest-income New Mexicans are paying state and local tax rates almost double those of the state's wealthiest residents.
New Report Finds that Upside-down State and Local Tax Systems Persist, Contributing to Inequality in Most States
October 17, 2018 • By Aidan Davis
State and local tax systems in 45 states worsen income inequality by making incomes more unequal after taxes. The worst among these are identified in ITEP’s Terrible 10. Washington, Texas, Florida, South Dakota, Nevada, Tennessee, Pennsylvania, Illinois, Oklahoma, and Wyoming hold the dubious honor of having the most regressive state and local tax systems in the nation. These states ask far more of their lower- and middle-income residents than of their wealthiest taxpayers.
Low Tax for Whom? Texas is a “Low Tax State” Overall, But Not for Families Living in Poverty
October 17, 2018 • By ITEP Staff
Texas’s tax system has vastly different impacts on taxpayers at different income levels. For instance, the lowest-income 20 percent of Texans contribute 13 percent of their income in state and local taxes — considerably more than any other income group in the state. For low-income families, Texas is far from being a low tax state; in fact, it is tied with Arizona as the sixth highest-tax state in the country for low-income families.
Low Tax for Whom? Washington is a “Low Tax State” Overall, But Not for Families Living in Poverty
October 17, 2018 • By ITEP Staff
Washington’s tax system has vastly different impacts on taxpayers at different income levels. For instance, the lowest-income 20 percent of Washingtonians contribute 17.8 percent of their income in state and local taxes — considerably more than any other income group in the state. For low-income families, Washington is far from being a low tax state; in fact, it is the highest-tax state in the country for low-income families.
Low Tax for Whom? Arizona is a “Low Tax State” Overall, But Not for Families Living in Poverty
October 17, 2018 • By ITEP Staff
Arizona’s tax system has vastly different impacts on taxpayers at different income levels. For instance, the lowest-income 20 percent of Arizonans contribute 13 percent of their income in state and local taxes — considerably more than any other income group in the state. For low-income families, Arizona is far from being a low tax state; in fact, it is tied with Texas as the sixth highest-tax state in the country for low-income families.
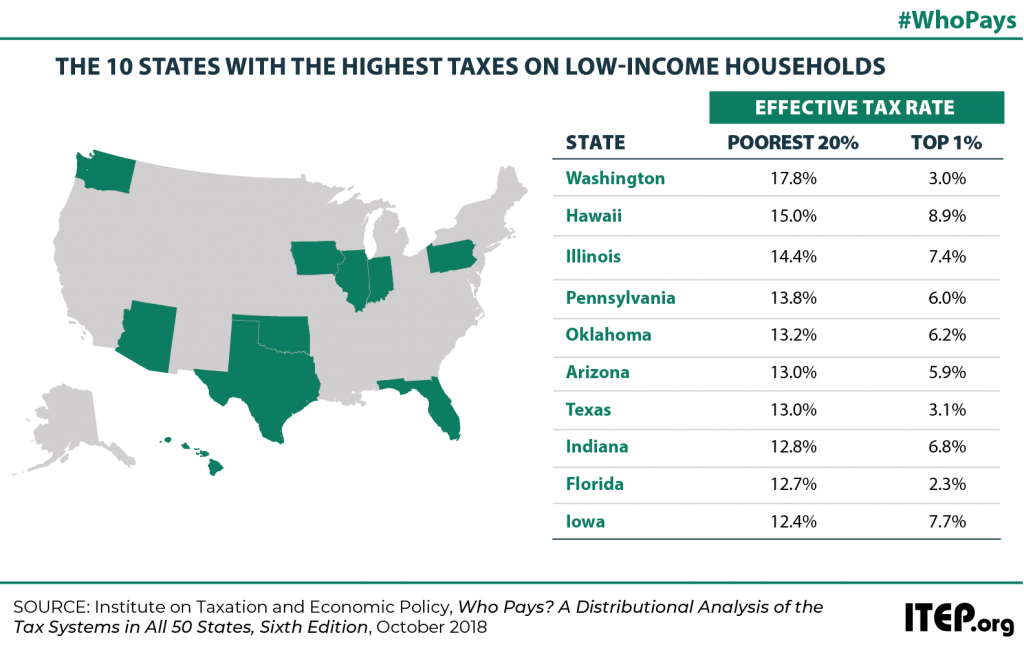
ITEP analysis reveals that many states traditionally considered to be “low-tax states” are actually high-tax for their poorest residents. The “low tax” label is typically assigned to states that either lack a personal income tax or that collect a comparatively low amount of tax revenue overall. But a focus on these measures can cause lawmakers to overlook the fact that state tax systems impact different taxpayers in very different ways, and that low-income taxpayers often do not experience these states as being even remotely “low tax.”
Low Tax for Whom? Indiana is a “Low Tax State” Overall, But Not for Families Living in Poverty
October 17, 2018 • By ITEP Staff
Indiana’s tax system has vastly different impacts on taxpayers at different income levels. For instance, the lowest-income 20 percent of Hoosiers contribute 12.8 percent of their income in state and local taxes — considerably more than any other income group in the state. For low-income families, Indiana is far from being a low tax state; in fact, it is the eighth highest-tax state in the country for low-income families.
Low Tax for Whom? Oklahoma is a “Low Tax State” Overall, But Not for Families Living in Poverty
October 17, 2018 • By ITEP Staff
Oklahoma’s tax system has vastly different impacts on taxpayers at different income levels. For instance, the lowest-income 20 percent of Oklahomans contribute 13.2 percent of their income in state and local taxes — considerably more than any other income group in the state. For low-income families, Oklahoma is far from being a low tax state; in fact, it is the fifth highest-tax state in the country for low-income families.
Low Tax for Whom? Florida is a “Low Tax State” Overall, But Not for Families Living in Poverty
October 17, 2018 • By ITEP Staff
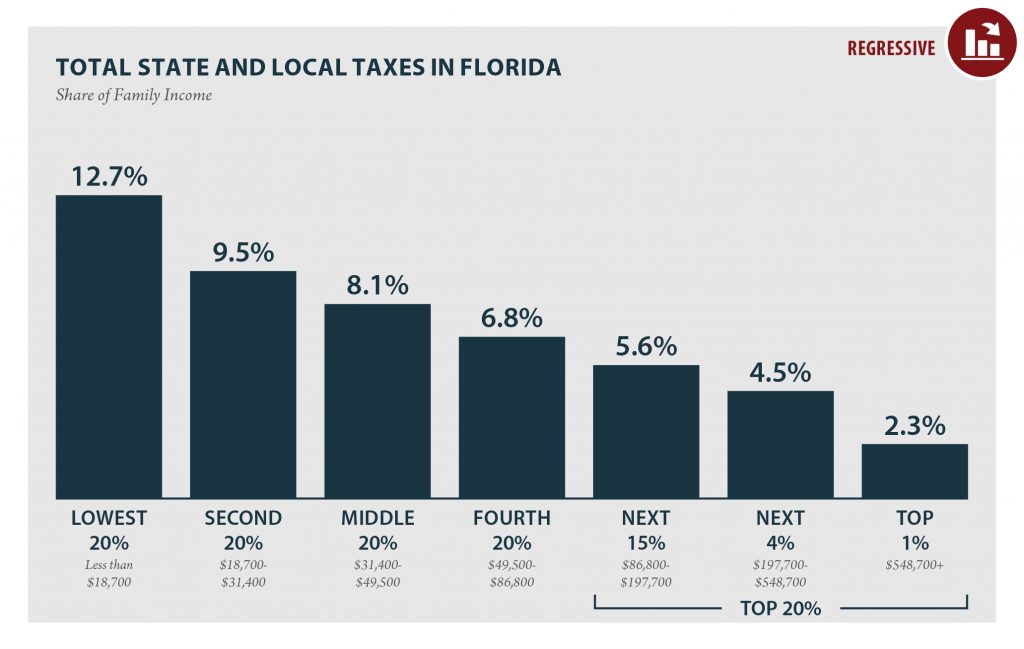
Florida’s tax system has vastly different impacts on taxpayers at different income levels. For instance, the lowest-income 20 percent of Floridians contribute 12.7 percent of their income in state and local taxes — considerably more than any other income group in the state. For low-income families, Florida is far from being a low tax state; in fact, it is the ninth highest-tax state in the country for low-income families.
West Virginia: Who Pays? 6th Edition
October 17, 2018 • By ITEP Staff
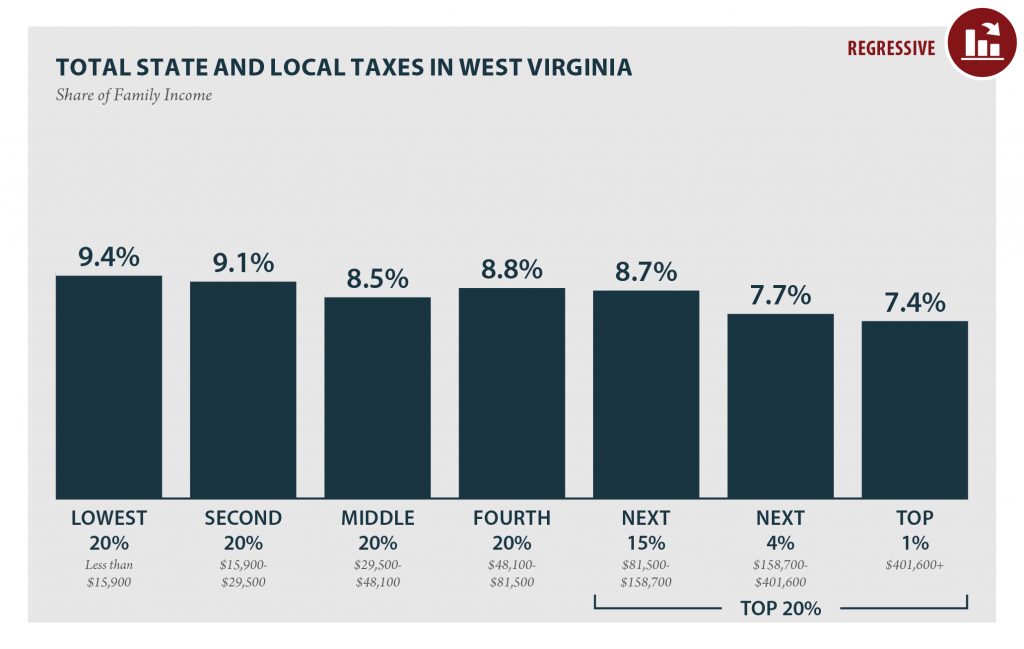
According to ITEP’s Tax Inequality Index, which measures the impact of each state’s tax system on income inequality, West Virginia has the 37th most unfair state and local tax system in the country. Incomes are more unequal in West Virginia after state and local taxes are collected than before.
District of Columbia: Who Pays? 6th Edition
October 17, 2018 • By ITEP Staff
According to ITEP’s Tax Inequality Index, the District of Columbia’s local tax system does not worsen income inequality and ranks 50th on the index. The large income gap between lower- and middle-income taxpayers, as compared to the wealthy, is somewhat narrower after state and local taxes than before.
Rhode Island: Who Pays? 6th Edition
October 17, 2018 • By ITEP Staff
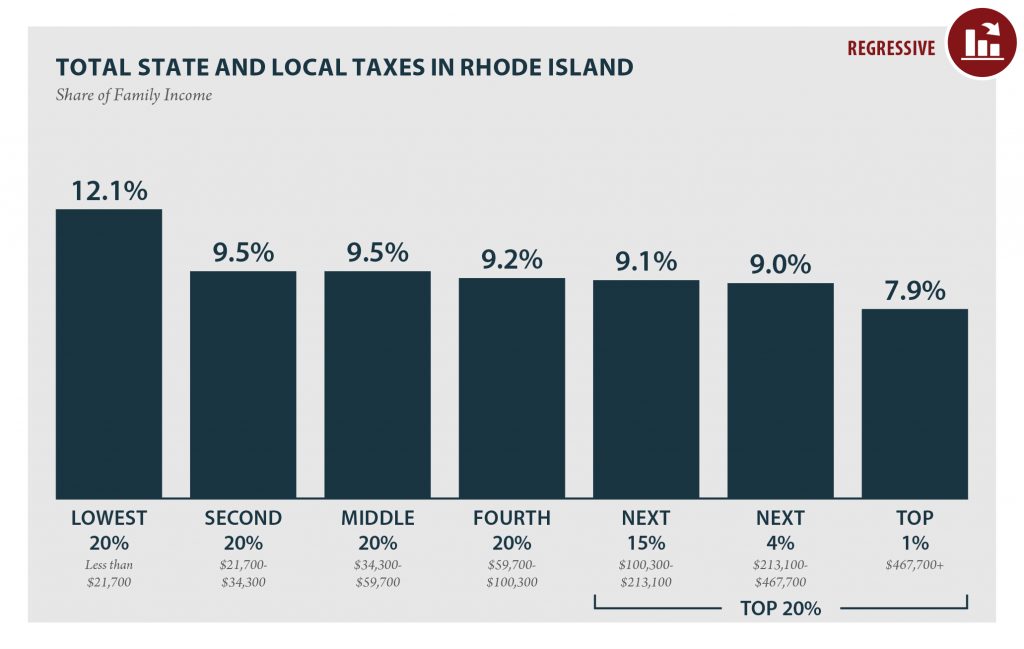
According to ITEP’s Tax Inequality Index, which measures the impact of each state’s tax system on income inequality, Rhode Island has the 32nd most unfair state and local tax system in the country. Incomes are more unequal in Rhode Island after state and local taxes are collected than before.
Colorado: Who Pays? 6th Edition
October 17, 2018 • By ITEP Staff
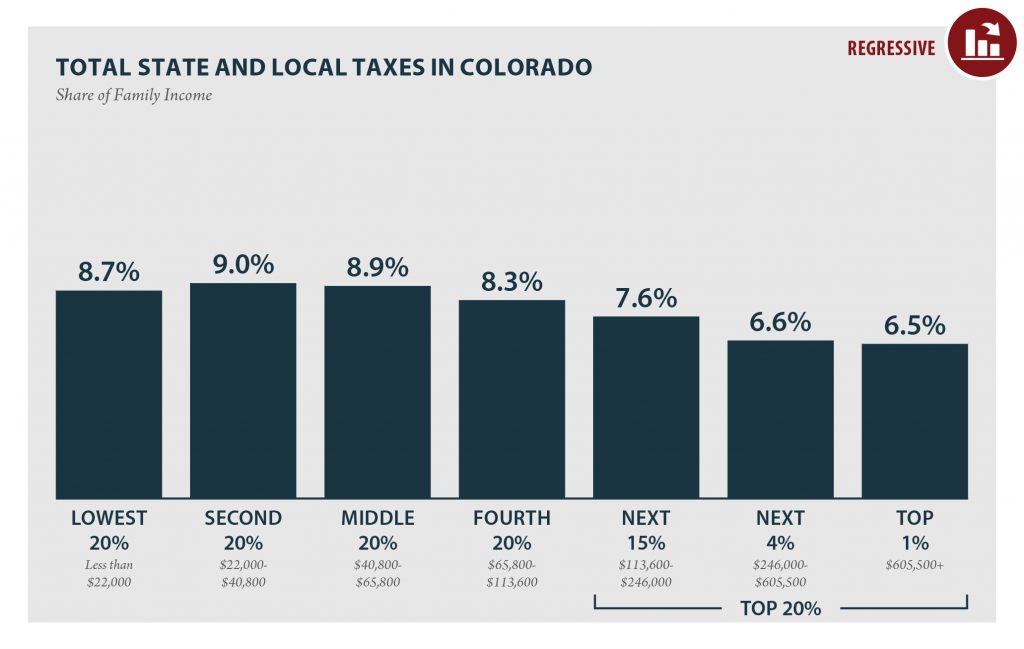
COLORADO Read as PDF COLORADO STATE AND LOCAL TAXES Taxes as Share of Family Income Top 20% Income Group Lowest 20% Second 20% Middle 20% Fourth 20% Next 15% Next 4% Top 1% Income Range Less than $22,000 $22,000 to $40,800 $40,800 to $65,800 $65,800 to $113,600 $113,600 to $246,000 $246,000 to $605,500 over $605,500 […]
North Dakota: Who Pays? 6th Edition
October 17, 2018 • By ITEP Staff
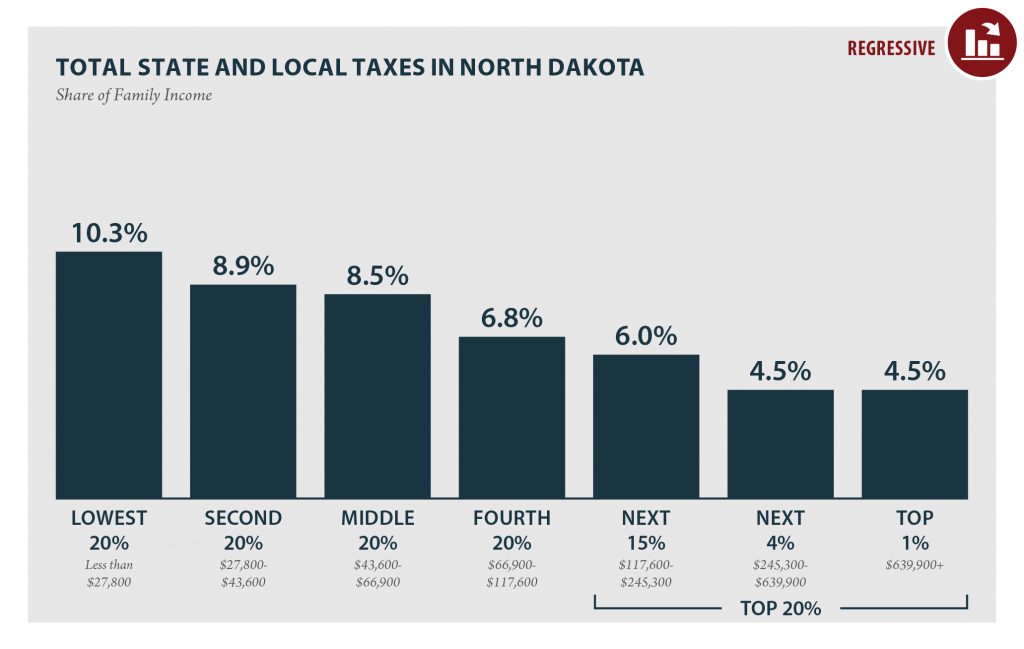
NORTH DAKOTA Read as PDF NORTH DAKOTA STATE AND LOCAL TAXES Taxes as Share of Family Income Top 20% Income Group Lowest 20% Second 20% Middle 20% Fourth 20% Next 15% Next 4% Top 1% Income Range Less than $27,800 $27,800 to $43,600 $43,600 to $66,900 $66,900 to $117,600 $117,600 to $245,300 $245,300 to $639,900 […]
District of Columbia: Who Pays? 6th Edition
October 17, 2018 • By ITEP Staff
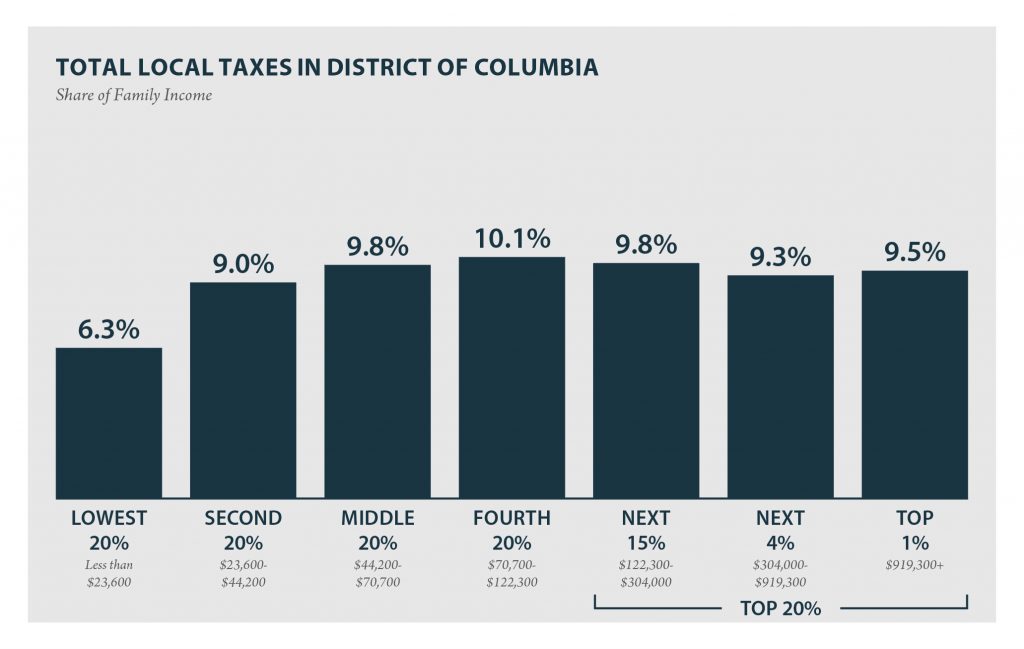
DISTRICT OF COLUMBIA Read as PDF DISTRICT OF COLUMBIA LOCAL TAXES Taxes as Share of Family Income Top 20% Income Group Lowest 20% Second 20% Middle 20% Fourth 20% Next 15% Next 5% Top 1% Income Range Less than $23,600 $23,600 to $44,200 $44,200 to $70,700 $70,700 to $122,300 $122,300 to $304,000 $304,000 to $919,300 […]
Who Pays? A Distributional Analysis of the Tax Systems in All 50 States is the Institute on Taxation and Economic Policy’s flagship report. First published in 1996, and updated most recently in 2024, Who Pays? shows the distributional impact by income level of all major state and local taxes in each state, as well as in the District of Columbia. This section highlights related Who Pays? resources, articles and information.

Institute on Taxation
and Economic Policy
ITEP is a non-profit, non-partisan tax policy organization. We conduct rigorous analyses of tax and economic proposals and provide data-driven recommendations to shape equitable and sustainable tax systems.
Subscribe to ITEP Emails
Tax research and policy news in your inbox.
Promote Fair Tax Policy
Your gift to ITEP promotes tax justice. With your help, we do research that supports taxing millionaires and billionaires, taxing big corporations and raising revenue for the things our people, our communities and our planet need.
Together, we can create a country with more economic justice, more racial justice, more climate justice… and more tax justice.